
Daily technical analysis and forecast for 10 November 2026
Daily technical analysis and forecast for EURUSD, USDJPY, GBPUSD, AUDUSD, USDCAD, XAUUSD, US 500, and BTCUSD for 10 November 2026.
Each scenario on this page reflects the market structure on the H4 chart as of 10:00 AM UTC+2 on 10 November 2026. The assessment considers the current H4 chart structure, key support and resistance levels, the direction of the medium-term movement, and the prevailing fundamental backdrop.
EURUSD forecast
The main event of the upcoming session will be the release of US October inflation data, scheduled for 3:30 PM (UTC+2). The result is not yet known at the time of writing. An acceleration in core prices could strengthen expectations of further Fed tightening and put pressure on EURUSD.
Conversely, a softer report would create conditions for dollar weakness. Geopolitical uncertainty and energy costs remain additional factors: more expensive imports worsen conditions for the European economy. The pair's morning rise should therefore be assessed alongside US bond yield movements and the market's reaction to the news, without prematurely concluding that the medium-term direction has changed.
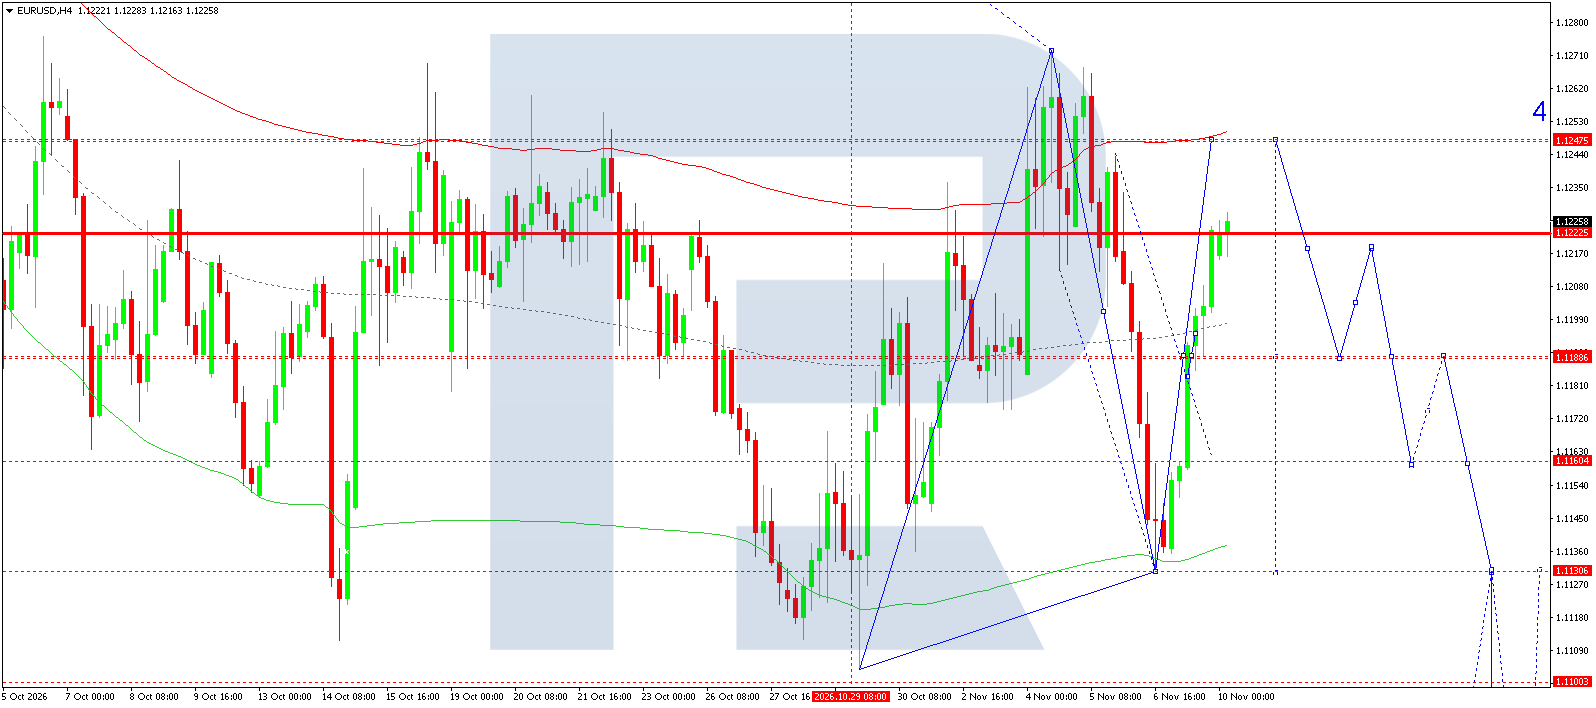
On the H4 chart, a sharp recovery impulse formed after the decline to 1.1130. The latest price shown is 1.1226, with the nearest resistance at 1.1247. The correction described in the example has therefore already largely materialised. The main working scenario envisages the recovery ending near the upper boundary of the marked Price Envelope, followed by renewed selling pressure.
The first downside reference level is 1.1189. Consolidation below this area would open the way towards 1.1160 and then 1.1130. The 1.1100 level remains an extension of the scenario, although reaching it within one session would require a pronounced impulse. The wave count allows for this sequence but does not confirm it in advance. The selected Sell entry is five points below the price shown. A stop above 1.1247 limits risk if the recovery continues, while the target is set at the nearest significant support, 1.1160. Consolidation above the 1.1272 resistance level would invalidate the priority given to a decline.
False breakouts of nearby levels are entirely possible ahead of the key US inflation data. A move towards resistance therefore does not in itself signal a reversal. The end of the correction is best assessed through candlestick closes and sellers' ability to keep prices below the highs reached.
EURUSD forecast scenario
USDJPY forecast
On the morning of 10 November, market participants are assessing the published summary of opinions from the October meeting. The Bank of Japanindicated that further rate increases remain possible if economic developments align with its forecasts. The document notes that underlying inflation is approaching its target and discusses the need to adjust the degree of monetary stimulus gradually. This supports the yen and makes a one-sided bet on its depreciation less robust.
At the same time, US interest rate conditions continue to support the dollar. However, the forthcoming US Consumer Price Index release at 3:30 PM (UTC+2) could change expectations for the Fed's next decision. Higher inflation would favour rising yields and USDJPY, while a weaker reading would create conditions for a decline in the pair. The cost of imported energy is significant for Japan's economy: higher prices worsen its terms of trade while increasing inflation risks. Geopolitical developments may therefore trigger a mixed yen reaction. This morning, it is preferable to consider both the interest rate differential and safe-haven demand, as neither factor alone determines the direction of the entire session.
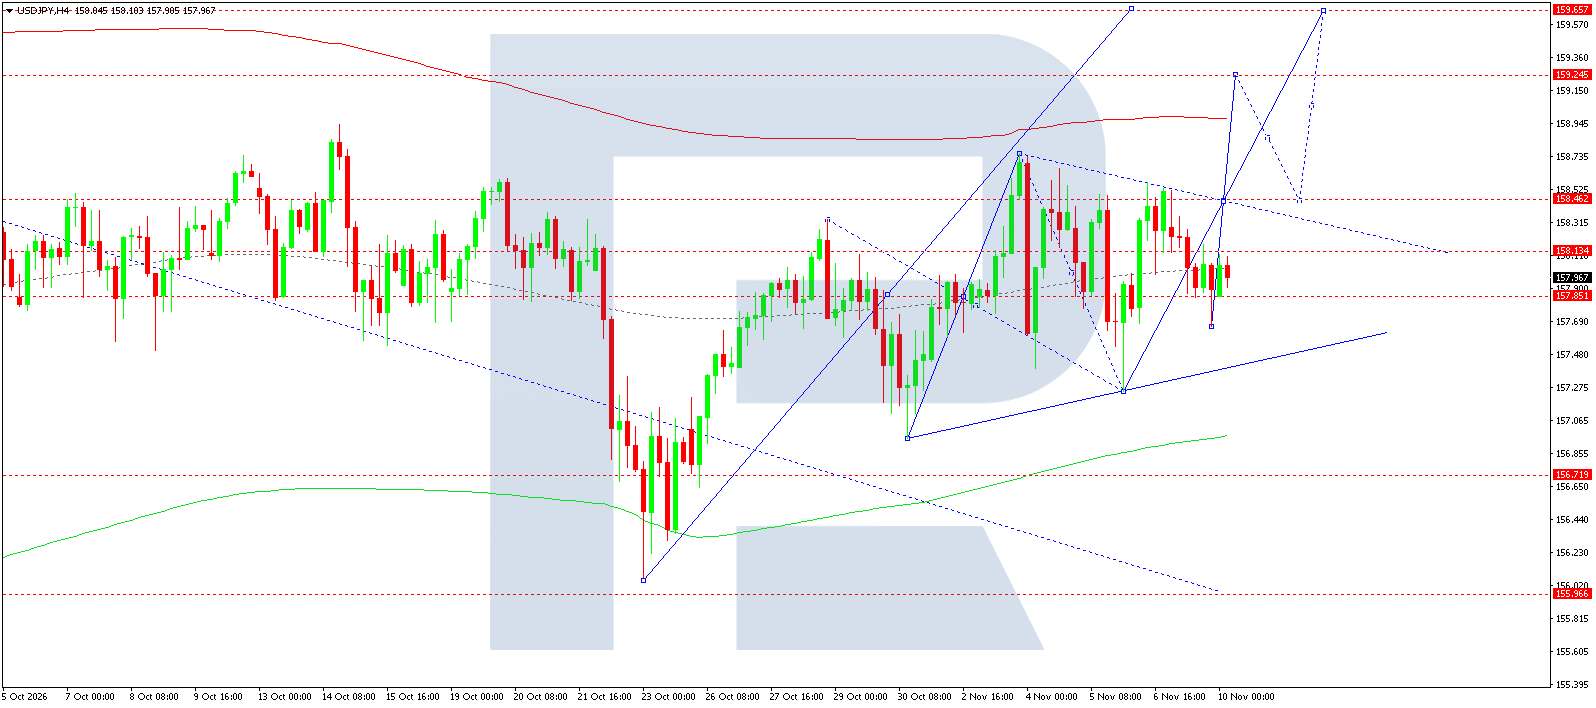
On H4, the latest price shown is 157.97. The market is consolidating between support at 157.85 and resistance at 158.13–158.46. The suggestion that consolidation is occurring exclusively below 157.83 therefore needs clarification. A series of higher swing lows has been maintained since October's low, although the local rise is still capped by a descending resistance line.
The main scenario envisages holding 157.85 and recovering towards 158.13, followed by 158.46. Only consolidation above the latter would confirm the potential for a move towards 159.25. The 159.66 level is considered the next target if the impulse develops, rather than an obligatory result for today. The Buy entry is at 158.02, five points above the current chart level, with a stop at 157.65 and a target at 159.25. A breakout below support and a return beneath the ascending support line would weaken the scenario. In that case, a deeper correction would become more likely before buyers could resume a sustained advance.
As the currency market remains range-bound, entering before 158.13 is overcome is an anticipatory trade. Holding above that level would strengthen the working hypothesis, while repeated unsuccessful attempts to rise would increase the likelihood of further sideways movement before the US data release.
USDJPY forecast scenario
GBPUSD forecast
On 5 November, the Bank of England raised its rate by a quarter of a percentage point to 4.00%. The decision was approved by eight votes to one, with the sole dissenter favouring a larger increase. The regulator linked the tightening to inflation risks and higher energy costs. September inflation reached 3.5%, and the updated forecast envisages a further increase in price pressures. For sterling, this provides interest rate support while increasing the risks of a slowdown in domestic demand.
The fundamental picture therefore does not justify automatically extending the technical downside scenario to the whole session. The US inflation report at 3:30 PM (UTC+2) will be the key external reference point. Persistent US price pressures could strengthen the dollar, while slowing inflation would support a GBPUSD recovery. Energy costs and developments in the Middle East conflict are also significant. For the UK economy, which imports energy, persistently higher commodity prices put pressure on real incomes and business costs. The morning balance of factors remains contradictory: the higher UK rate helps the currency but also makes the economy more sensitive to financial conditions and limits buyers' confidence.
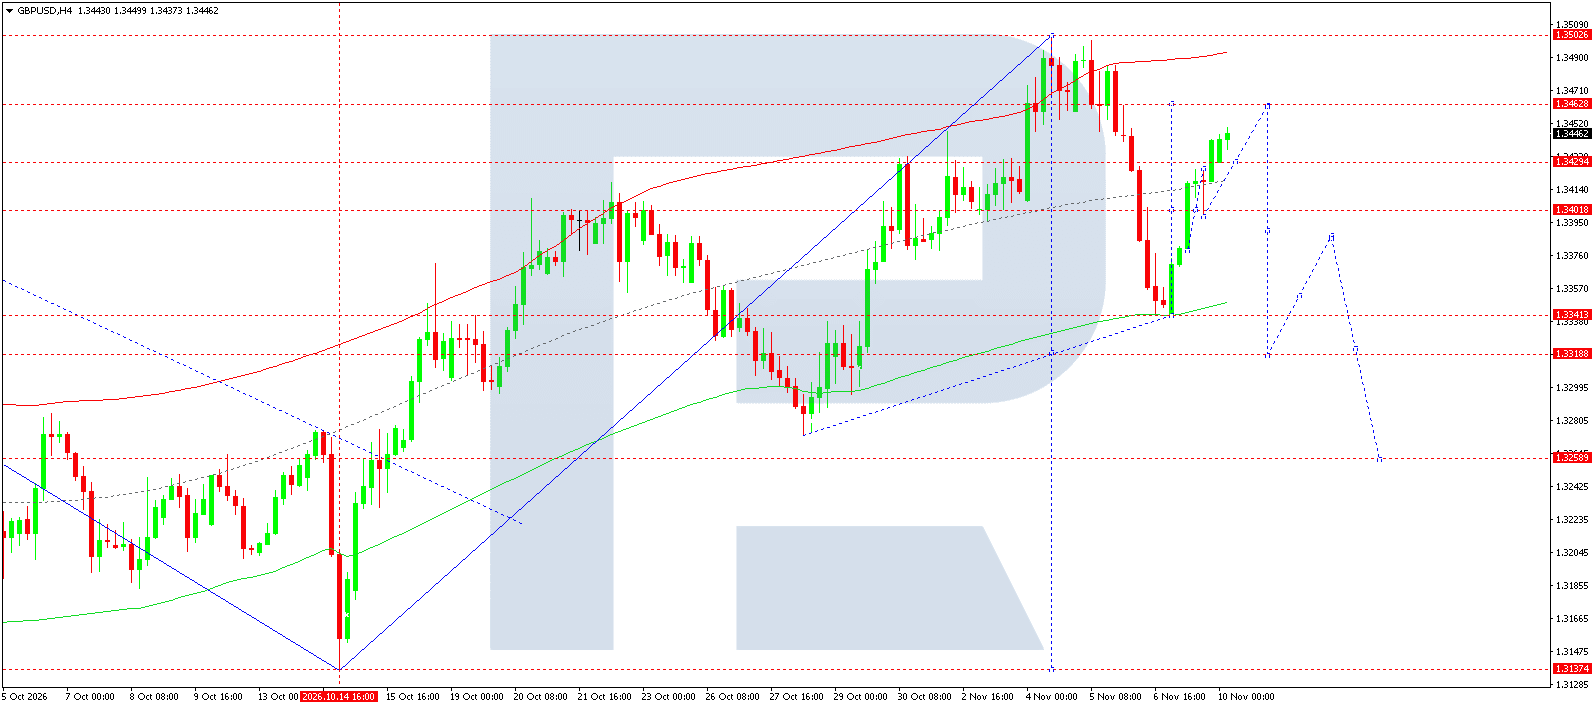
On H4, the latest price is 1.3446. Following a decline to 1.3341, the pair recovered above 1.3402 and is approaching resistance at 1.3463. The 1.3341 level corresponds to the low of the latest wave shown on the chart; the 1.3400 level mentioned in the example has already been passed during the recovery. The overall structure allows for a corrective rise before another decline.
The preferred scenario envisages a failure to consolidate above 1.3463 and a return towards 1.3402. Subsequent support levels are 1.3341 and 1.3319. A breakout below them would open the way towards 1.3259. The lower 1.3233 target is absent from the nearest horizontal levels on the image and is therefore secondary in the daily plan. Selling is planned at 1.3441, with a stop at 1.3476 and a target at 1.3341. A possible preliminary test of resistance preserves the risk of an early entry. Consolidation above 1.3463 would weaken the bearish interpretation and increase the probability of another test of the 1.3503 area.
If the current morning rise continues without signs of weakening, the sell order at the specified level may not be triggered. The preference for a decline is based on the price's position relative to resistance and requires a new selling impulse after the present corrective wave ends on the four-hour chart.
GBPUSD forecast scenario
AUDUSD forecast
On 3 November, the Reserve Bank of Australia raised its rate by a quarter of a percentage point to 4.85%. The decision reflects continued broad-based inflation, the impact of high fuel prices, and domestic supply constraints. The regulator also noted a worsening outlook for consumption and the housing market. Higher yields on Australian instruments are therefore accompanied by a risk of economic slowing, leaving the fundamental support for the currency mixed.
Internationally, AUDUSD is sensitive to expectations for US monetary policy and overall risk appetite. Today's session centres on October US inflation, due at 3:30 PM (UTC+2). Strong figures could strengthen the dollar and limit the pair's recovery. A weaker report would create conditions for the upward correction to continue. Commodity demand and economic activity among Australia's trading partners also matter, but individual reports should not automatically be treated as confirmation of a sustained reversal. Geopolitical tensions affect both energy costs and investors' willingness to hold risk-sensitive currencies. This balance increases the probability of moves in both directions after the data release.
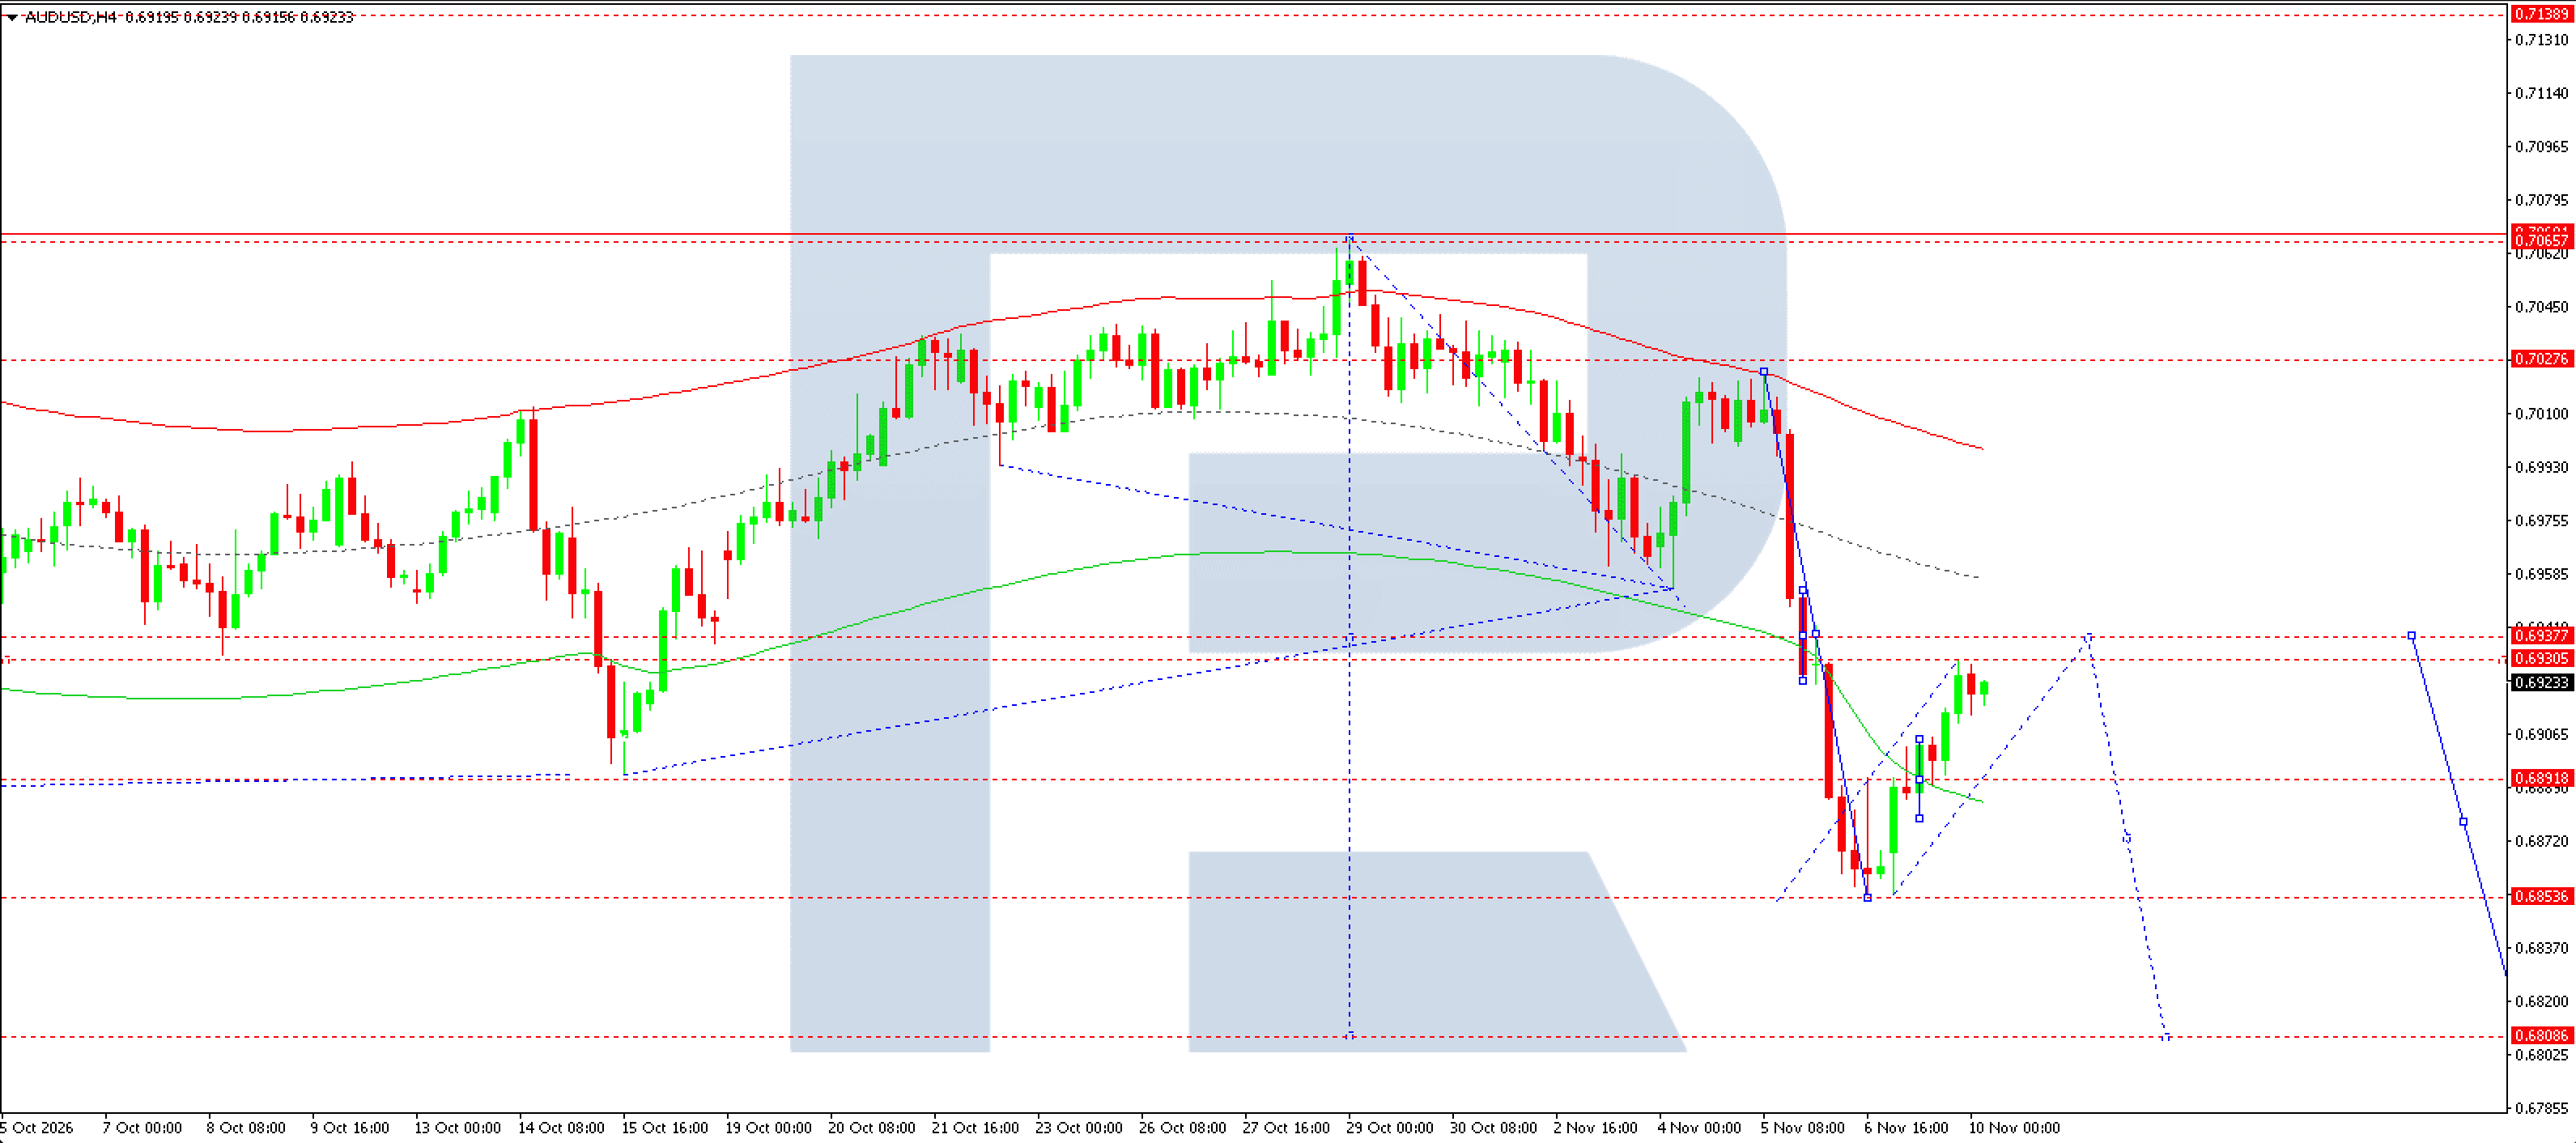
The H4 chart retains a downward structure from October's peak. After falling to 0.6854, the price recovered to 0.6923 but remains below the nearest resistance area at 0.6931–0.6938. The current move is therefore seen as a correction within the previous decline. The centre dotted line of the Price Envelope shown is above the market, further limiting confidence in a sustainable recovery.
The main scenario envisages the correction ending near 0.6938 and a return towards 0.6892. A breakout below that support would open the way for another test of 0.6854 and then a move towards 0.6809. The latter is an extended target and may require more than one trading session. Selling is planned at 0.6918, five points below the chart price, with a stop at 0.6944 and a target at 0.6854. Consolidation above the resistance area would invalidate the expectation of an imminent resumption of the decline. Until such confirmation emerges, the recovery does not alter the preference for cautiously seeking selling opportunities.
An additional important sign that the scenario is materialising would be the market's ability to remain below 0.6892 after a breakout. A rapid return above this level would indicate sellers' weakness and preserve the possibility of another test of the upper part of the corrective range before the next direction is chosen.
AUDUSD forecast scenario
USDCAD forecast
On 28 October, the Bank of Canada raised its policy rate by a quarter of a percentage point to 2.50%. This decision supports the Canadian dollar through the interest rate channel but does not eliminate the gap with US rates. For USDCAD, however, it is not only current instrument yields that matter, but also revisions to expectations for subsequent decisions by both regulators. Sustained dollar appreciation requires additional confirmation from US data.
Today's main shared catalyst will be the US inflation report. Higher readings could support yields and accelerate the pair's rise. Slowing price pressures would have the opposite effect. The oil market is a separate factor for the Canadian dollar. Lower oil prices usually worsen Canada's export conditions, while higher prices could support its currency. However, during a geopolitical escalation, rising commodity prices may be accompanied by demand for the US dollar. The relationship between oil and USDCAD therefore remains conditional, and the morning forecast should take account of the currency market's reaction to all the news rather than any single indicator.
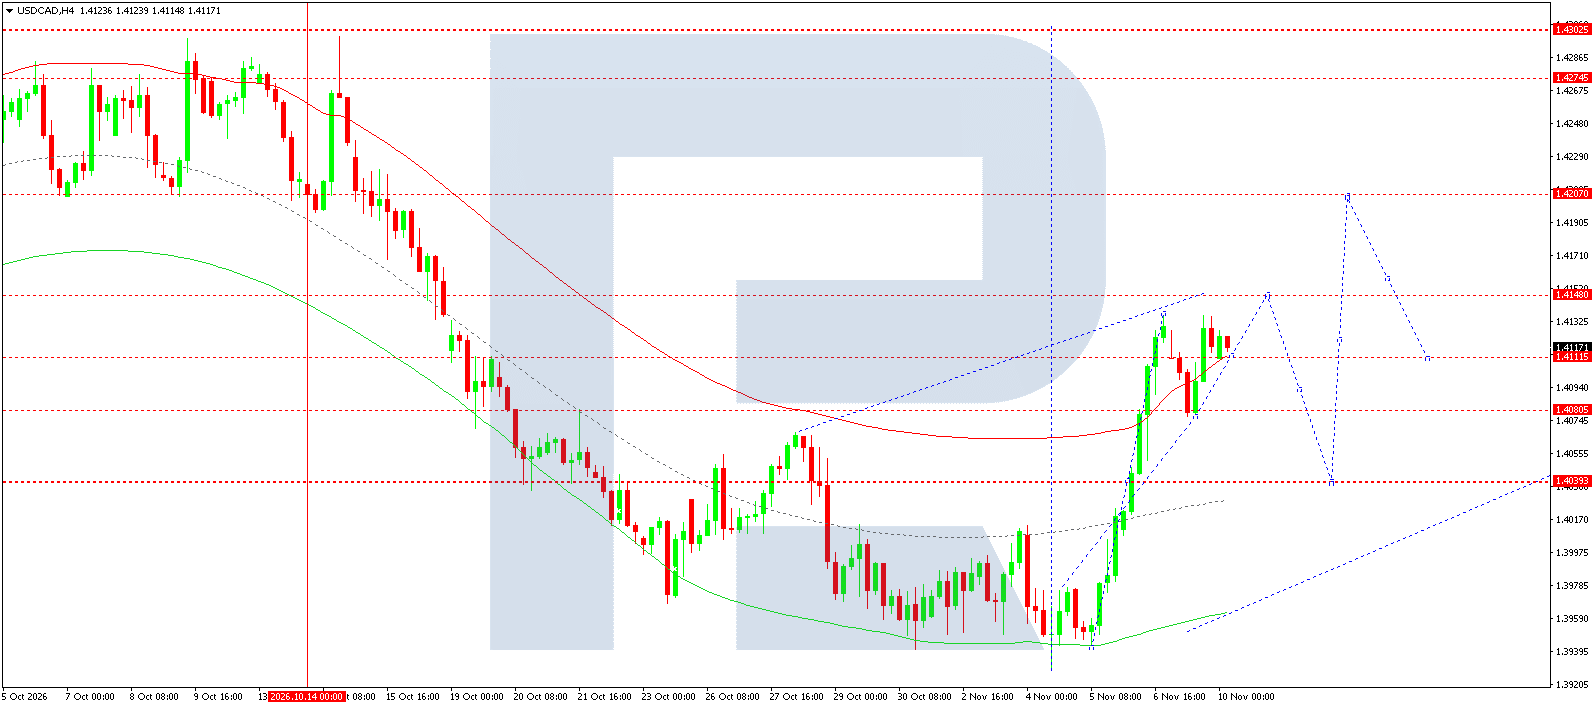
On H4, the latest price shown is 1.4117. After reversing from the 1.3940 area, the market formed a pronounced upward impulse and consolidated above 1.4081. The current consolidation is near 1.4111, below resistance at 1.4148. This structure allows for a continued recovery, although the likelihood of interim profit-taking is elevated after the rapid rise.
The main scenario envisages buying at 1.4122 and a move towards 1.4148. This is the nearest target, corresponding to the upper horizontal reference level of the local range. A breakout and sustained move above resistance would open the way towards 1.4207, although that stage requires separate confirmation. The stop is set at 1.4105: triggering it would end the selected short-term trade without necessarily invalidating the entire upward structure. A more significant deterioration would occur below 1.4081. In that case, the likelihood of a correction towards 1.4040 would increase before the market could form another upward wave.
The proximity of the target limits the potential of the first trade, so a breakout above 1.4148 should not be assumed in advance. To support further gains, it would be preferable to see the market hold the levels reached and avoid a rapid return into the previous range following the impulse.
USDCAD forecast scenario
XAUUSD forecast
For gold on the morning of 10 November, the main fundamental contradiction remains the combination of geopolitical uncertainty and relatively high interest rates. The Middle East conflict supports interest in safe-haven assets, but the associated energy costs increase inflation risks. If these risks lead investors to expect tighter Fed policy, rising yields could restrict demand for the metal, which earns no interest.
The US Consumer Price Index for October will be released today. Before the report, neither accelerating nor slowing inflation can be considered confirmed. Softer data could weaken the dollar and improve conditions for a XAUUSD recovery. Stronger figures, by contrast, could trigger selling as the expected path of interest rates shifts upwards. It is the reaction of real yields and the currency market that matters, as gold's initial impulse after a release often reverses. Developments in the conflict remain an independent source of fluctuations. The fundamental backdrop therefore allows for a continuing recovery but requires a cautious assessment of its sustainability near technical resistance.
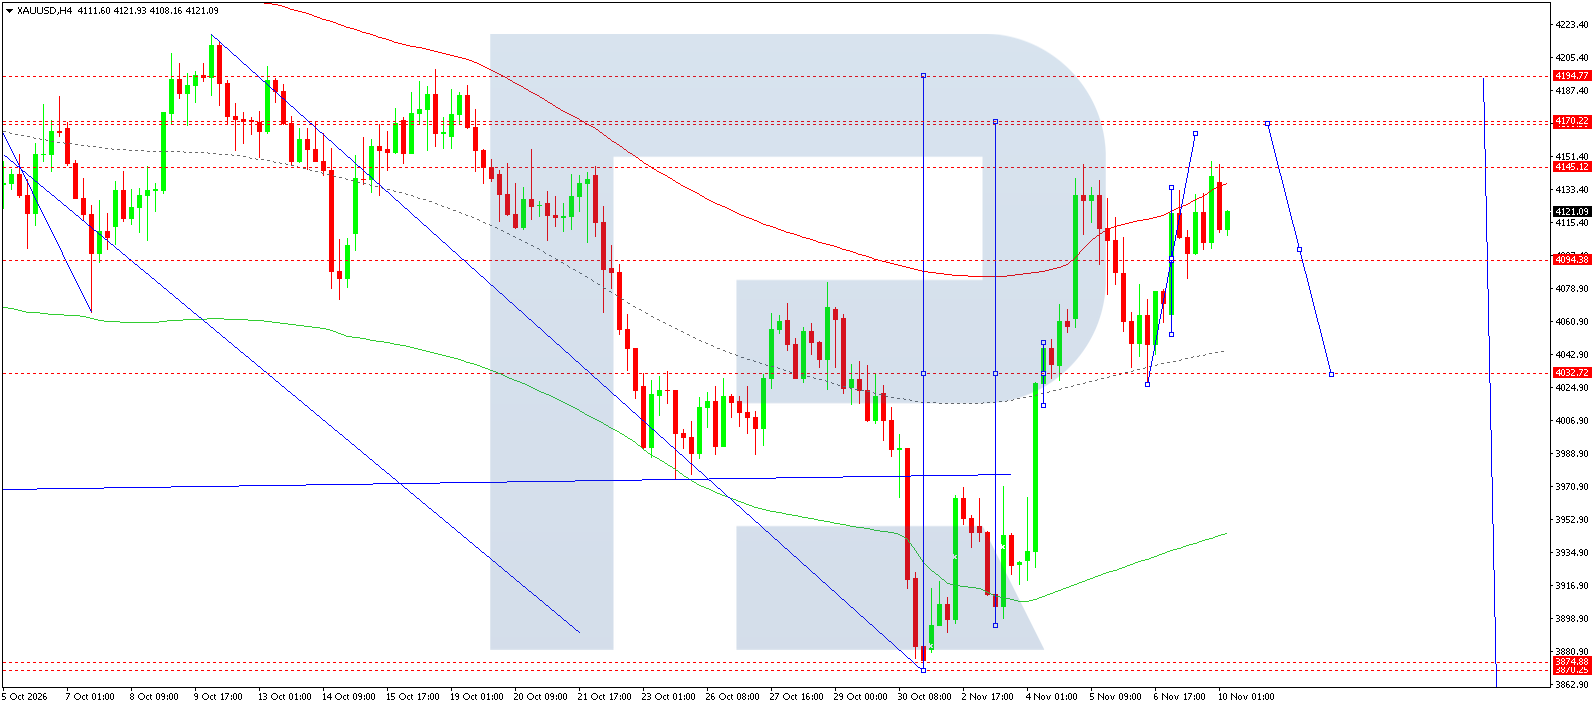
On the H4 chart, a recovery wave has formed after the decline to 3,875. The latest price shown rounds to 4,121. Local support is around 4,095, with resistance at 4,145, followed by 4,170 and 4,195. The low of the previous correction is near 4,033. The structure of recent fluctuations supports another move towards the upper reference levels of the range.
The main scenario envisages buying at 4,126, targeting 4,170. This requires holding the 4,095 area and overcoming 4,145. The stop is set at 4,104, so the trade's risk is limited before the entire recovery structure breaks down. After 4,170 is reached, profit-taking and a return to 4,095 are possible; a further decline towards 4,033 would require a breakout below that support. Consolidation above 4,170 would increase the likelihood of testing 4,195. The marked wave sequence remains a working interpretation of the chart, not proof of an inevitable move. The daily forecast focuses on the first upward phase of the scenario.
A return below 4,095 would give sellers the advantage and make another test of 4,033 more likely. Until then, fluctuations between support and resistance are consistent with the local recovery structure remaining intact on the four-hour chart shown.
XAUUSD forecast scenario
US 500 forecast
The morning fundamental backdrop for US equities is shaped by expectations for inflation data and the trajectory of interest rates. In its latest statement, the Fed noted resilient spending, strong investment, and persistent price pressures. This combination supports expectations for corporate revenues while limiting the grounds for anticipating an early easing of financial conditions. Equities are particularly sensitive to rising yields, which increase the discount rate applied to future cash flows.
The US Consumer Price Index for October will be released today. Higher inflation could put more pressure on company valuations, especially those highly sensitive to interest rates. Conversely, a softer report could support a continuation of the index's recovery. Energy costs and geopolitical developments also have an impact: cheaper fuel benefits some sectors, but the market's response depends on what is driving the price changes. The forthcoming data cannot be treated as known at the time of writing. The technical rebound should therefore be assessed alongside the breadth of equity demand and bond market movements before concluding that a sustainable uptrend has returned.
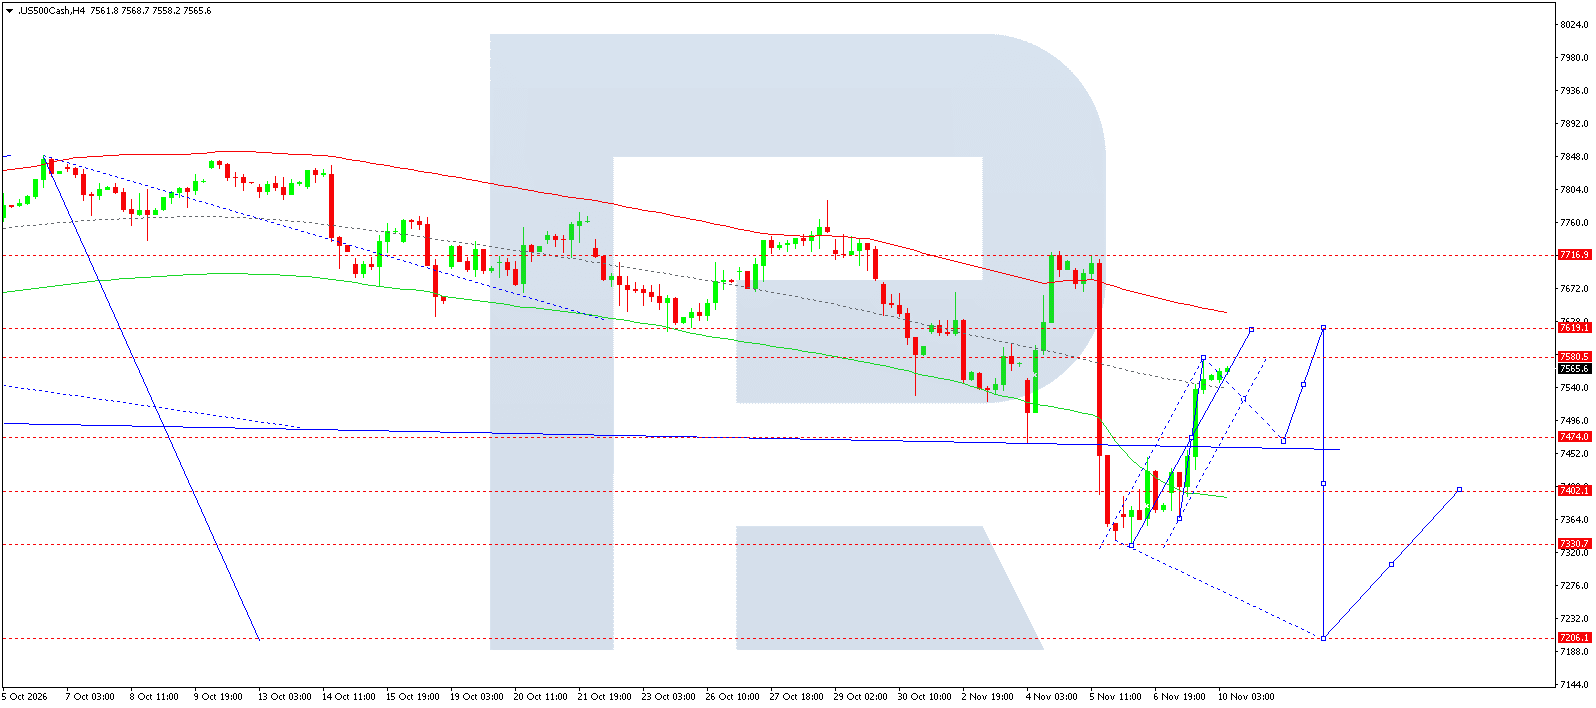
On H4, the US 500 instrument recovered from 7,331 to 7,566 but remains within a broader downward structure.
The main scenario envisages the rebound being capped and the decline resuming. The selected Sell entry is 7,561, with a stop at 7,629 and a target at 7,402. Interim support is at 7,474; a breakout below it would confirm strengthening selling pressure. After 7,402 is passed, another test of 7,331 is possible. The 7,206 level remains an extended target within the downward structure, but there is insufficient justification for expecting it to be reached today. Сonsolidation above 7,619 would weaken the selling scenario and require the correction to be reassessed. Until such confirmation, positive candles are viewed as a recovery after a sharp decline.
A sharp rise from oversold conditions may continue longer than expected, so resistance is treated as an area for testing the scenario. Sustained buyer strength above it would be more significant than an isolated intrabar spike, particularly in the first minutes after the US inflation data are released.
US 500 forecast scenario
BTCUSD forecast
Bitcoin begins the session under review sensitive to US dollar liquidity and expectations for US interest rates. Following the Fed's decision to keep rates unchanged, the market continues to assess the risk of further tightening if inflation remains persistent. For digital assets, higher yields on traditional instruments may reduce the relative appeal of investment, particularly when investors are cutting positions in highly volatile assets. However, this relationship is not constant and needs confirmation from the current market reaction.
The day's main macroeconomic event will be the US inflation release. A softer reading could improve risk appetite and support a BTCUSD recovery. A result above expectations, by contrast, would create conditions for dollar strength and renewed selling. Geopolitical uncertainty also affects capital allocation, but Bitcoin should not automatically be considered a safe-haven asset during every episode of tension. This review contains no confirmed data on today's exchange-traded fund flows, so their direction is not used as an argument. The morning forecast is based on the verified macroeconomic calendar and the observable structure of the supplied chart.
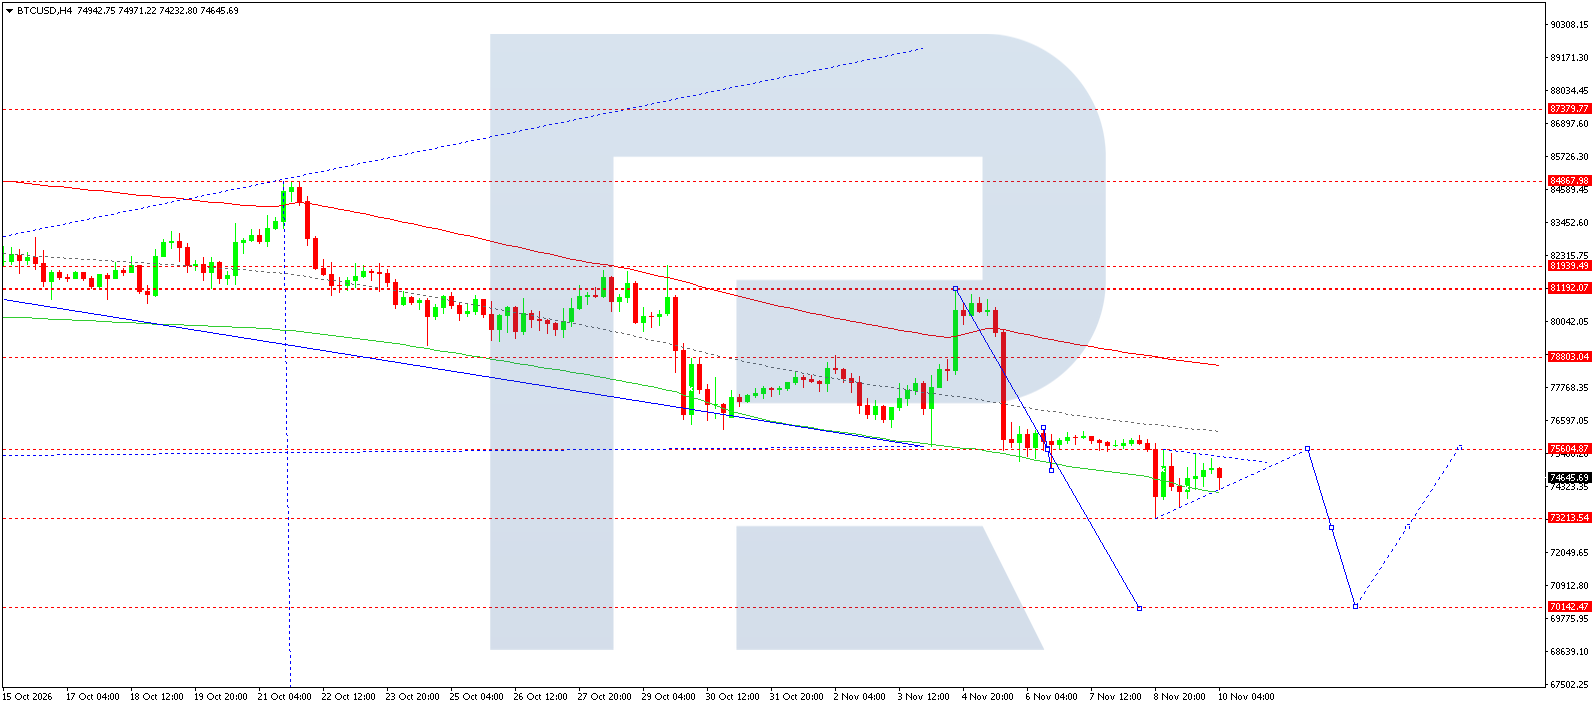
H4 retains a downtrend with lower highs. Following a test of support at 73,214, the price is consolidating near 74,646. The nearest resistance is at 75,604, while the next significant supply area is around 78,803. The modest recovery within the local range does not yet invalidate the previous downward impulse and allows for another corrective peak to form.
The main scenario envisages selling at 74,641, with a stop at 75,720 and a target at 72,124. Sellers must first break below 73,214; without this confirmation, a return to 75,604 remains possible. The trade target lies ahead of the extended 70,142 reference level, which would require stronger selling pressure to be reached within a single day. Following a test of the lower area, the wave count allows for a recovery towards 75,604, but this is a separate subsequent phase. H4 consolidation above the nearest resistance level at 75,600 would weaken the bearish scenario. When calculating the trade, the five-dollar gap between the current price and the entry is regarded as a conditional offset sensitive to the spread and actual execution.
Another failed attempt to rise near 75,604 would confirm continued supply, while higher local lows without a fresh break below the range would indicate sellers gradually losing strength ahead of the next impulse.
BTCUSD forecast scenario
Editors’ picks


EURUSD forecast 2026–2027: technical analysis, price levels & predictions
The EURUSD outlook for 2026 and 2027: key levels on the daily chart, three trading scenarios and the policy gap between the Fed and the ECB that drives the pair.

Gold (XAUUSD) forecast 2026: technical analysis, price levels & predictions
Where gold could trade in 2026: key levels, three trading scenarios with entry triggers and the forecasts from J.P. Morgan, Deutsche Bank and Goldman Sachs.
Forecasts presented in this section only reflect the author’s private opinion and should not be considered as guidance for trading. RoboForex bears no responsibility for trading results based on trading recommendations described in these analytical reviews.