
Daily technical analysis and forecast for 11 November 2026
Daily technical analysis and forecast for EURUSD, USDJPY, GBPUSD, AUDUSD, USDCAD, XAUUSD, US 500, and BTCUSD for 11 November 2026.
Each scenario on this page reflects the market structure on the H4 chart as of 10:00 AM UTC+3 on 11 November 2026. The assessment considers the current H4 chart structure, key support and resistance levels, the direction of the medium-term movement, and the prevailing fundamental backdrop.
EURUSD forecast
The fundamental backdrop for the euro remains subdued following the release of US inflation data. US consumer prices rose by 0.4% in October, while the core measure increased by 0.3%. The figures exceeded expectations, heightening concerns about persistent price pressures. The market is revising its outlook for Federal Reserve (Fed) policy towards further rate increases. For EURUSD, this supports the dollar side of the pair through expectations of higher yields on US assets.
The European Central Bank (ECB) kept rates unchanged at its 29 October meeting. The regulator noted that the energy shock both raises inflation risks and weakens the growth outlook. This combination limits the scope for unequivocal policy tightening and makes the euro sensitive to changes in energy prices. The dollar retains the advantage in the current assessment as long as US inflation risks outweigh expectations of an improvement in European economic conditions. Dollar weakness or an easing of tensions over energy supplies could support a correction, but neither would in itself confirm a reversal in the pair.
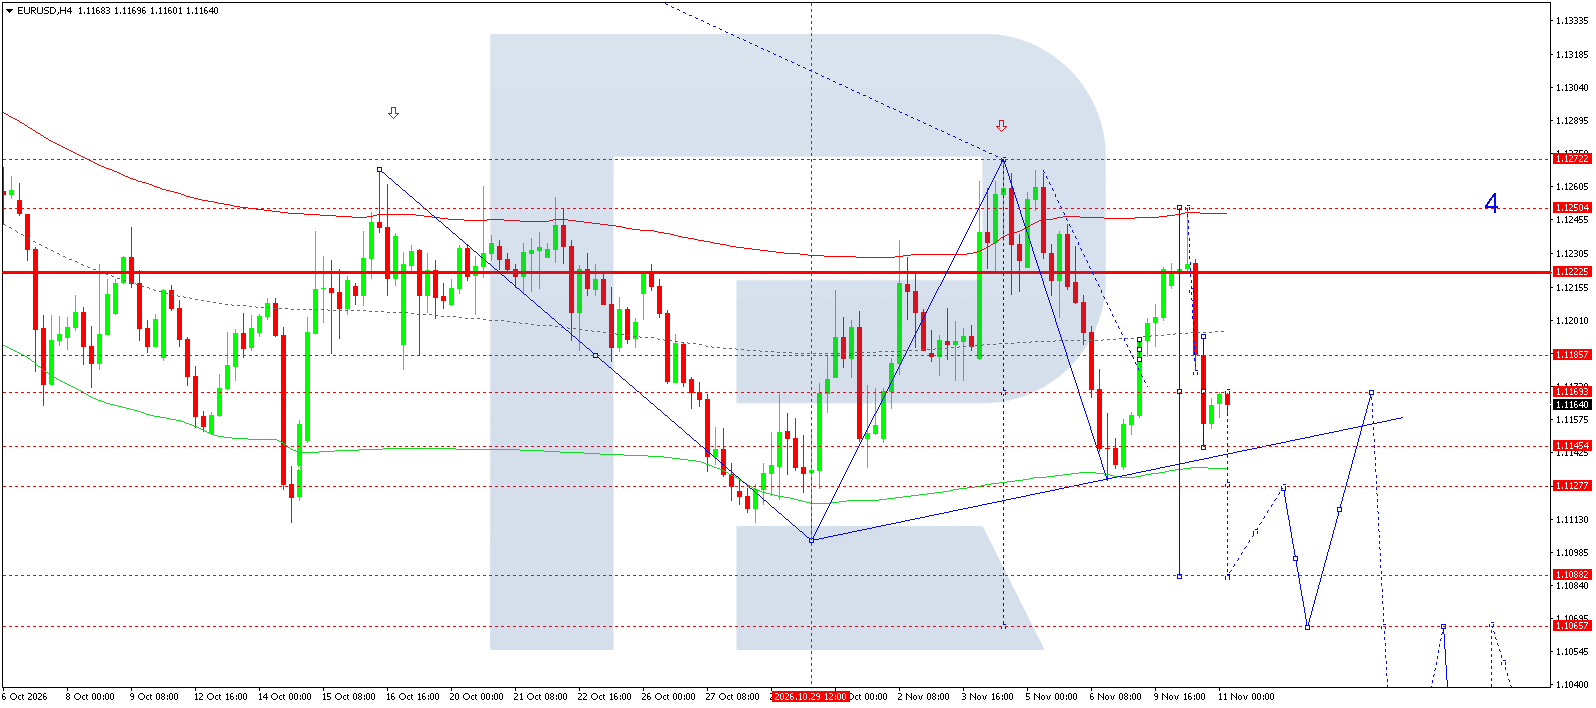
On the H4 chart, the price is around 1.1164. A sharp decline followed a rise towards resistance at 1.1222, while the recovery is capped by the 1.1169 area. This structure points to sellers' dominance in the short-term movement. However, the ascending support line below the current price remains intact, so an immediate downside breakout cannot yet be considered confirmed.
The main scenario for 11 November envisages the end of the local recovery and another test of 1.1145. Consolidation below this level would open the way towards 1.1128. A subsequent break through the 1.1122 area would increase the likelihood of a decline towards 1.1088. The deeper 1.1000 target relates to a continuation beyond the initial daily impulse. A return above 1.1186 would weaken the selling scenario and increase the probability of a test of 1.1222. Consolidation above the latter resistance would require a reassessment of the bearish outlook.
The wave count and Price Envelope lines serve as guides to a possible price path, rather than independent confirmation of future prices. Selling is considered on a move below the current quote, with a protective level above the nearest resistance area. Until the support breakout is confirmed, the possibility of a false break should be taken into account: a return into the range after a decline would indicate that opposing demand remains and that the nearest downside targets may take longer to materialise.
EURUSD forecast scenario
USDJPY forecast
The fundamental environment favours the dollar following a strong US inflation report. Persistently rising consumer prices have strengthened expectations of further Fed tightening. For USDJPY, the yield differential remains the key transmission channel: an upward revision in the expected US interest rate path makes dollar-denominated instruments more attractive relative to Japanese assets. Nevertheless, the pair's response depends on how much of these expectations market participants have already priced in.
In its published summary of the October meeting, the Bank of Japan highlighted an ongoing debate about further policy normalisation. Some members favour continued rate increases, while others prefer to assess the cumulative effects of earlier decisions. The fundamental backdrop therefore cannot be regarded as one-sided. More decisive signals from the BoJ could strengthen the yen even against a firm dollar.
Demand for safe-haven assets remains another source of volatility: a deterioration in global risk appetite could prompt investors to unwind yen-funded positions. The baseline assessment favours buyers of the pair, but the possibility of sharp corrections near upper resistance levels must be taken into account.
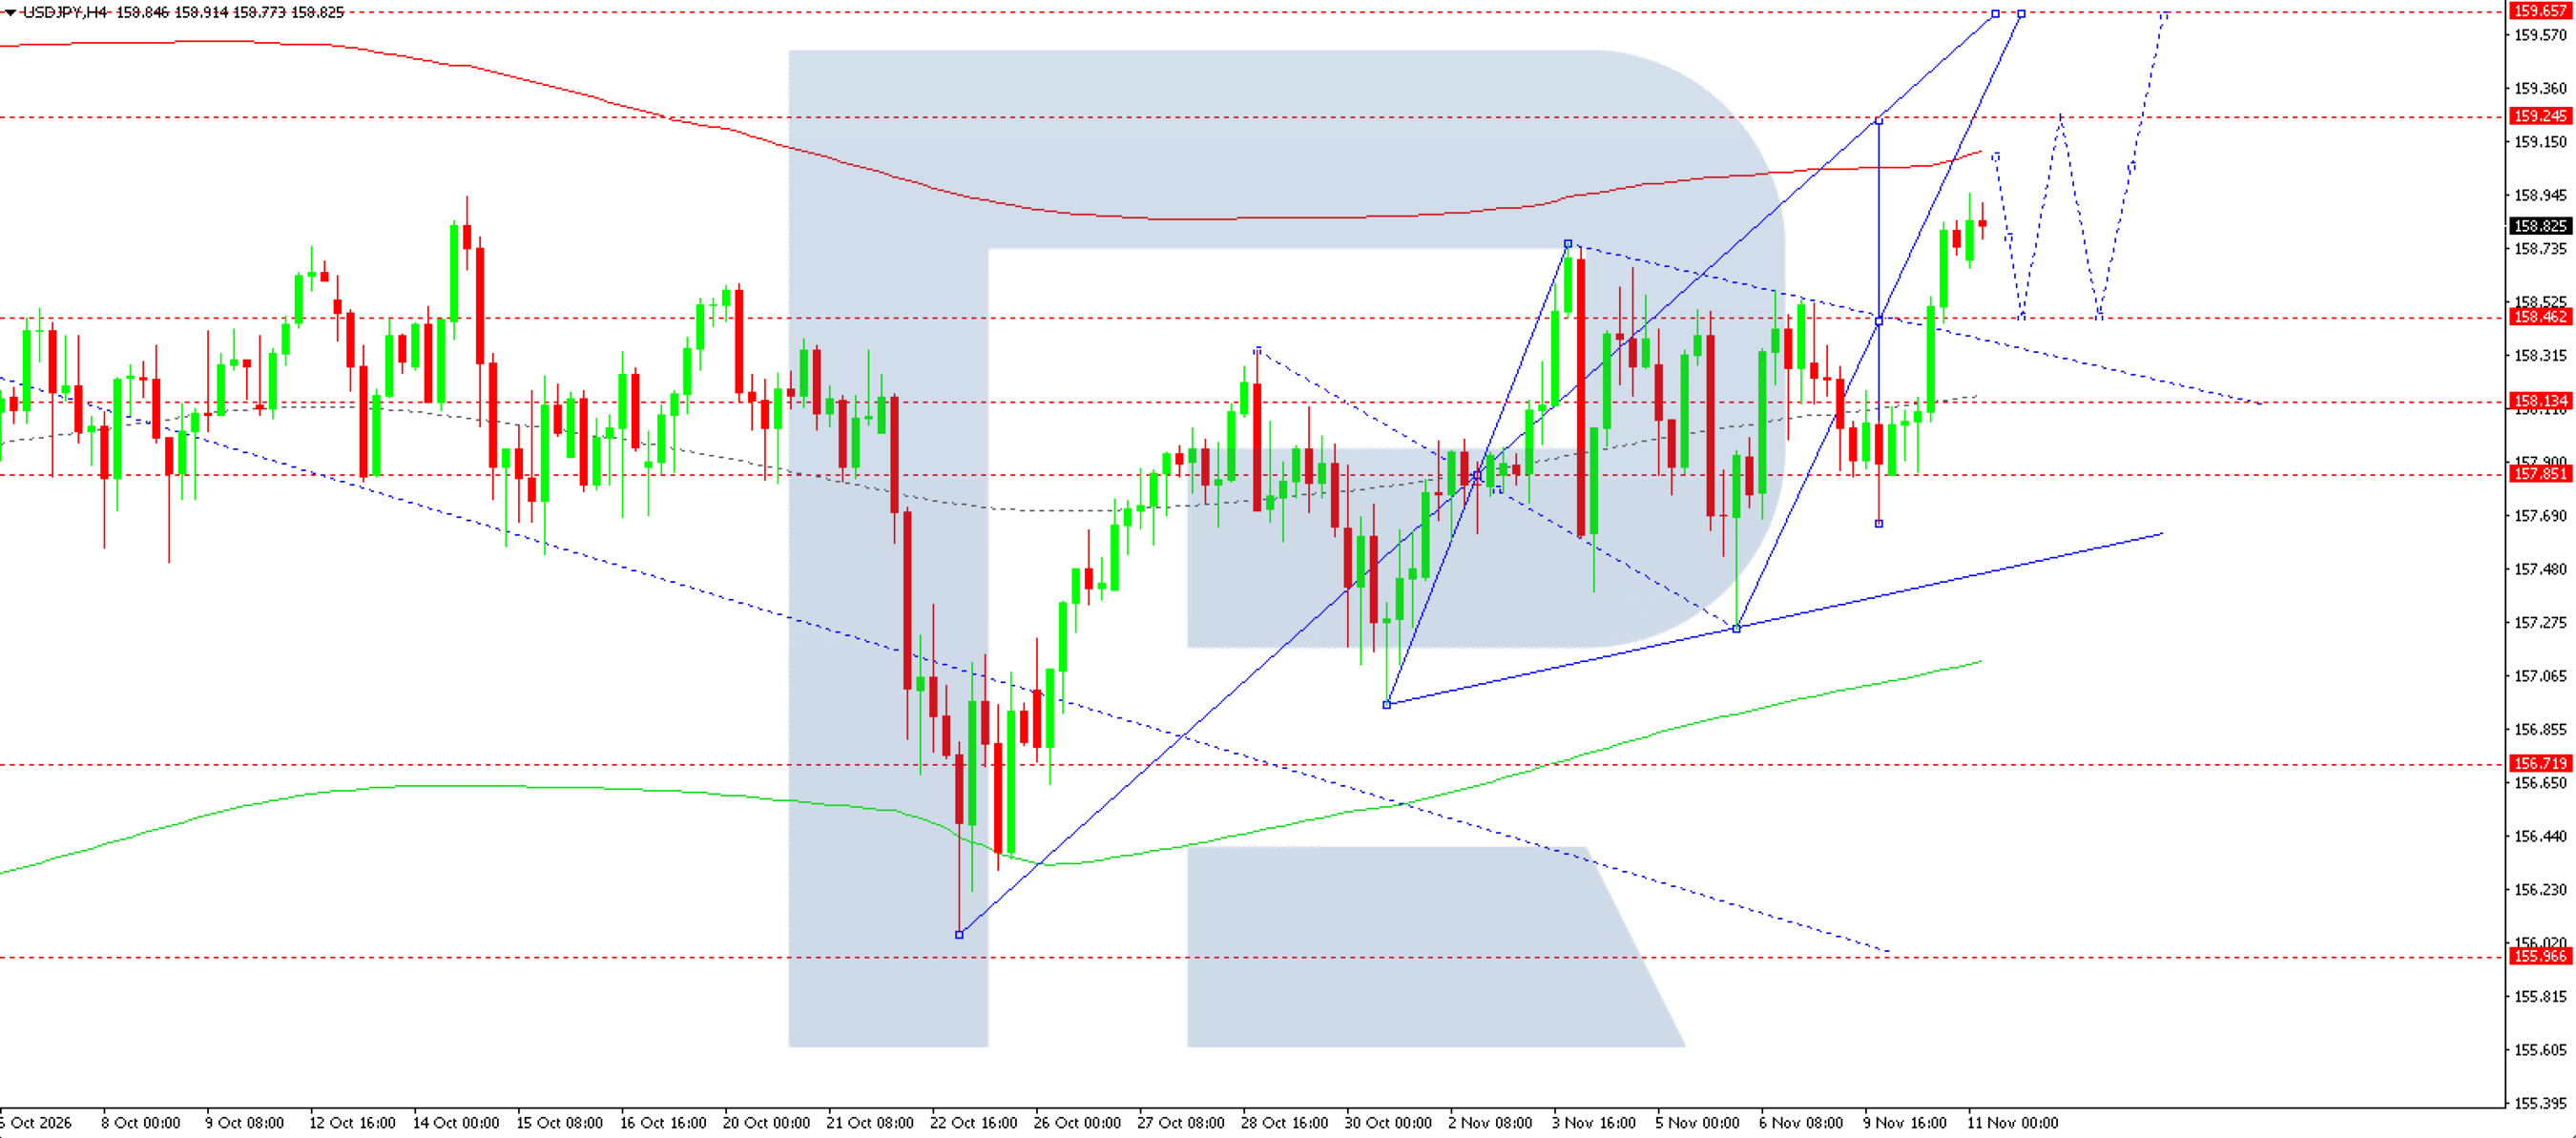
On H4, the current price is approximately 158.83. The market has moved above the 158.46 area, breaking through the local descending boundary of consolidation. The recovery from October's low has been accompanied by higher swing lows, supporting the bullish scenario. The nearest obstacle is the 158.95 area, with resistance at 159.25 above it.
For 11 November, continued growth remains the preferred scenario, provided that the price holds above the previously breached 158.46 area. A move through 158.95 would enable a rise towards 159.25. A pullback is possible after this level is reached, so 159.66 should be treated as the next stage of the advance if demand persists.
A return below 158.46 would weaken momentum and raise the possibility of a test of the 158.13 level. Deeper support lies around 157.85. Consistent holding of the nearest support levels, rather than the shape of the projected line, will confirm the working scenario.
A Buy entry is planned slightly above the current price, with the protective order placed below the breakout area. Reaching the more distant target within one session is not a prerequisite for the broader upward direction to remain intact on the chart under review.
If the breakout above the upper boundary proves false and the price quickly returns to the previous range, the likelihood of renewed consolidation will rise, while the grounds for expecting an immediate move towards the distant target will diminish considerably.
USDJPY forecast scenario
GBPUSD forecast
Sterling is being influenced by a reassessment of US interest rate expectations. October inflation in the US exceeded market forecasts, while subsequent hawkish comments from Fed officials strengthened demand for the dollar. For GBPUSD, this creates pressure through the external interest rate environment: even a relatively high UK rate cannot ensure sterling's appreciation if expectations of US tightening change more rapidly.
The Bank of England raised its rate to 4% on 5 November. This decision supports yields on British assets and limits the grounds for an unequivocally negative assessment of sterling. However, higher borrowing costs also increase the burden on households and businesses. The balance between containing inflation and sustaining economic activity is important for the currency market. In the current assessment, the dollar's advantage is accompanied by the risk of a corrective recovery in sterling following the sharp decline. Energy and geopolitical risks also remain relevant: more expensive imports could complicate the UK's inflation outlook, while an improvement in global sentiment could temporarily support demand for the pound.
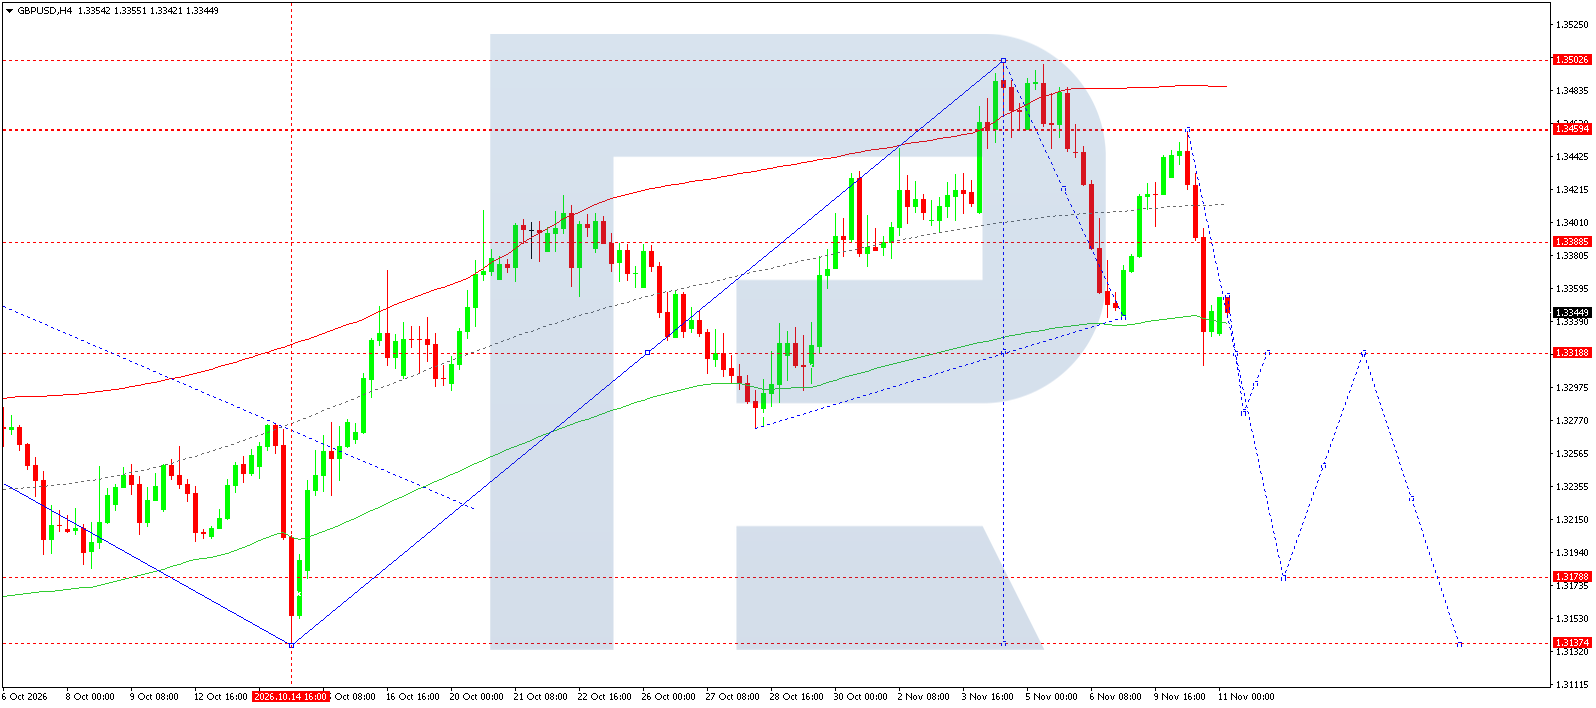
On the four-hour chart, the price is hoverign around 1.3345. After failing to recover towards 1.3459, the pair fell back below 1.3389 and approached the lower line of the displayed Price Envelope. The local structure is characterised by lower highs. At the same time, the 1.3318 support level is still preventing the market from extending its downward momentum.
The main scenario for 11 November envisages renewed pressure on 1.3318 once the current consolidation ends. If the price consolidates below the support level, the nearest reference area will be 1.3285. A possible recovery towards 1.3318 after the breakout would be regarded as a resistance test.
The next targets are at 1.3180 and 1.3137. They represent an extension of the downward wave and may require several sessions. A return above 1.3389 would weaken the bearish structure and raise the probability of a retest of the 1.3459 level.
The Sell position is therefore accompanied by a protective level above the nearest significant resistance. The indicated wave count allows for interim rebounds; the scenario's validity depends on price behaviour at horizontal levels, not on an exact reproduction of the projected path.
Another rebound from 1.3318 without a new local low would delay the development of the main wave. In this case, the next trading session could remain range-bound between support and the previously broken resistance area.
GBPUSD forecast scenario
AUDUSD forecast
The Australian dollar is under pressure from the strengthening US currency following US inflation data. Market participants have increased their expectations of a Fed rate rise, supporting the dollar and making it harder for risk-sensitive currencies to recover. This factor is particularly significant for the AUDUSD pair, as changes in global financial conditions affect the appeal of commodity assets and investors' willingness to maintain risky positions.
The Reserve Bank of Australia raised its rate by 25 basis points to 4.85% on 3 November. This decision provides interest rate support for the Australian currency, so its decline cannot be attributed solely to an accommodative domestic monetary policy. In the current assessment, the market is reacting more strongly to the US inflation surprise and the prospect of further tightening in external financial conditions. Demand for industrial commodities and expectations concerning China's economy also matter. However, without confirmed recent data on Chinese activity, these should be viewed as channels of sensitivity rather than independent explanations for today's movement. An improvement in sentiment across global markets could trigger corrective demand for the Australian dollar.
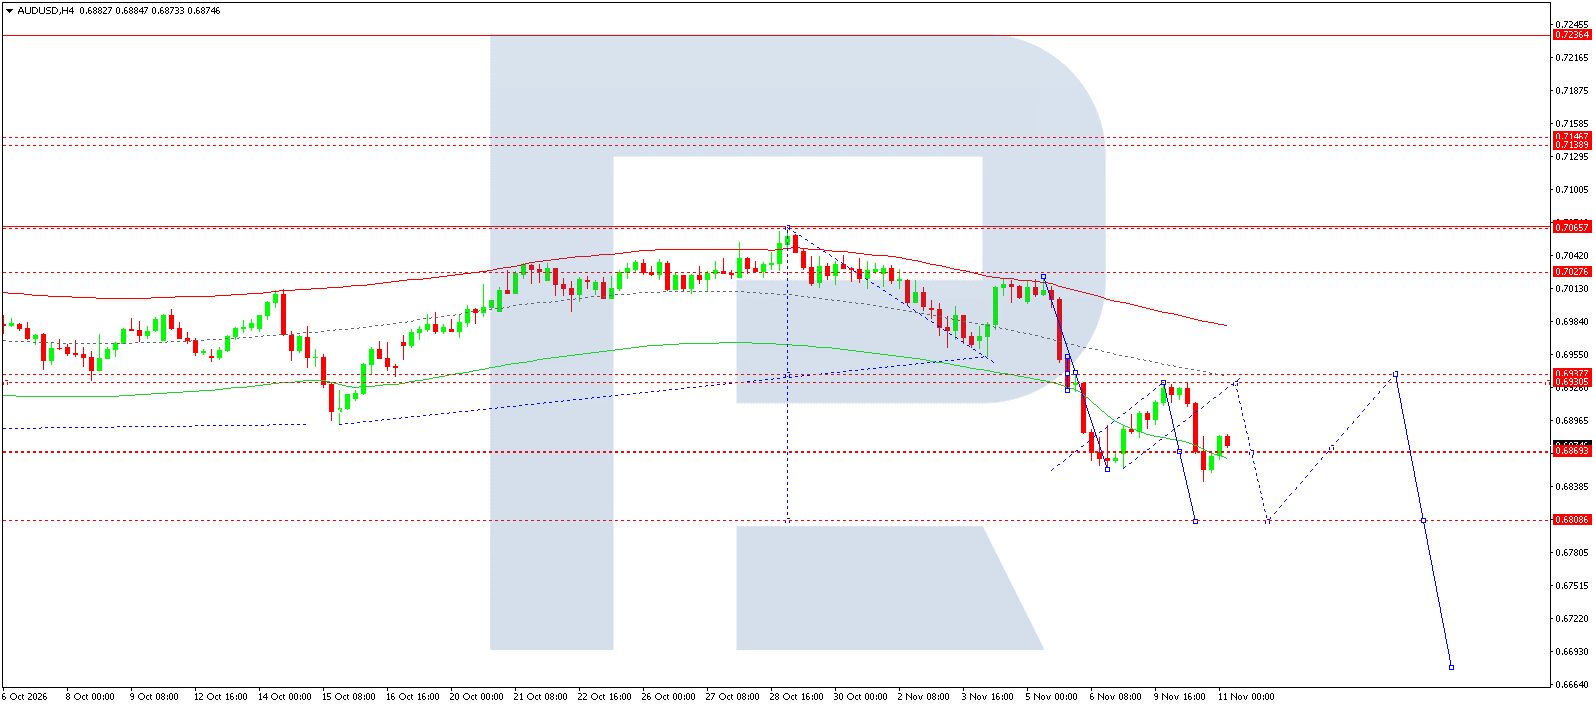
On the H4 chart, the price is around 0.6875. After breaking below the 0.6937 area, the pair formed lower highs and lower lows. The recovery from the recent base has not taken prices back above former support, while the upper Price Envelope line continues to slope downwards. This keeps selling as the preferred strategy, although local consolidation could lead to further price fluctuations.
The baseline scenario for 11 November envisages renewed pressure on 0.6869. Sustained consolidation below this level would increase the probability of testing 0.6844 and subsequently moving towards 0.6808. The latter is the main target of the trade under consideration.
A move back above 0.6900 would weaken the near-term downward momentum, while a recovery above the 0.6931–0.6937 zone would pose a more significant challenge to further declines. The lower projected lines in the image indicate a possible extension of the wave but do not provide sufficient grounds for treating a distant target as an obligatory daily objective.
Selling is being considered below the current price, with a protective stop-loss above the local recovery zone. If support at 0.6869 holds on a retest, the market could continue to move sideways. Renewed pressure would be confirmed by a combination of a new low and a failed attempt to reclaim the broken level after the next local recovery.
AUDUSD forecast scenario
USDCAD forecast
The fundamental backdrop is supporting the US dollar after unexpectedly persistent US inflation. Stronger expectations of further Fed rate increases are making dollar-denominated assets more attractive. For USDCAD, this provides upward momentum, although the pair's direction also depends on Canadian monetary policy and oil market dynamics. The dollar's broad strength therefore does not rule out short-term pullbacks.
The Bank of Canada raised its rate by 25 basis points to 2.50% on 28 October. The regulator warned of the risk that higher energy costs could spread to other goods and services. Uncertainty over trade relations with the US also persists and could constrain economic growth. This combination makes the Canadian dollar sensitive to changes in external demand. Oil ended the previous session lower after concerns about further supply disruptions from the Middle East eased. This acts as a restraint on the Canadian currency through the commodity channel. In the current assessment, the combination of a strong dollar and weaker support from oil favours buyers of the pair, while a recovery in oil prices could slow the advance.
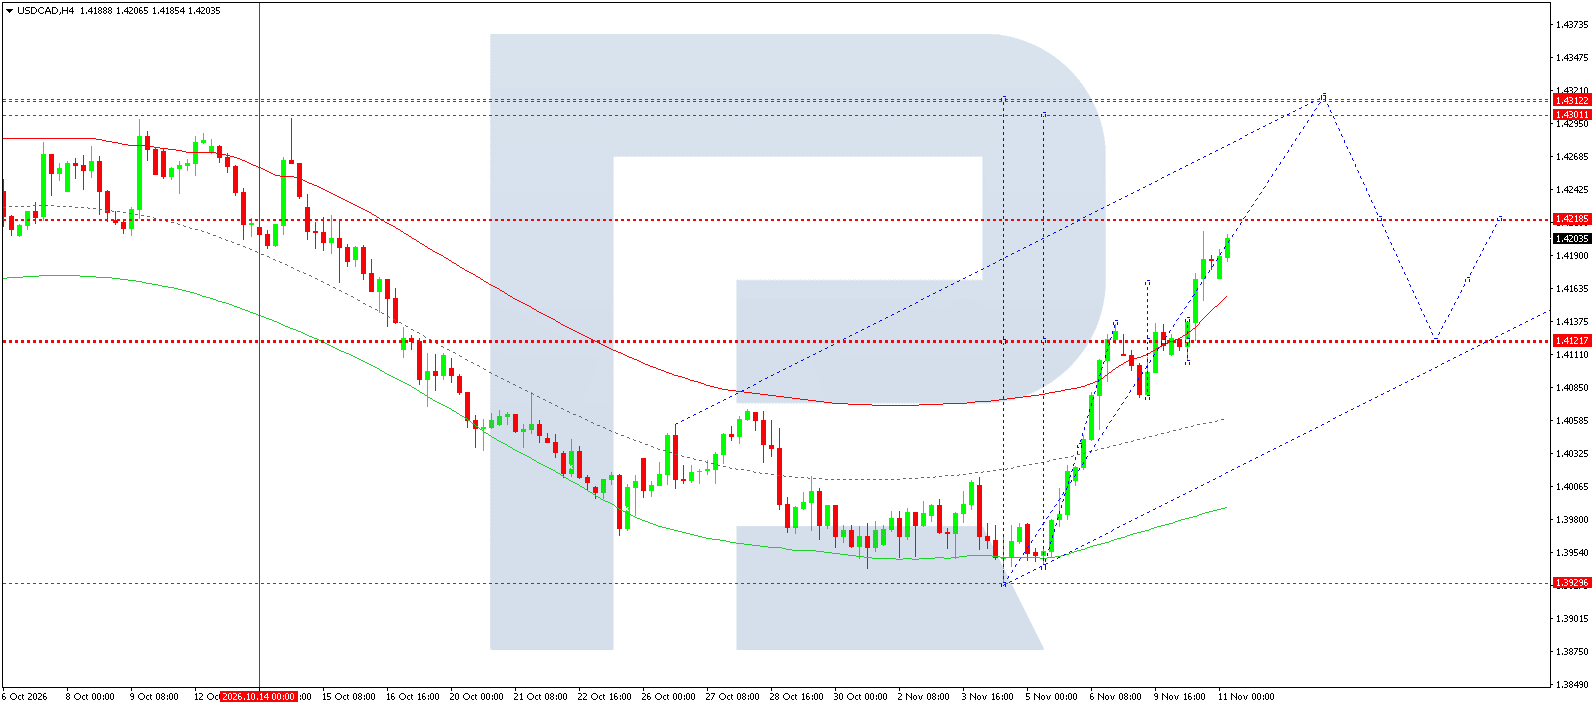
On the H4 chart, the price is hovering around 1.4204. The recovery from the 1.3930 area was accompanied by a sequence of higher lows and a move above 1.4122. The price has now approached resistance at 1.4218, increasing the likelihood of consolidation immediately ahead of a test. The next move should be assessed by the quality of the breakout, rather than merely by the direction of the latest candles.
For 11 November, the main scenario envisages testing 1.4218 and attempting to consolidate above 1.4220. A successful break through this zone would open the way towards 1.4301 and then 1.4312. If the breakout fails, a pullback towards intermediate support levels and subsequently 1.4122 is possible.
A return below the latter level would significantly weaken the bullish structure. A Buy entry is planned above the current price, with a protective order below the nearest impulse area. The selected stop limits the risk of this particular trade and could be triggered before the broader bullish scenario is invalidated.
Subsequent decisions depend on holding the broken levels and preserving the sequence of higher lows. Given the proximity of resistance, an upward acceleration without consolidation could prove to be a false breakout. A retest of the breakout zone from above would help assess the sustainability of demand and the likelihood of reaching the next price target within the current wave.
USDCAD forecast scenario
XAUUSD forecast
Gold is recovering after coming under pressure from the US inflation report. Persistent growth in consumer prices strengthened expectations of a Fed rate increase, while rising yields and a stronger dollar worsened conditions for the non-interest-bearing metal. High inflation therefore does not automatically imply a rise in XAUUSD in the current environment: the short-term reaction is primarily determined by the anticipated monetary policy response.
The geopolitical premium remains an additional factor. Easing concerns about further military escalation in the Middle East could reduce safe-haven demand, while new supply disruptions and increased tensions could revive it. Gold fell markedly in the previous session following the inflation release, so the current rebound should be treated cautiously. In the present assessment, buyers have an opportunity to extend the technical recovery, but fundamental confirmation would require a stabilisation of the dollar backdrop.
It is also important to distinguish movements in nominal yields from those in real interest rates: without up-to-date information on inflation expectations, it cannot be assumed that both indicators are moving in the same direction. This leaves uncertainty over the sustainability of the near-term advance.
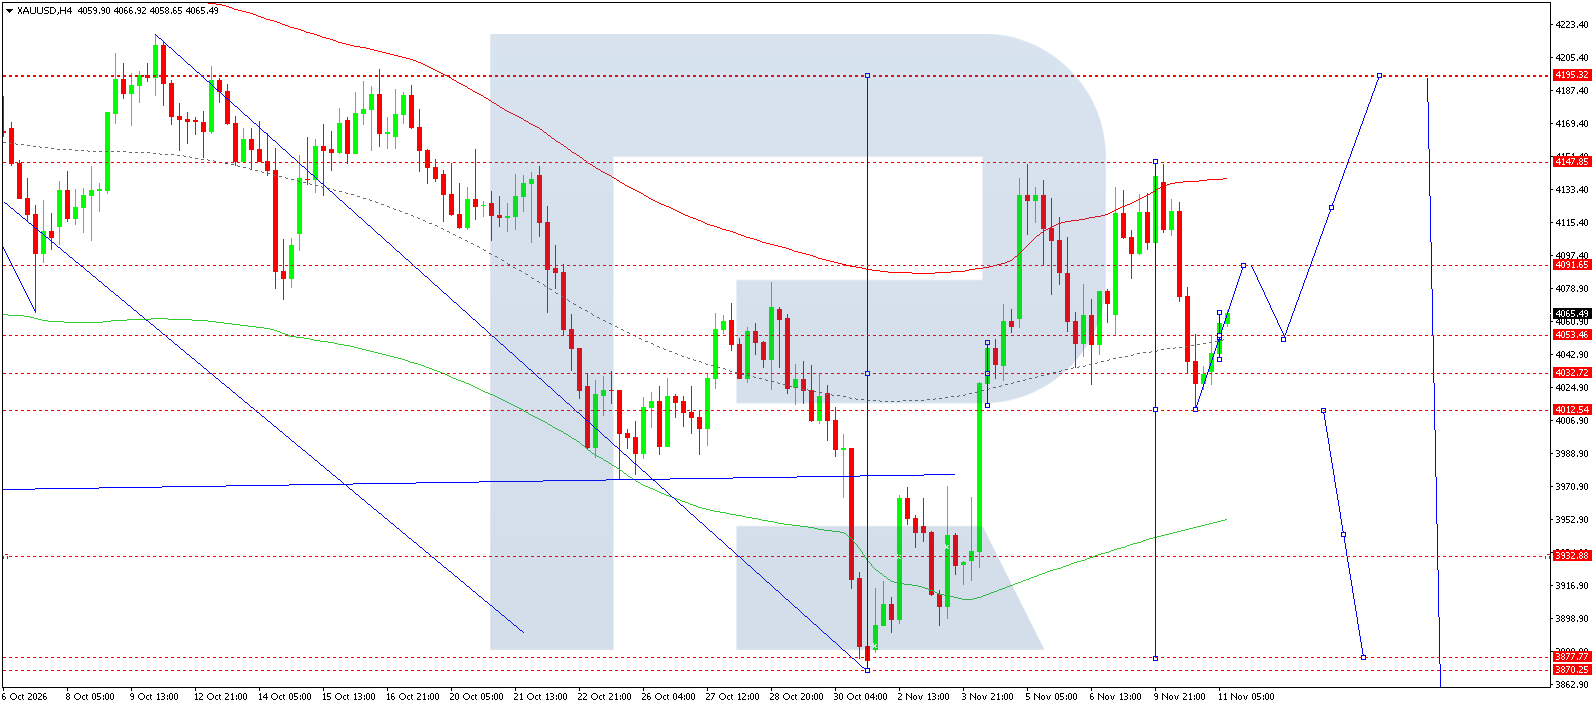
On the four-hour chart, the price is around 4,065. After falling towards 4,013, the market recovered above 4,033 and 4,053. The immediate structure therefore allows the rebound to continue, although the previous high around 4,148 remains unbroken. The nearest resistance lies around 4,092.
The main scenario for 11 November envisages a rise towards 4,092 provided the 4,053 area holds. A pullback towards 4,050 is possible after resistance is tested. Renewed consolidation above 4,092 would increase the probability of a move towards 4,148 and subsequently 4,195. The latter is an extended target and does not have to be reached within the day.
A return below 4,033 would weaken the case for buying, while a break below 4,013 would open an alternative path towards 3,933 and 3,878. The selected Buy trade has a stop below 4,033, so its risk is limited before a deeper bearish scenario is confirmed.
The wave pattern is treated as a conditional sequence of tests of significant levels. A continuation of the advance requires actual demand above the nearest resistance levels. A rebound from support without overcoming 4,092 would preserve the range-bound character of trading.
In that case, expectations of quickly reaching the upper target should be moderated until a sequence of new highs and higher lows emerges.
XAUUSD forecast scenario
US 500 forecast
The US stock market remains sensitive to revisions in interest rate expectations following the inflation data. Consumer price growth exceeded forecasts, heightening concerns about further Fed tightening. Higher expected rates increase the discount rate applied to future corporate earnings and could weigh on equity valuations. This sensitivity is especially pronounced in segments where a substantial part of the valuation depends on distant future cash flows.
The index ended the previous session lower, while rising bond yields worsened the overall backdrop for risk assets. At the same time, a recovery in Asian markets indicates that demand for selected technology segments persists. The fundamental picture therefore allows for technical rebounds within a weaker market.
Lower oil prices could support companies by reducing costs, although this effect may be outweighed by changing interest rate expectations. In the current assessment, sellers retain the advantage until financial conditions improve sustainably. Corporate earnings reports and revisions to profit forecasts remain additional factors, but without specific confirmed announcements they cannot be used to explain the direction of the current session.
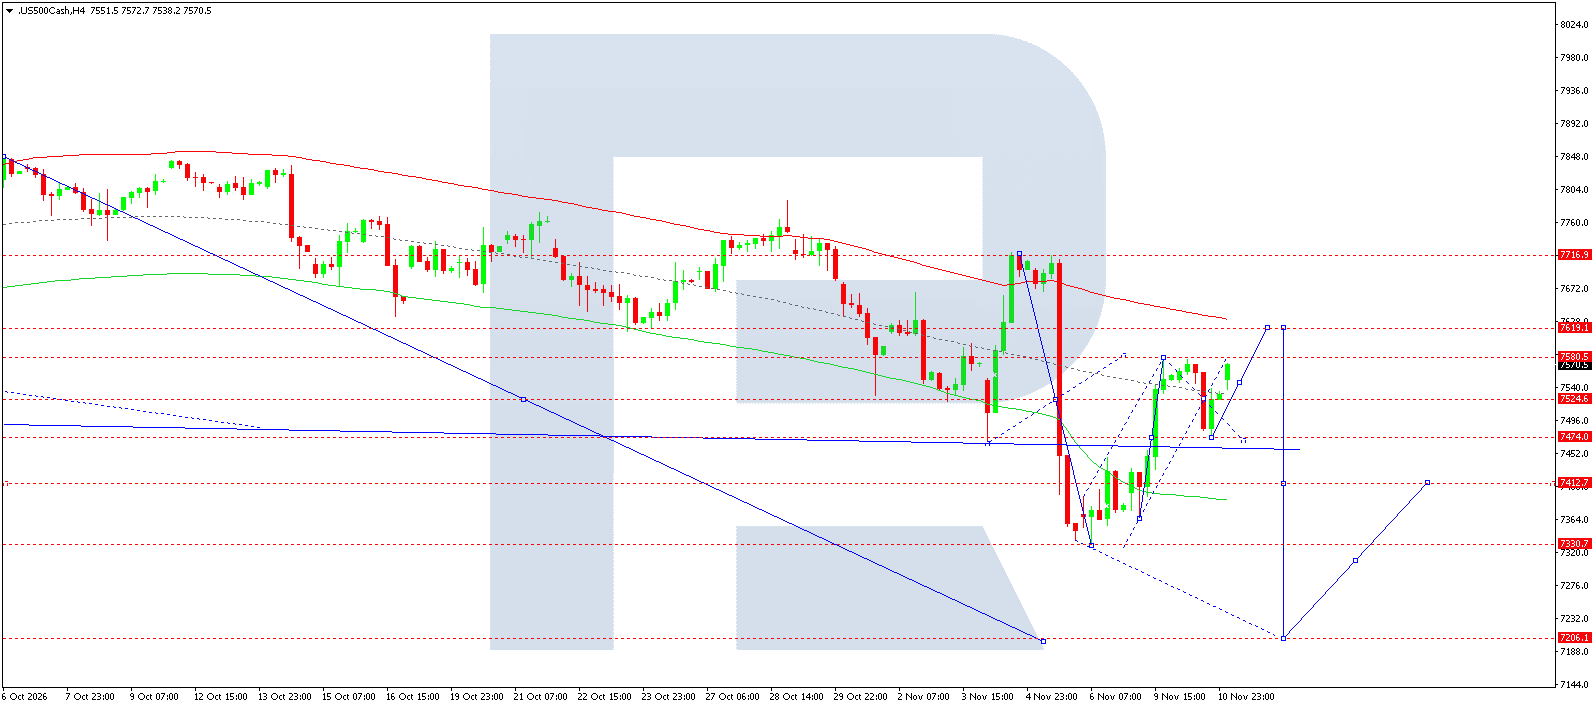
On the H4 chart, the US 500 is trading around 7,571. The recovery from the 7,331 area brought the market towards resistance at 7,581. However, the upper line of the displayed Price Envelope continues to slope downwards, so the advance is still regarded as a correction of the previous decline. The next significant obstacle lies around 7,619.
For 11 November, the baseline scenario allows for a preliminary test of 7,581–7,619, followed by renewed selling. An additional condition for the selected entry is a decline towards 7,566 after the recovery impulse weakens.
The nearest downside reference levels are 7,525 and 7,474, followed by 7,413. The latter is selected as the trade target because it comes before the deeper support levels at 7,331 and 7,206.
A move towards the last of these levels belongs to an extended scenario and may require several sessions. Consolidation above 7,619 would weaken the bearish assessment, and the protective order is placed slightly above this area. The projected path on the chart outlines possible stages of the move but does not confirm that a sharp decline is inevitable.
If support at 7,474 holds during the next decline, this would favour consolidation. To develop a deeper downward wave, sellers would need to establish the price below this level and limit subsequent attempts by the market to recover above it.
US 500 forecast scenario
BTCUSD forecast
Bitcoin remains under pressure from deteriorating external financial conditions. US inflation has strengthened expectations of a Fed rate increase, supporting the dollar and making interest-bearing instruments more attractive. For cryptocurrencies, this creates an unfavourable backdrop through higher financing costs and reduced investor willingness to take risks. However, the relationship with traditional markets changes over time and does not guarantee the same response to every news event.
Current market reports indicate that Bitcoin is trading near its lowest levels in almost three months. This confirms weak demand in the current move but does not in itself prove capitulation by long-term holders. Without verified data on exchange-traded fund flows, liquidations, and exchange reserves, the decline cannot be attributed to any particular group of market participants. An improvement in the geopolitical situation could support overall risk appetite, although the effect may be limited by expectations of expensive dollar liquidity. In the current assessment, a cautious approach to recovery impulses remains preferable: sustained improvement would require a change in price structure and a return above nearby resistance levels.
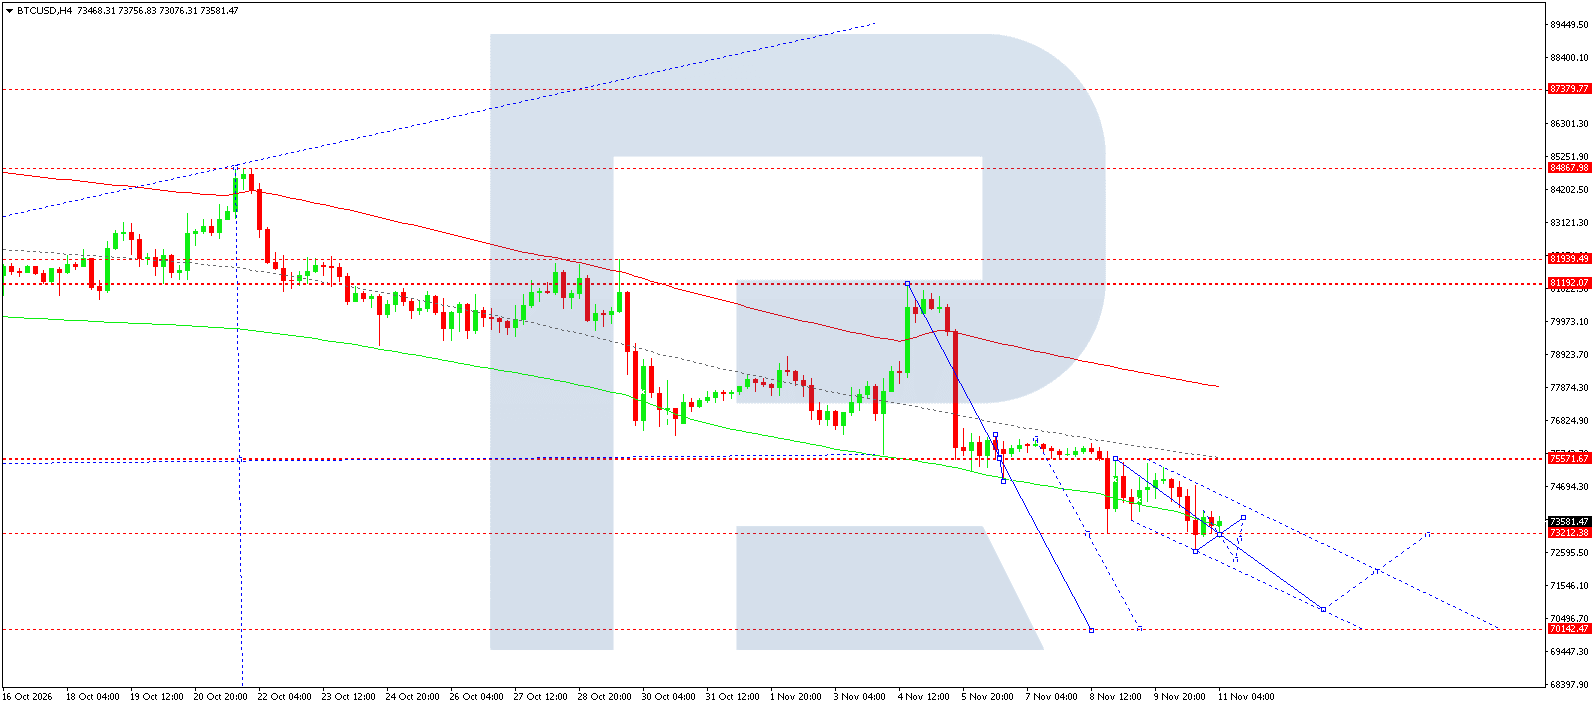
On the H4 chart, the price is currently hovering around 73,581. The sequence of lower highs and lower lows remains intact, and the price is below the upper and middle lines of the displayed Price Envelope. After testing the 72,644 area, the market formed a limited rebound. The nearest horizontal resistance lies around 75,572, while an intermediate obstacle is associated with local highs within the descending channel.
The main scenario for 11 November envisages the recovery ending and renewed pressure on 73,212. A sustained break below this level would increase the probability of testing 72,644. This would then open the way towards 70,142, an extended target within the current bearish structure. Reaching it may take more than one session.
A return above the nearest local highs would weaken the conditions for the specific Sell trade, while consolidation above 75,572 would require a reassessment of the overall bearish scenario. The protective order is placed within a broader resistance zone, so the trade's risk limit would be reached before the trend was fully invalidated.
The projected paths are interpreted as conditional possibilities for movement between significant levels. If buyers hold 73,212 and restore the price above local highs, the decline could give way to consolidation.
To maintain momentum, sellers need to limit rebounds and continue setting new lows within the descending channel.
BTCUSD forecast scenario
Editors’ picks


EURUSD forecast 2026–2027: technical analysis, price levels & predictions
The EURUSD outlook for 2026 and 2027: key levels on the daily chart, three trading scenarios and the policy gap between the Fed and the ECB that drives the pair.

Gold (XAUUSD) forecast 2026: technical analysis, price levels & predictions
Where gold could trade in 2026: key levels, three trading scenarios with entry triggers and the forecasts from J.P. Morgan, Deutsche Bank and Goldman Sachs.
Forecasts presented in this section only reflect the author’s private opinion and should not be considered as guidance for trading. RoboForex bears no responsibility for trading results based on trading recommendations described in these analytical reviews.