
Daily technical analysis and forecast for 12 November 2026
Daily technical analysis and forecast for EURUSD, USDJPY, GBPUSD, AUDUSD, USDCAD, XAUUSD, US 500, and BTCUSD for 12 November 2026.
Each scenario on this page reflects the market structure on the H4 chart as of 10:00 AM UTC+3 on 12 November 2026. The assessment considers the current H4 chart structure, key support and resistance levels, the direction of the medium-term movement, and the prevailing fundamental backdrop.
EURUSD forecast
At the start of trading on 12 November, the main external factor for the euro remains the reassessment of US interest rate expectations following October's inflation figures. The published data heightened concerns about persistent price pressures, while rising US Treasury yields increased the appeal of dollar-denominated assets. For EURUSD, this creates an unfavourable combination: more expensive dollar funding is accompanied by a reduced willingness among investors to increase their exposure to risk assets.
The US Federal Reserve faces the need to prevent inflation from spreading beyond the energy sector. The European Central Bank is also taking price risks into account, but tighter European policy does not in itself guarantee a stronger euro if US yields rise more quickly. Further uncertainty stems from the conflict in the Middle East and energy prices. For the eurozone economy, a prolonged energy shock could simultaneously weaken the growth outlook and sustain inflation. Continued demand for the dollar remains the baseline scenario for the upcoming session. A weakening of this demand would require either a decline in yields or a notable recovery in global risk appetite.
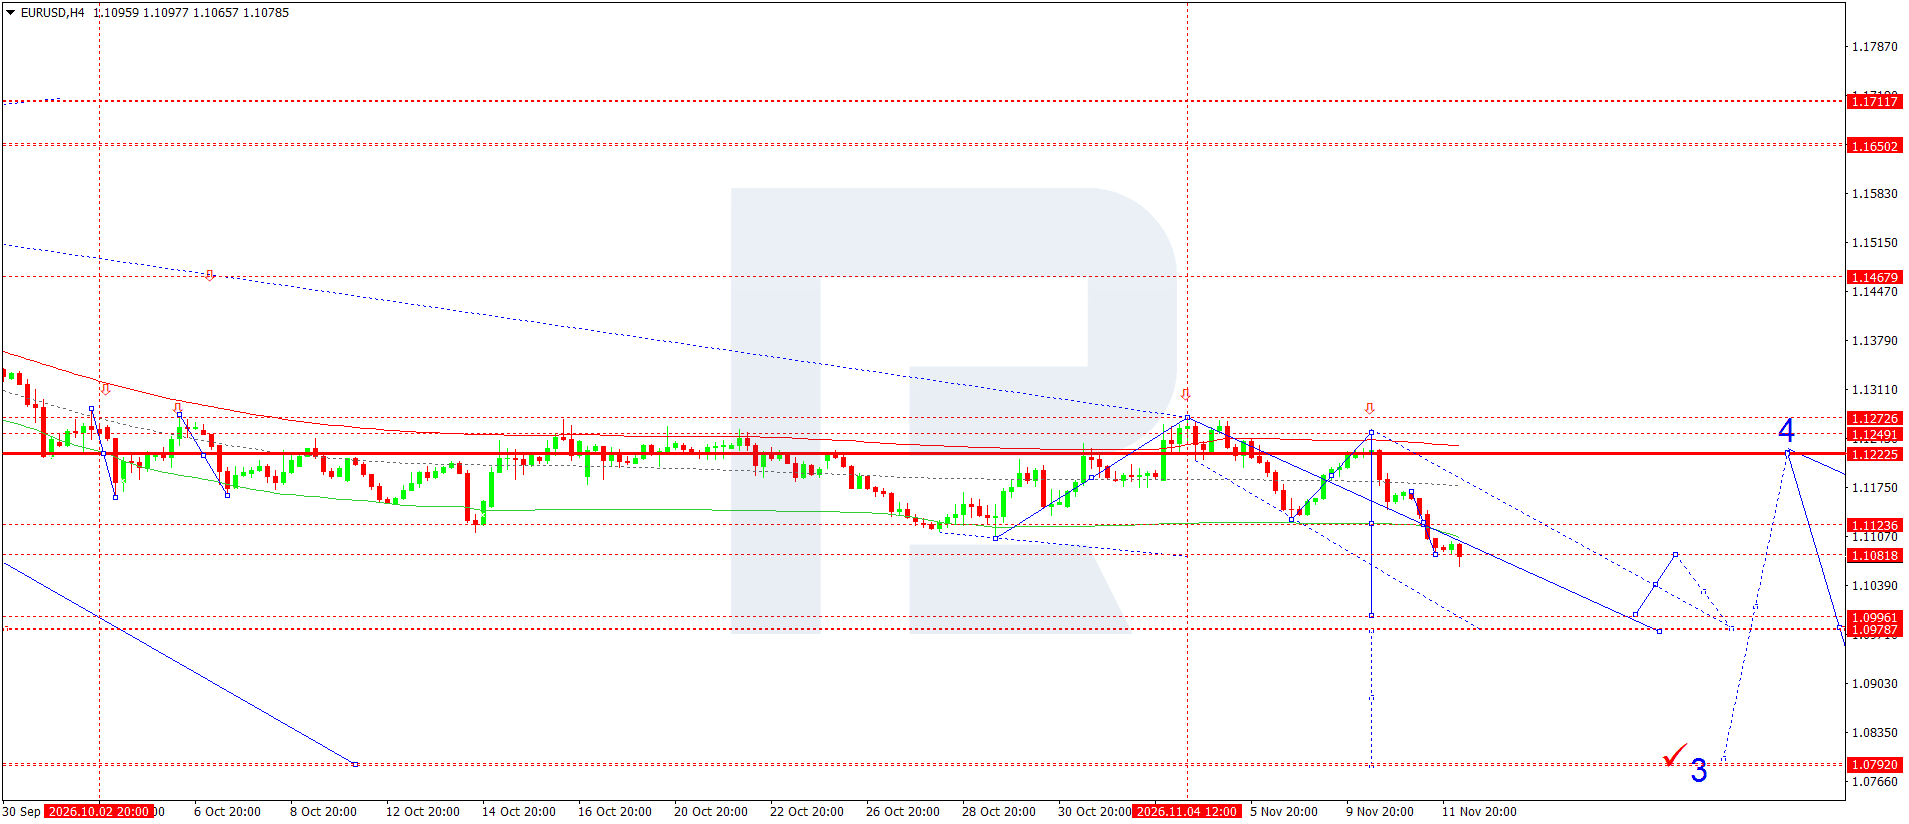
On the H4 chart, the price stands at 1.1079. After declining towards 1.1066, the market remains below the broken 1.1124 area. A sequence of lower local highs maintains the bearish structure. The nearest resistance level is around 1.1082, with the 1.1124 zone above it limiting a possible correction.
A brief consolidation followed by a test of the 1.1050 support level is likely today. Consolidation below this mark would open the way towards 1.0996 and 1.0990. The lower level of 1.0979 is the next reference point, while the 1.0792 area belongs to an extended scenario and is not considered a mandatory one-day target.
The preferred approach is to sell once the resumption of the decline is confirmed. The indicative entry price is five points below the displayed quote. A return above 1.1124 would weaken the bearish structure and require the scenario to be reconsidered. The plotted wave patterns are consistent with the direction of the move but do not independently confirm that the targets will be reached.
A support breakout is best assessed by the candlestick close and the absence of a rapid return to the previous range. A recovery above 1.1100 could lead to a correction, so an acceleration of the decline should be regarded as conditional rather than an event that has already occurred. Priority remains on observing the price reaction to the nearest support at the start of the European part of the trading session.
EURUSD forecast scenario
USDJPY forecast
The rise in US Treasury yields following the inflation releases is supporting the dollar against the yen. The reassessment of expectations concerning the Fed's next moves makes the yield differential a key reference for market participants. If US interest rates remain elevated, investors have an incentive to maintain dollar positions, although this strategy remains sensitive to abrupt changes in risk sentiment.
The Bank of Japan is also engaged in monetary policy tightening, as noted in the November review of international financial conditions. For the currency pair, however, the determining factor is not an individual rate change but the expected trajectory of yields in the two countries. If US indicators continue to support more hawkish expectations, Japanese rate increases may be insufficient to produce sustained yen strength.
Uncertainty in the Middle East adds risks in both directions. Rising costs for imported energy could worsen Japan's terms of trade, while a sudden shift away from risk could prompt investors to unwind positions against the yen. The fundamental backdrop therefore favours USDJPY gains only while market conditions remain calm. A sharp decline in US yields would be the main factor weighing against this scenario.
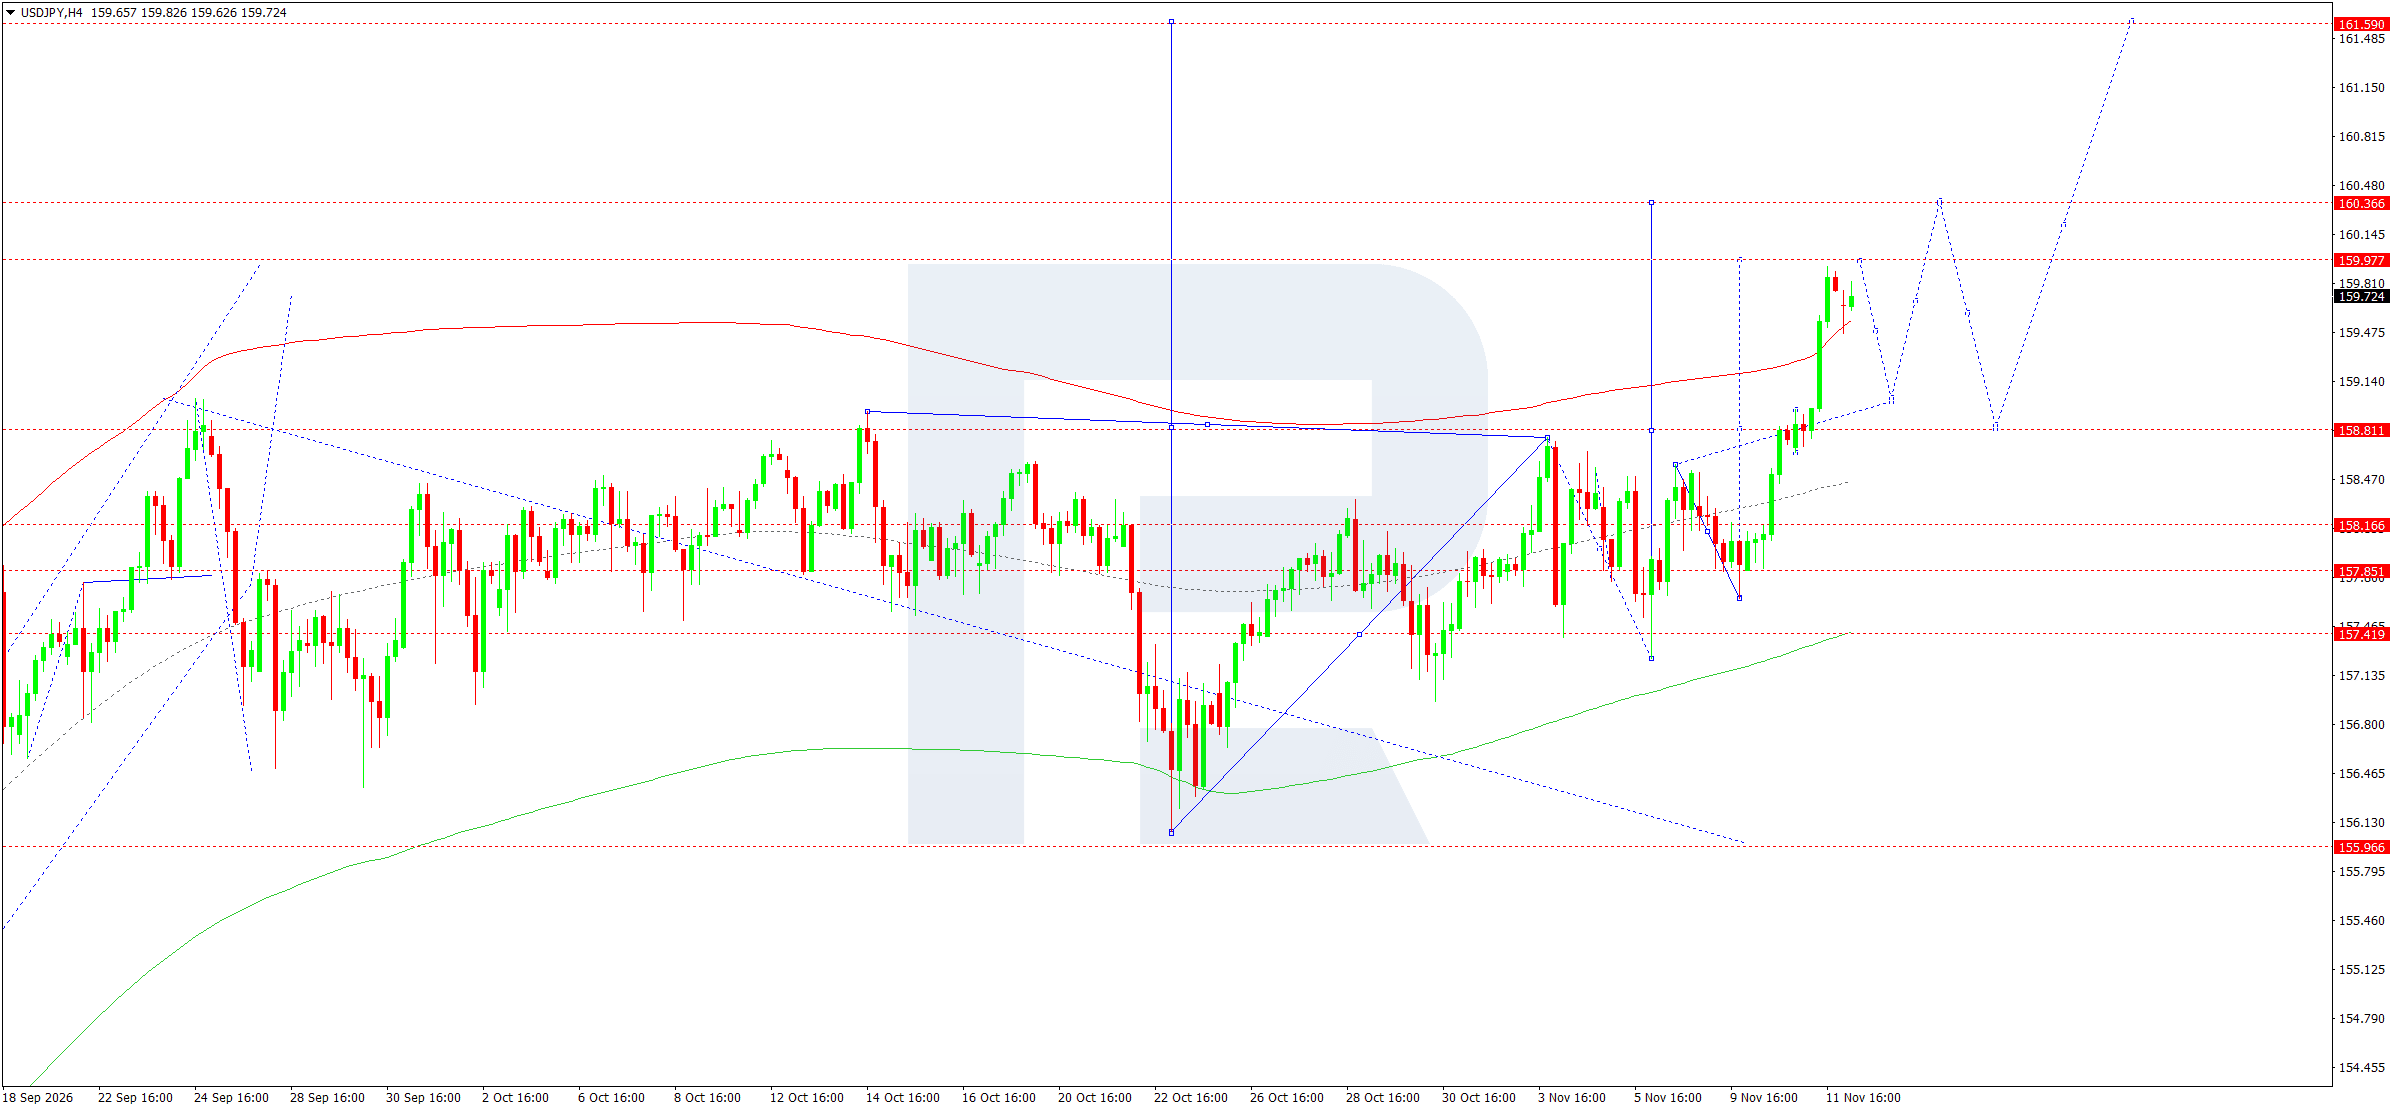
On the H4 chart, the price is hovering around 159.72. The market broke above the 158.81 area and formed a strong upward impulse, followed by a local correction. The nearest resistance level lies at 159.98, with 160.37 and 161.59 serving as subsequent reference levels.
The baseline scenario for 12 November envisages the upward direction being maintained, although a pullback towards 159.00 and then 158.81 is possible before the move continues. Holding the latter area would mean that the base of the current impulse remains intact. A breakout above 159.98 followed by consolidation would create conditions for a test of the 160.37 level.
The preferred trading setup involves buying when the advance resumes, with an indicative entry five points above the currently displayed price. The protective level lies below the nearest impulse-support area. A return below 158.81 would require the bullish scenario to be reassessed, as the likelihood of a move towards 158.17 would increase. The distant target of 161.59 remains a reference for trend continuation, rather than a mandatory outcome of today's session.
The wave count illustrates a possible sequence of movements but does not specify when they will occur. Confirmation of buyers' strength would come from holding the broken resistance on a subsequent retest from above.
USDJPY forecast scenario
GBPUSD forecast
At its meeting, the results of which were published on 5 November, the Bank of England raised its policy rate to 4%. The decision was passed by eight votes to one, with the dissenting member favouring a larger increase. This outcome reflects concerns about the inflationary consequences of the energy shock and provides sterling with some interest rate support.
However, a higher UK rate does not in itself remove pressure from the dollar. Following the US inflation figures, market participants are reassessing their Fed expectations, while rising US yields raise the hurdle for the attractiveness of alternative currencies. At the same time, expensive energy creates risks of slowing consumption and increasing business costs in the UK. The BoE's restrictive policy can therefore be seen as both support for the currency's yield and a constraint on future economic growth.
For today's session, the market's response to UK economic statistics and changes in relative yields is important. Without confirmed publication results, they cannot be declared positive or negative for sterling in advance. If demand for the dollar remains firm, any GBPUSD recovery will be vulnerable. Conversely, a fall in US yields could trigger a correction after the marked decline of recent days.
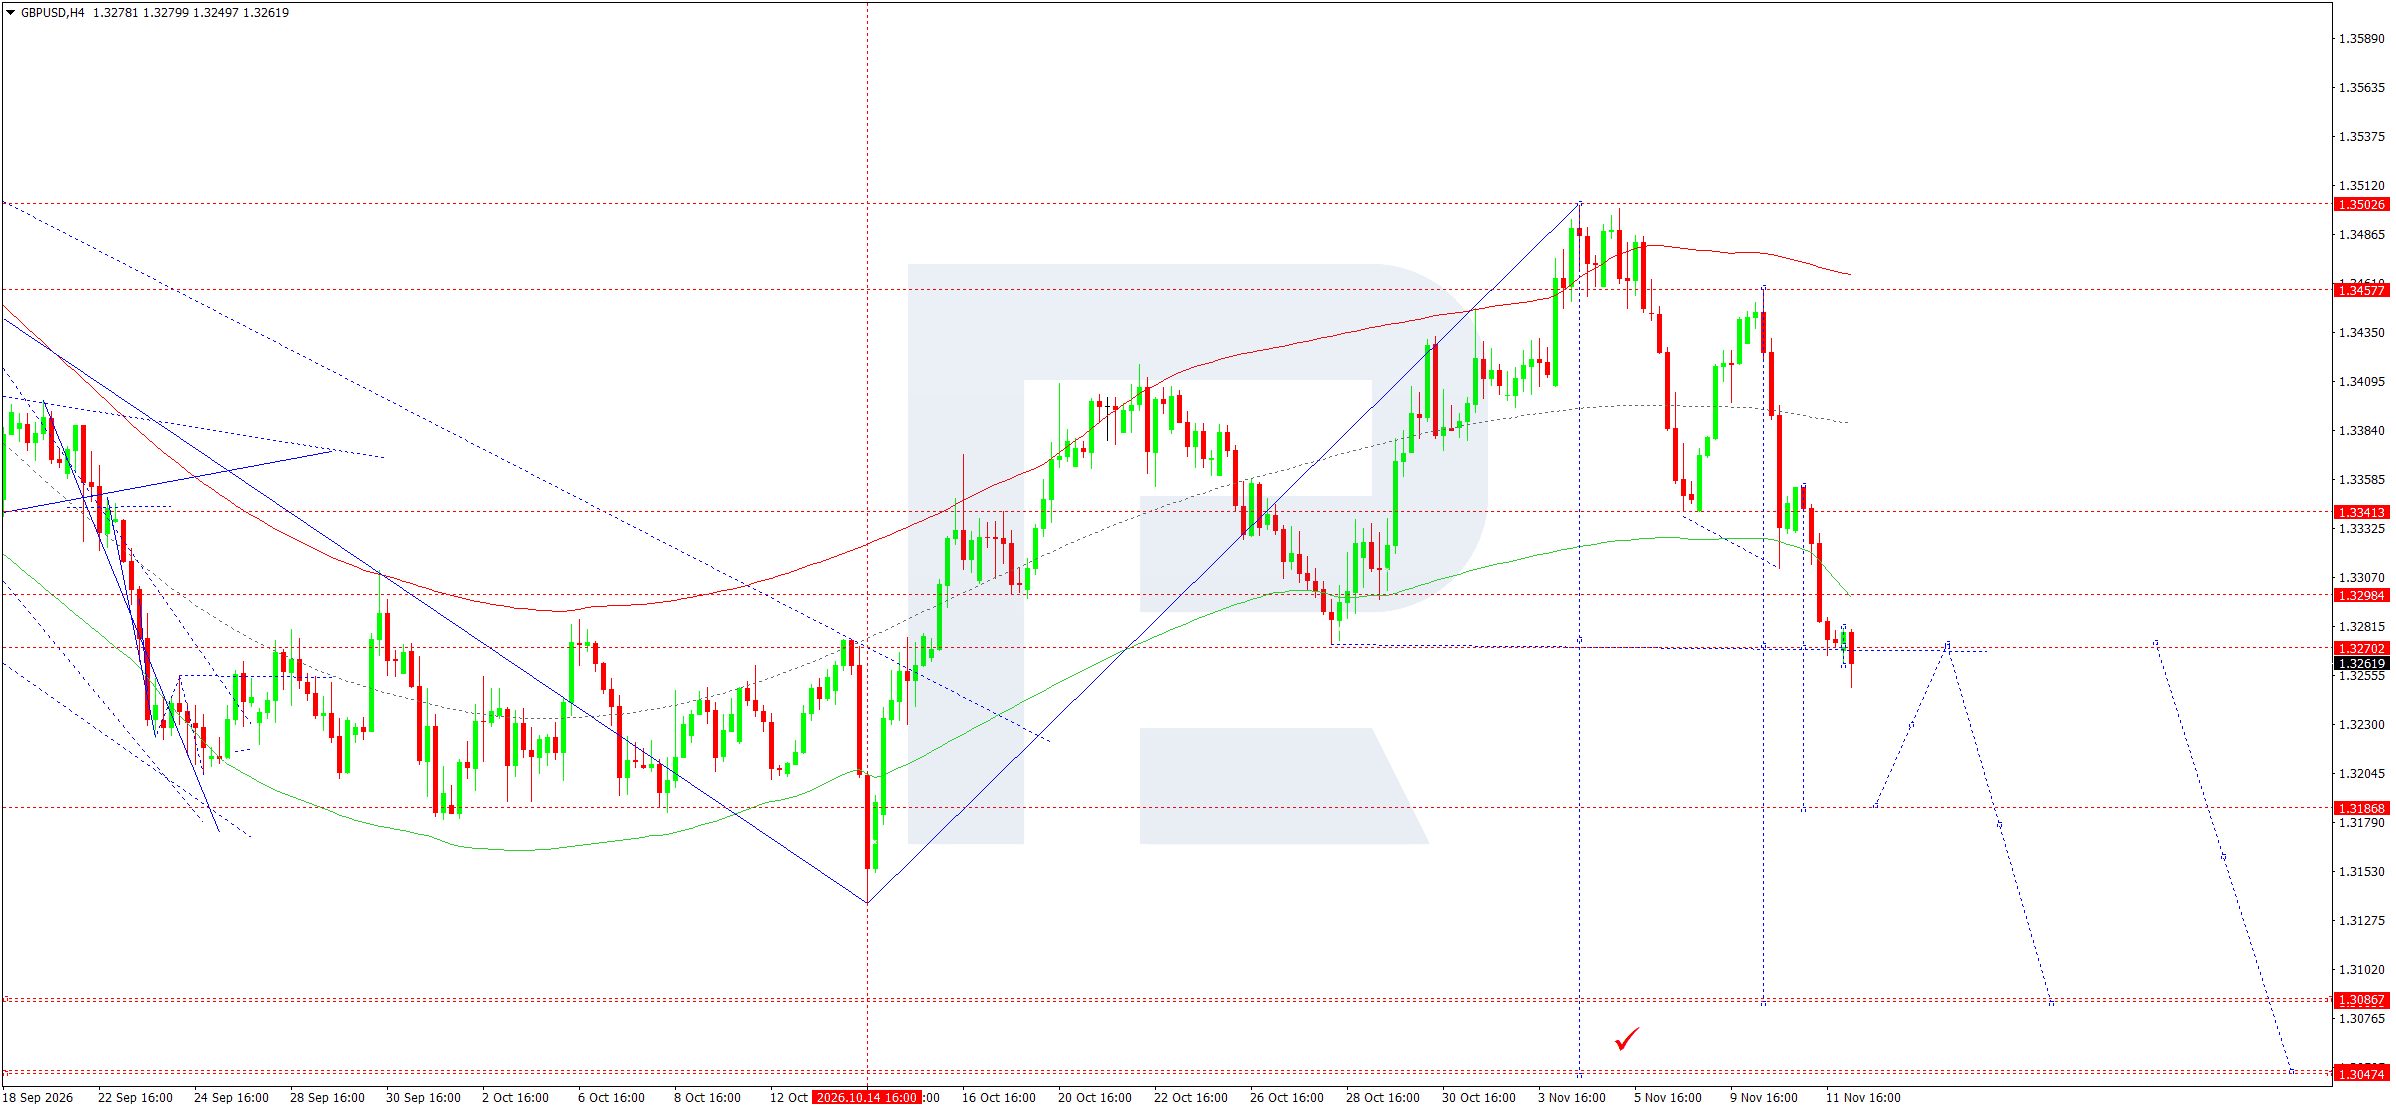
The price on the accompanying chart is 1.3262. After turning down from 1.3503, the pair broke successively through the 1.3341 and 1.3298 areas, approaching support at 1.3250. The downward impulse remains the main movement, and the nearest recovery attempts have not yet changed the structure.
For 12 November, a correction towards 1.3270 and 1.3282 is possible, after which selling may resume. A return below the local low would open the possibility of a decline towards 1.3187. The original reference to a decline towards 1.3311 is incorrect: that level is above the current price and can only be regarded as resistance.
The main trading scenario envisages selling once buyers' weakness is confirmed. The indicative entry is five points below the current quote, with the protective order above the nearest corrective area.
Consolidation above 1.3298 would weaken expectations of an immediate continuation of the decline. The 1.3087 and 1.3047 areas remain relevant to the extended bearish scenario, although they do not necessarily have to be reached within a single day.
Wave projections are used as a guide to the structure, not as a guarantee that every indicated move will unfold in sequence. This distinction is particularly important today.
GBPUSD forecast scenario
AUDUSD forecast
The Australian dollar remains sensitive to the combination of global interest rate expectations and demand for risk. Rising US yields following the inflation figures strengthened the US dollar's competitive advantage. For AUDUSD, conditions are particularly unfavourable when higher yields on dollar assets are accompanied by investor caution towards commodity currencies and global economic growth.
In its November review of financial conditions, the Reserve Bank of Australia notes the impact of stronger domestic inflation, expensive oil, and the previous rate increase on market expectations. This means domestic price risks limit the scope for rapid policy easing. However, interest rate support for the Australian dollar may be outweighed by a stronger shift in US expectations.
For the coming day, news concerning Chinese demand, industrial metals, and the energy market will also matter. Its impact should be assessed through actual price reactions, without presuming a rise or fall in commodity prices. Tensions in the Middle East increase uncertainty over production costs and international trade. If risk sentiment remains cautious, fundamental conditions will continue to make a sustained recovery in the Australian dollar difficult, although technical rebounds are possible after the sharp decline.
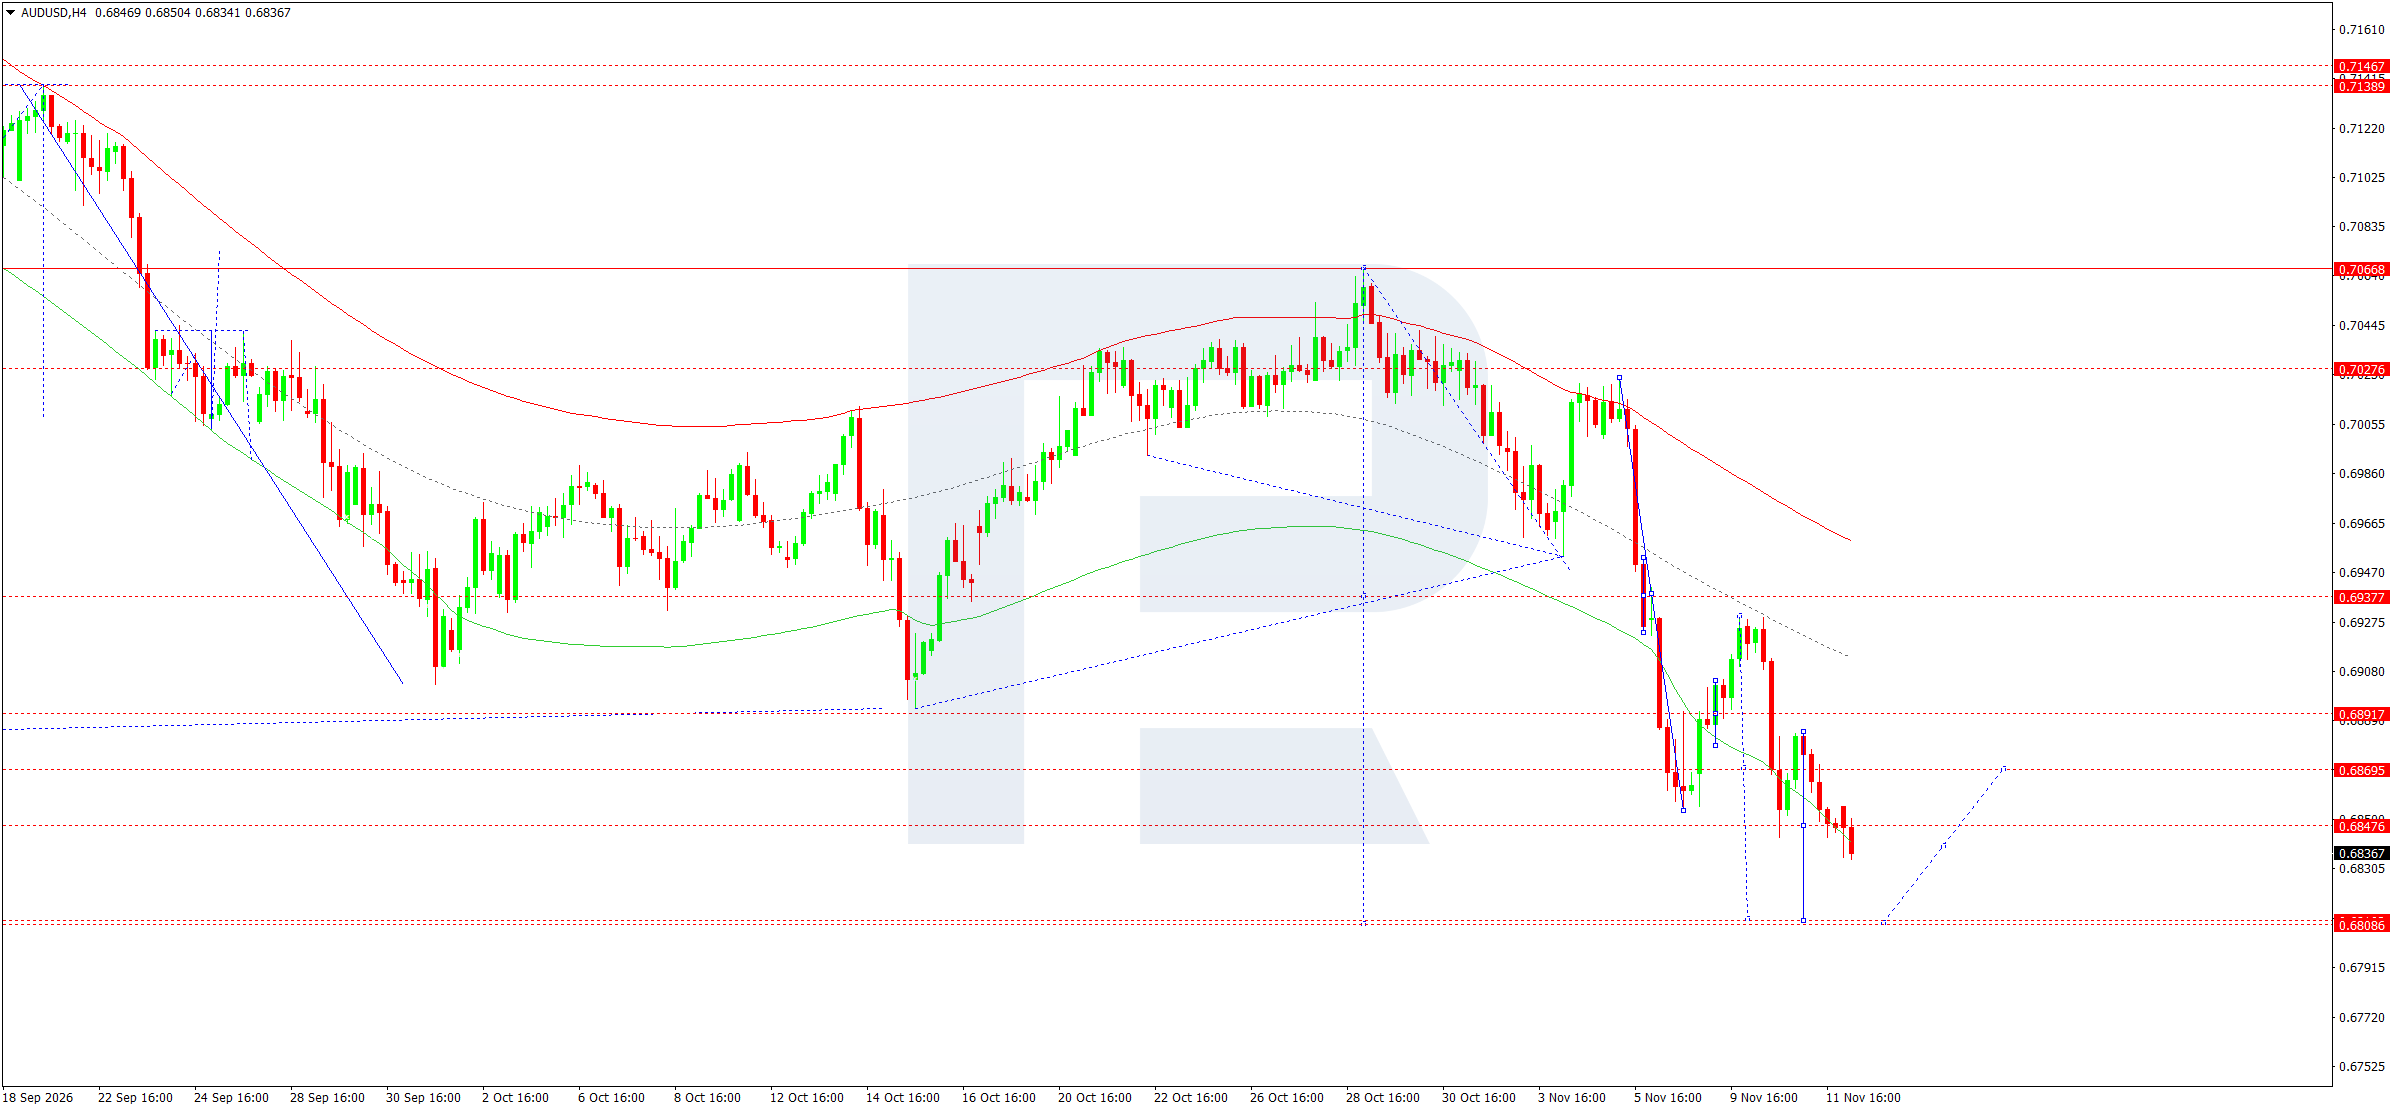
On the H4 chart, the price is around 0.6837. The pair is trading below 0.6848, while a sequence of lower highs confirms the sellers' dominance. The nearest downside target lies in the 0.6809 area. Resistance levels are at 0.6848, 0.6870, and 0.6892.
The preferred scenario for today is a continued decline after a brief consolidation or limited recovery. The correction towards 0.6950 mentioned in the original text is too far removed from the current structure to serve as the main daily scenario. A more appropriate initial rebound reference would be 0.6850, followed by 0.6870.
Selling is considered when the downward movement resumes, with an indicative entry five points below the displayed price. The protective level is placed above the nearest resistance, and the target corresponds to the marked lower area.
Consolidation above 0.6870 would weaken expectations of a quick move towards support and increase the probability of a deeper correction. If the price reaches 0.6809 without an interim recovery, the likelihood of a rebound will rise, so any continuation of selling will require fresh confirmation.
The plotted Price Envelope shows the direction of current pressure but does not rule out a temporary move beyond its boundaries during the session. This is important.
AUDUSD forecast scenario
USDCAD forecast
The fundamental assessment of USDCAD centres on the relative yields of US and Canadian assets, as well as conditions in the oil market. Rising US yields following the inflation releases support the dollar and increase pressure on the Canadian currency. If expectations of tighter Fed policy persist, buyers of the pair have an additional argument in favour of continued gains.
According to the November review of international financial conditions, the Bank of Canada also raised its policy rate during the period under consideration. It would therefore be incorrect to explain the pair's movement solely in terms of presumed easing of Canadian policy. What matters is the relative pace at which expectations change, the resilience of domestic demand, and the sensitivity of both economies to expensive financing.
Oil can either reinforce or restrain USDCAD gains. A sustained rise in crude prices usually improves Canada's export conditions, while lower oil prices could reduce this support. At the same time, geopolitical tensions can increase demand for the dollar regardless of short-term oil price dynamics. For 12 November, the main fundamental risk for buyers is a decline in US yields accompanied by a recovery in demand for commodity currencies. Without this combination, the upward bias remains intact.
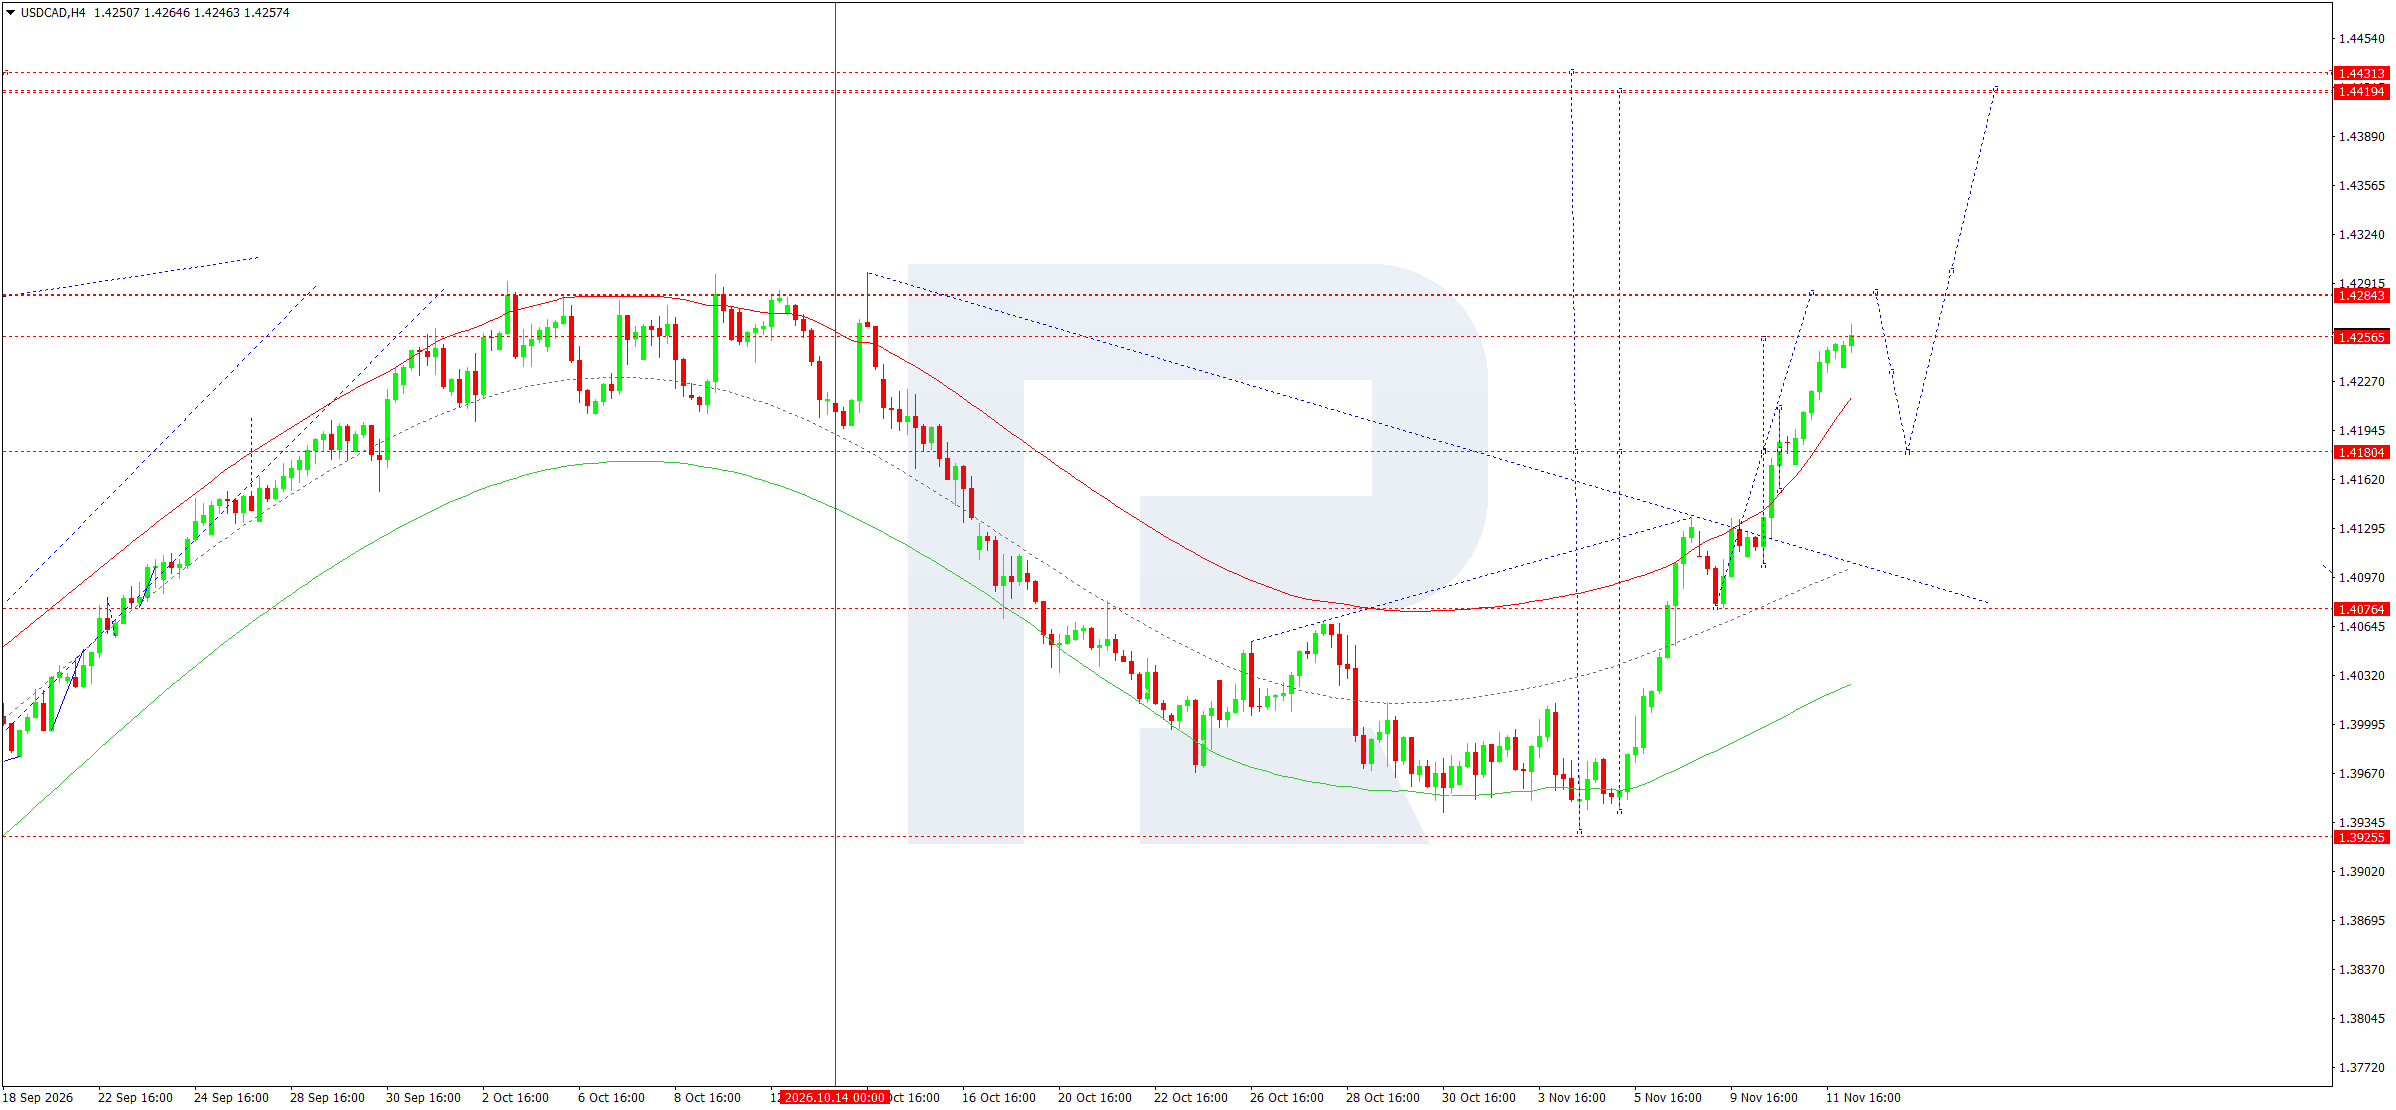
On the four-hour chart, the price stands at 1.4257. After turning upwards from the 1.3950 area, the pair formed a sustained sequence of higher lows and broke above 1.4180. The market is now testing resistance at 1.4257, with the next significant zone at 1.4284.
A consolidation below the nearest high followed by another attempt to advance is likely today. Firm consolidation above 1.4284 and a subsequent break through 1.4290 would open the way towards the 1.4419 area, although this distant reference is beyond the mandatory daily target. If the breakout fails, a correction towards 1.4180 is possible.
Buying is preferred once renewed momentum is confirmed. The indicative entry price is five points above the displayed quote; the protective order limits the risk of a return below the nearest local support.
For the bullish structure to remain intact, prices need to continue forming higher lows. A rapid return below 1.4257 after an attempted breakout would signal insufficient buying strength. In this case, the likelihood of reaching the upper target during the day would decrease. The wave projection suggests a subsequent pullback, so uninterrupted growth without corrections is not anticipated.
USDCAD forecast scenario
XAUUSD forecast
Gold begins the session under review under the influence of rising US bond yields and a stronger dollar following the inflation figures. These factors increase the opportunity cost of holding a metal that pays no interest. Accordingly, even persistently elevated inflation does not necessarily lead to higher gold prices if the market simultaneously anticipates a more hawkish Fed response.
For today's assessment, it is important to distinguish nominal yields from their changes relative to inflation expectations. Sustained increases in real yields generally exert more pronounced pressure on the metal. Conversely, falling yields amid continued inflation uncertainty could improve conditions for a recovery. The available material does not yet provide sufficient confirmation of a reversal in these factors to consider the correction complete.
Geopolitical risks surrounding the Middle East maintain potential demand for safe-haven assets. However, this channel may temporarily be outweighed by dollar liquidity and interest rate expectations. When investors need to reduce overall risk, selling can affect even defensive positions. The fundamental backdrop therefore implies heightened volatility and allows for brief rebounds within a downward move. A sustained improvement would require a reduction in interest rate pressure or another substantial inflow of safe-haven demand.
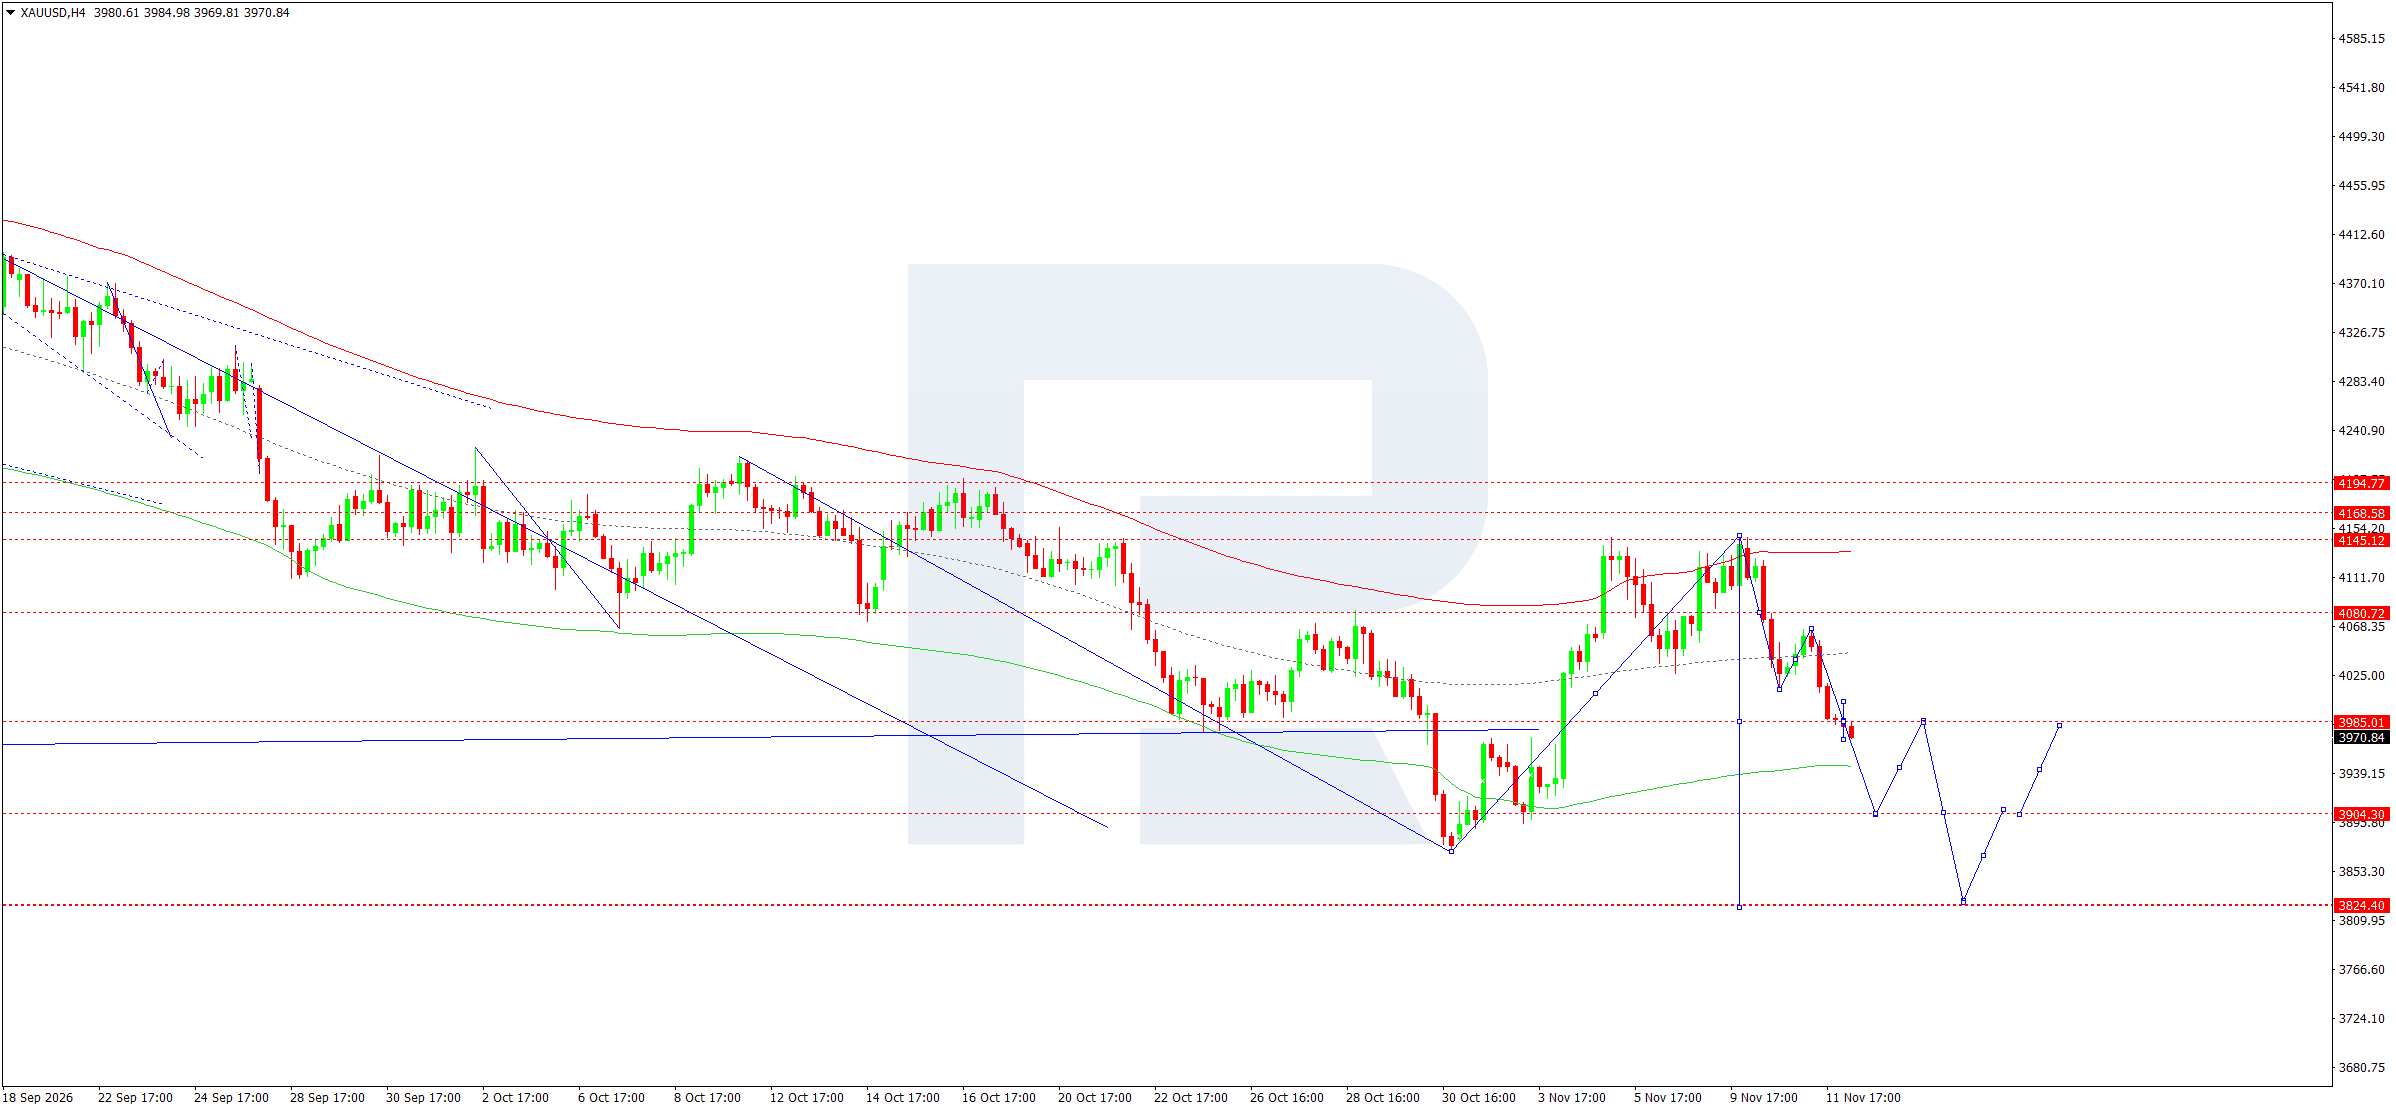
On the H4 chart, the latest displayed price rounds to 3,971. The market fell below support at 3,985 after failing to consolidate around 4,145. Subsequent local highs have declined, maintaining the bearish bias of the near-term move.
The main reference level for 12 November is 3,904. After reaching this area, a correction towards 3,985, which now acts as resistance, is possible. If support at 3,904 is broken and the price consolidates below it, the next marked target is 3,824. Reaching it would represent a continuation of the scenario and is not a mandatory outcome of today's trading.
The preferred approach is to sell while the price remains below 3,985. The entry is below the current quote, with the protective order above the possible recovery zone. Consolidation above 3,985 would weaken expectations of an immediate decline and create conditions for a recovery towards 4,081.
The wave count and Price Envelope boundaries are consistent with the bearish direction, but do not independently confirm it. If the price rapidly returns above the broken support, sellers' strength will need to be reassessed before opening a position. This is particularly important today.
XAUUSD forecast scenario
US 500 forecast
The US stock market is assessing the consequences of persistent inflation and rising capital costs. Following the latest price data, higher bond yields have intensified competition between equities and fixed-income instruments. For the index, this is unfavourable primarily because of the higher discount rate applied to future earnings and increased corporate financing costs.
Attention is also focused on technology-sector earnings and the economic returns from investment in artificial intelligence infrastructure. Strong results from individual companies could support the index, but do not remove the constraints imposed by more expensive money. The recovery in prices should therefore be assessed alongside the breadth of sector participation and the bond market's response.
Energy and geopolitical uncertainty add risks to corporate margins and consumer demand. Lower oil prices could ease costs, but may also reflect cautious expectations for global economic activity. The most favourable combination for the upcoming session would be falling yields alongside resilient earnings forecasts. If interest rate pressure persists, participants may use recoveries to reduce risk. The fundamental backdrop therefore suggests a continued correction without ruling out sharp intraday rebounds on individual corporate news.
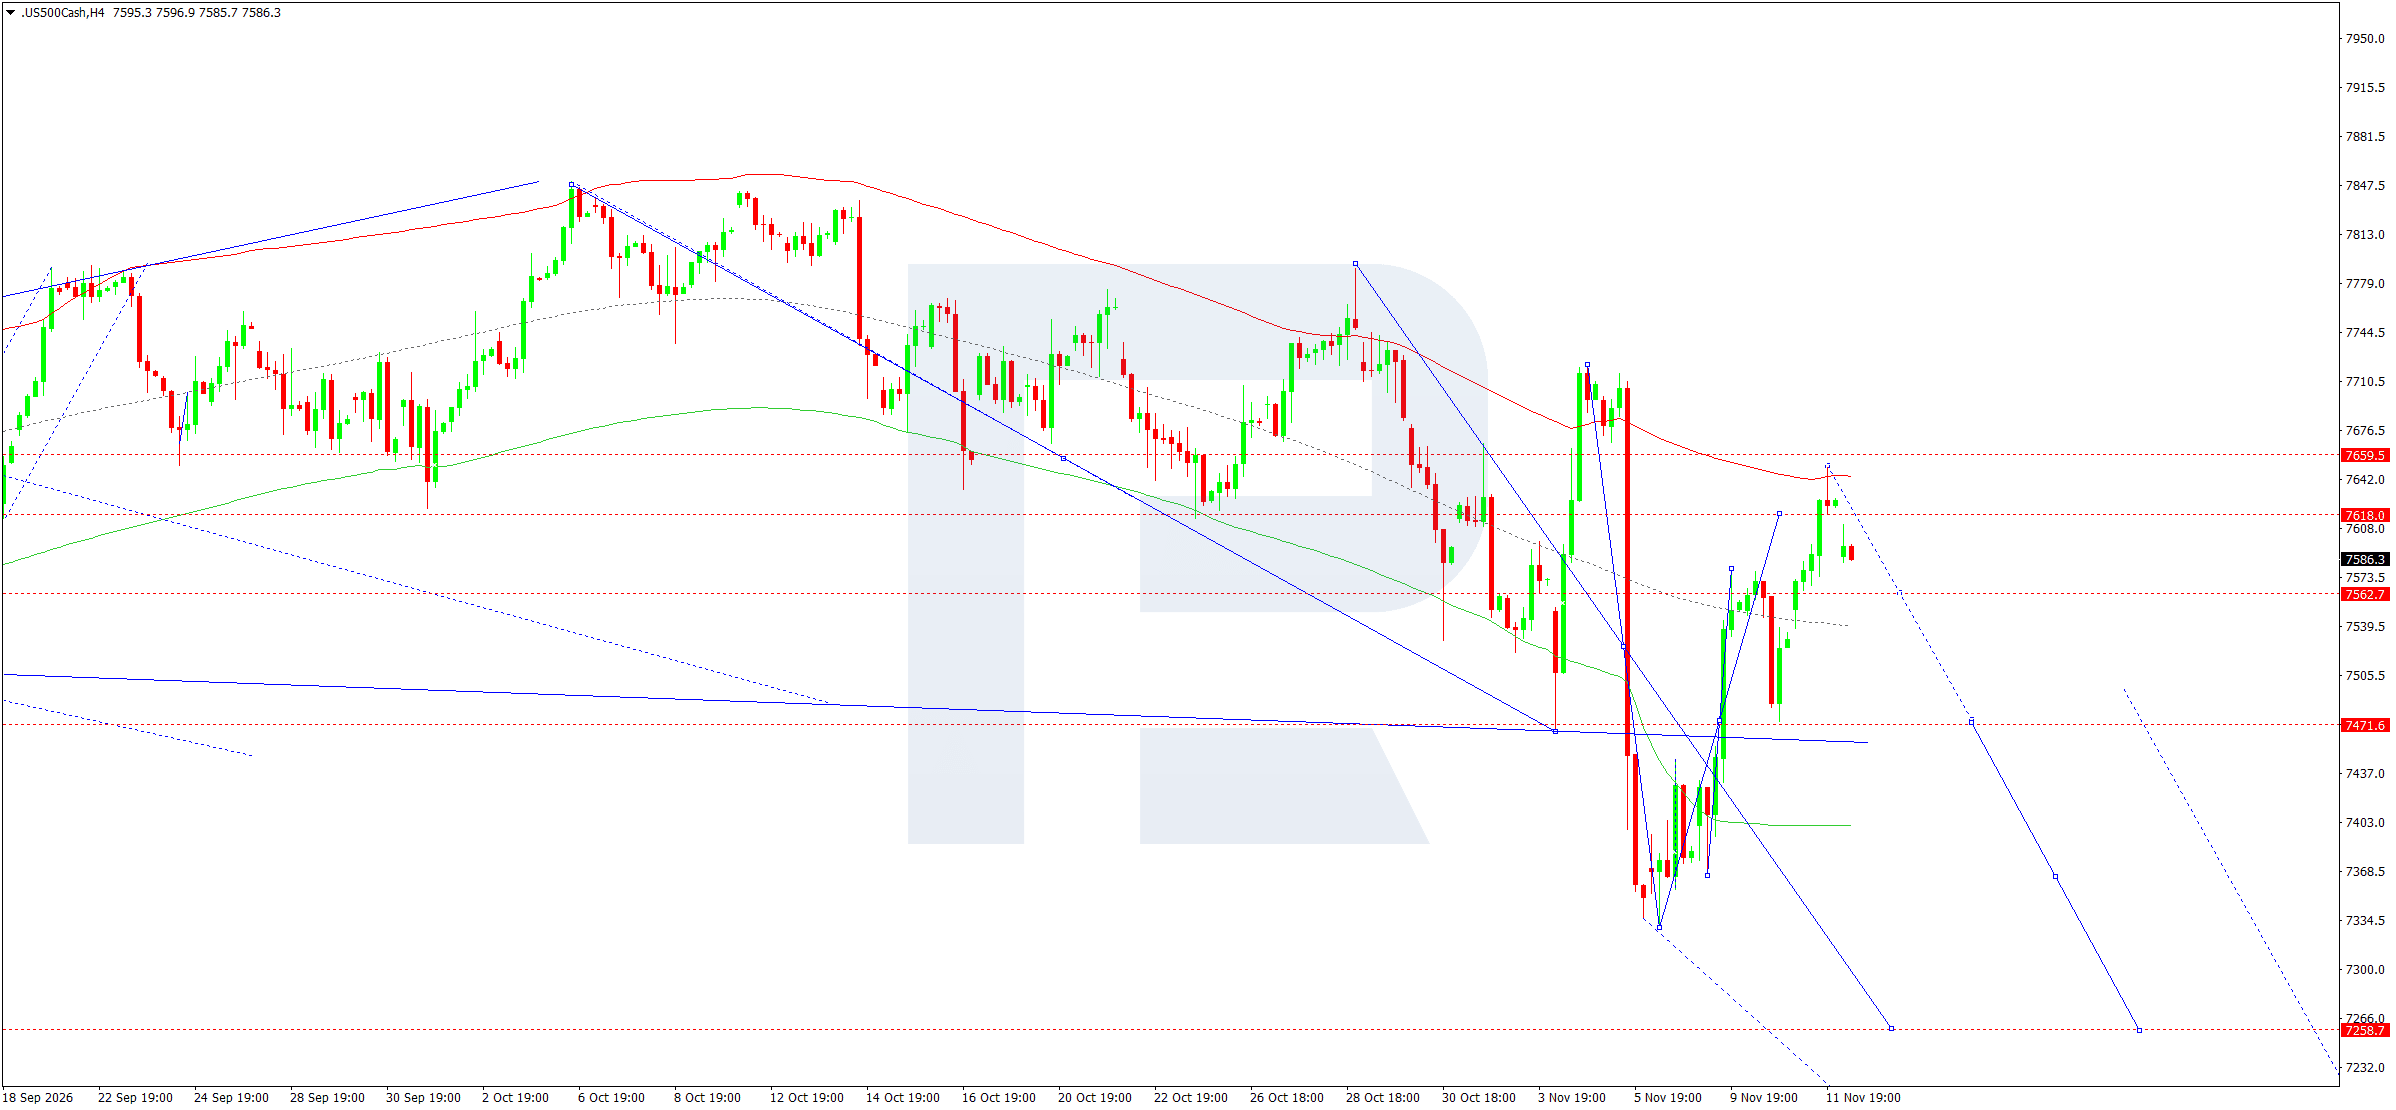
On the four-hour chart, US 500 is trading around 7,586. Following a recovery from the 7,330 area, the index approached the upper Price Envelope boundary but failed to remain above resistance at 7,618. The next supply zone lies around 7,650 and the marked 7,660 level.
For 12 November, a corrective decline remains the baseline scenario. A return below 7,563 would increase the probability of a move towards 7,472. This is the nearest significant downside target. A deeper break would open the way towards 7,403 and then 7,259, although these latter levels belong to an extended scenario.
Selling is preferred once weakness in the recovery is confirmed. The indicative entry is five index points below the displayed price, with the protective level above the nearest resistance. Consolidation above 7,618 would weaken the scenario of an immediate decline; a break through 7,660 would require a reassessment of the bearish bias.
The plotted projections suggest a continued decline after the rebound ends, but do not specify the movement's exact duration. If 7,563 holds, the market may remain range-bound for longer before choosing its next direction.
US 500 forecast scenario
BTCUSD forecast
Bitcoin is being assessed against a backdrop of rising US yields and cautious investor sentiment towards risk assets. Following the inflation figures, more hawkish expectations for the Fed have increased the appeal of dollar liquidity. For the cryptocurrency, this creates pressure through financing costs, a reduced willingness to use leverage, and competition from interest-bearing instruments.
At the same time, Bitcoin's long-term limited-supply proposition does not protect it from short-term liquidity contractions. During periods of interest rate reassessment, its price dynamics may depend on equity market behaviour and participants' overall appetite for speculative risk. A cryptocurrency decline amid inflation concerns is therefore not inherently contradictory.
Today, it is important to monitor the sustainability of dollar demand and signs of stabilisation in the stock market. Lower yields could ease the pressure, while further increases would hinder a recovery. Geopolitical uncertainty raises the likelihood of sharp swings but does not dictate a clear direction.
The material used does not contain verified information on today's exchange-traded fund flows or the scale of liquidations; the current movement cannot be attributed to them. The fundamental bias remains cautious until signs emerge of improving global liquidity and a recovery in sustained risk demand.
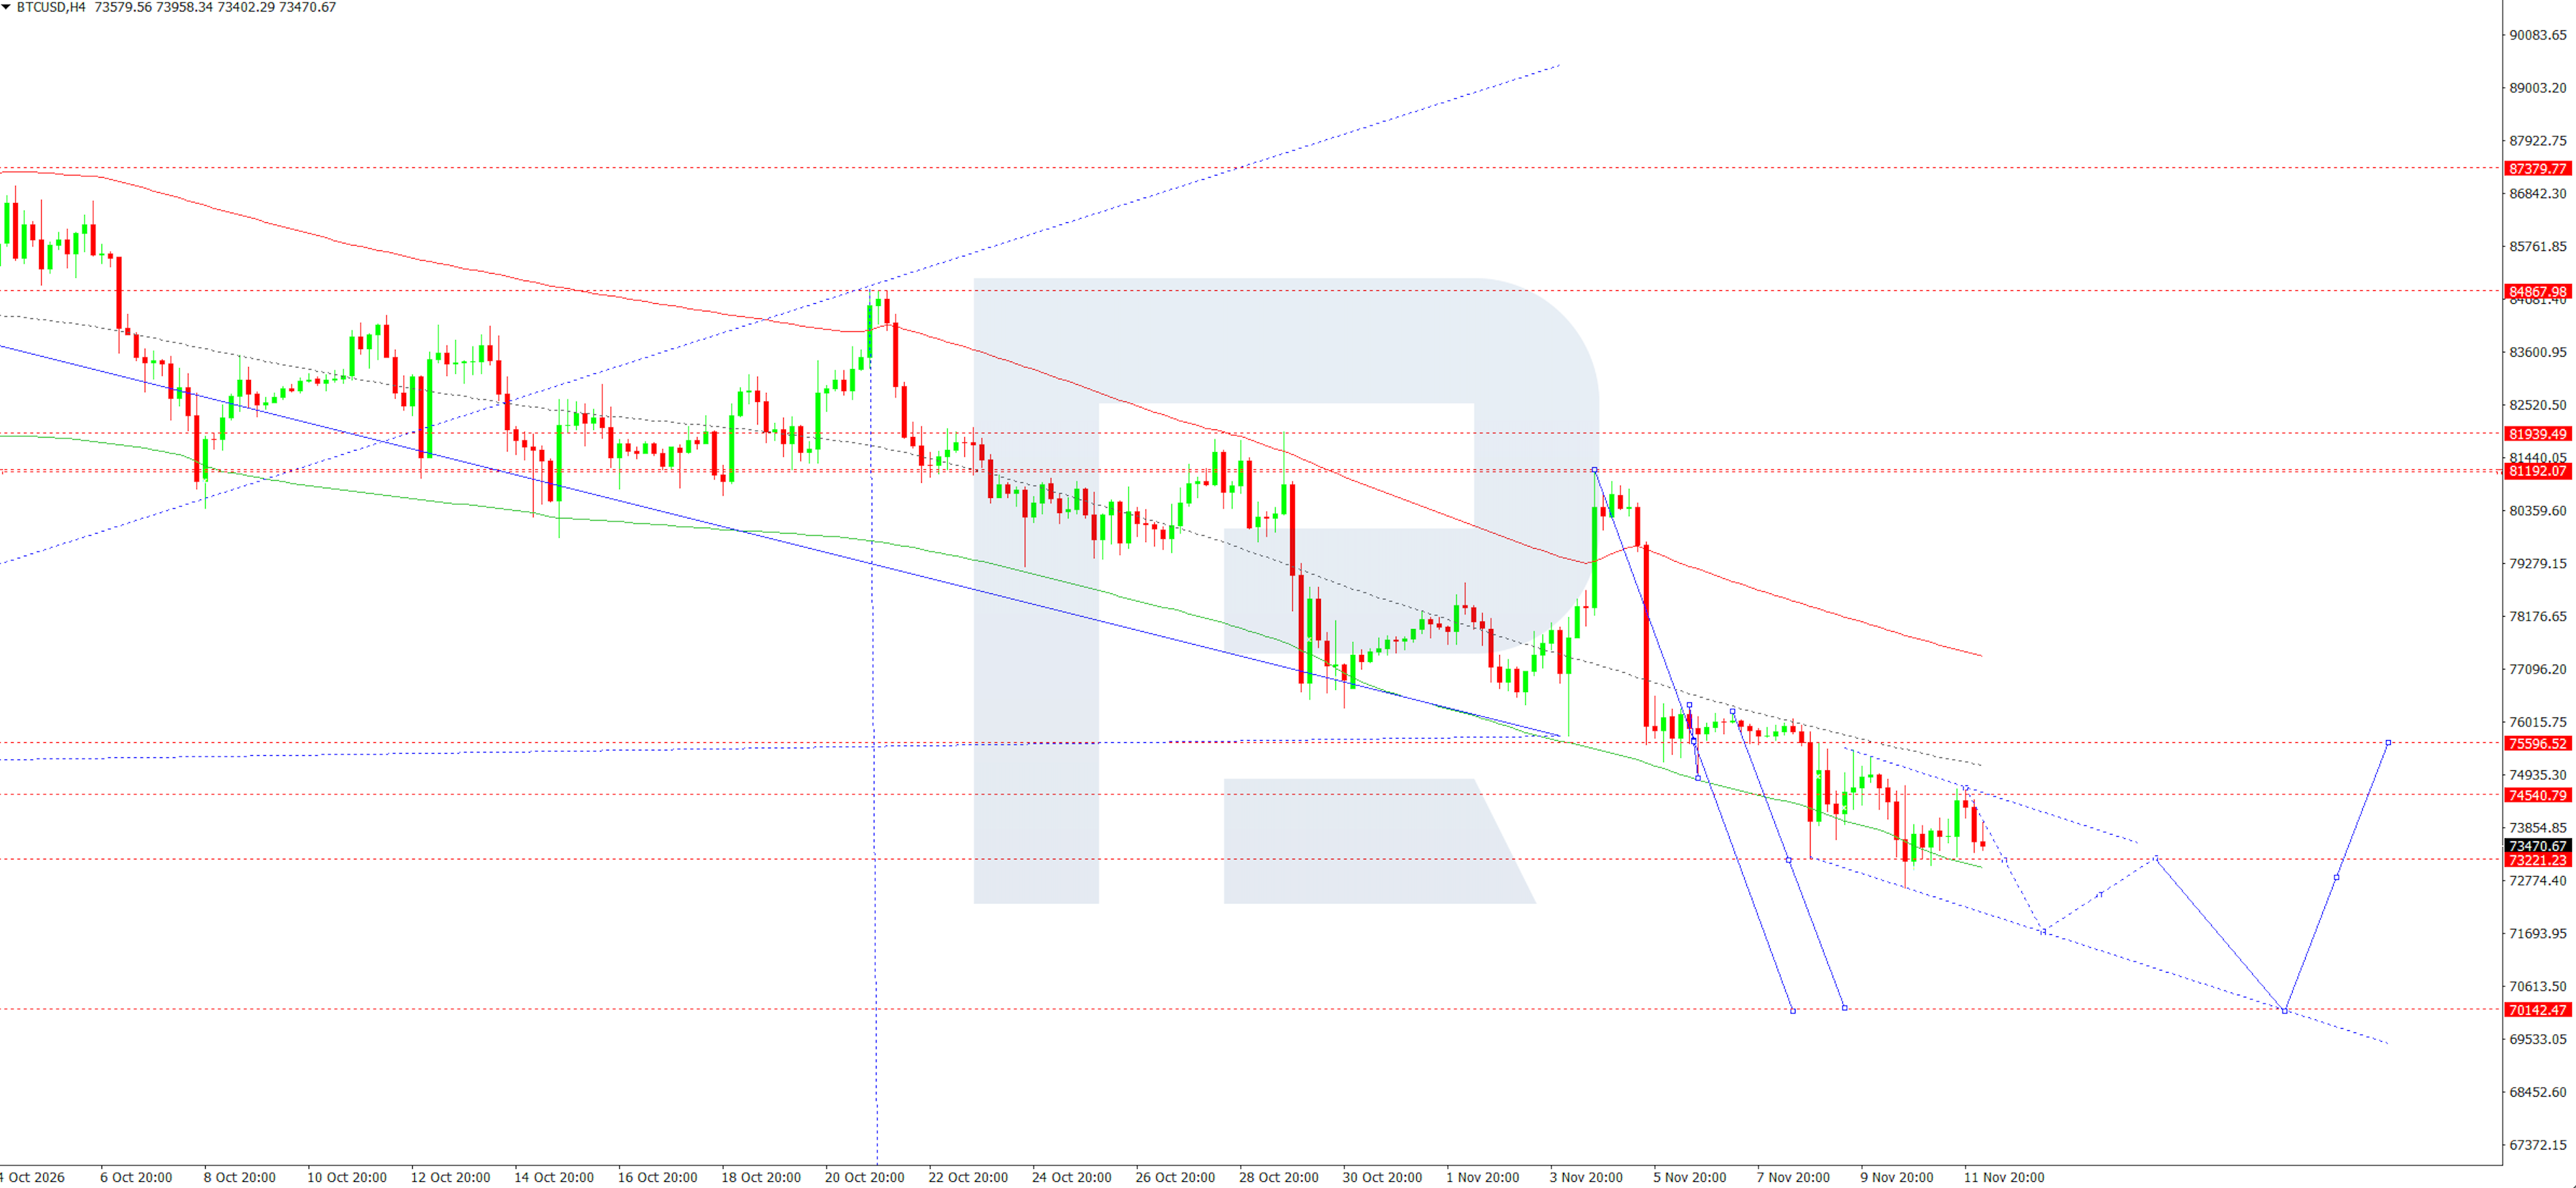
On the H4 chart, the price rounds to 73,471. The market maintains a sequence of lower highs and is trading below resistance at 74,541. The nearest support lies at 73,221, with the next intermediate area around 71,711.
The baseline scenario for 12 November envisages a test of 73,221 and a continued decline if the price consolidates below it. A break through 71,711 would open the possibility of a move towards 70,142. Near the latter area, the plotted projection allows for a recovery, so it should be treated as a zone where the short-term balance could change.
Selling is preferred following a confirmed breakout below the nearest support. The entry is below the current price, with the protective order above the local resistance zone. A return above 74,541 would weaken the scenario of further losses, while consolidation above 75,597 would require a more substantial reassessment of the structure. The 70,142 target remains conditional and does not have to be reached within a single session.
High volatility leaves room for interim rebounds, so the plotted wave path is regarded only as a working hypothesis for trend continuation. This is important today.
BTCUSD forecast scenario
Editors’ picks


EURUSD forecast 2026–2027: technical analysis, price levels & predictions
The EURUSD outlook for 2026 and 2027: key levels on the daily chart, three trading scenarios and the policy gap between the Fed and the ECB that drives the pair.

Gold (XAUUSD) forecast 2026: technical analysis, price levels & predictions
Where gold could trade in 2026: key levels, three trading scenarios with entry triggers and the forecasts from J.P. Morgan, Deutsche Bank and Goldman Sachs.
Forecasts presented in this section only reflect the author’s private opinion and should not be considered as guidance for trading. RoboForex bears no responsibility for trading results based on trading recommendations described in these analytical reviews.