
Daily technical analysis and forecast for 13 November 2026
Daily technical analysis and forecast for EURUSD, USDJPY, GBPUSD, AUDUSD, USDCAD, XAUUSD, US 500, and BTCUSD for 13 November 2026.
Each scenario on this page reflects the market structure on the H4 chart as of 10:00 AM UTC+3 on 13 November 2026. The assessment considers the current H4 chart structure, key support and resistance levels, the direction of the medium-term movement, and the prevailing fundamental backdrop.
EURUSD forecast
By the morning of 13 November, the dollar continues to receive support from revised expectations for US interest rates. The US Federal Reserve faces persistent inflationary pressure: consumer prices rose by 0.4% month-on-month in October, while the core measure gained 0.3%. These results strengthen the case for further monetary policy tightening. The European Central Bank kept its deposit rate at 2.50% on 29 October, while highlighting the risks of accelerating inflation and slowing growth due to the energy shock. This combination is unfavourable for the euro: more expensive energy weakens the economic outlook, while rising US bond yields support the dollar's appeal.
Nevertheless, further declines in the pair depend on incoming data, as a substantial proportion of expectations is already reflected in prices. A decline in yields could trigger the closing of short positions. Throughout Friday, participants will assess the resilience of dollar momentum and changes in global risk sentiment. The baseline fundamental assessment remains moderately negative for the euro, although this does not in itself rule out an intraday recovery.
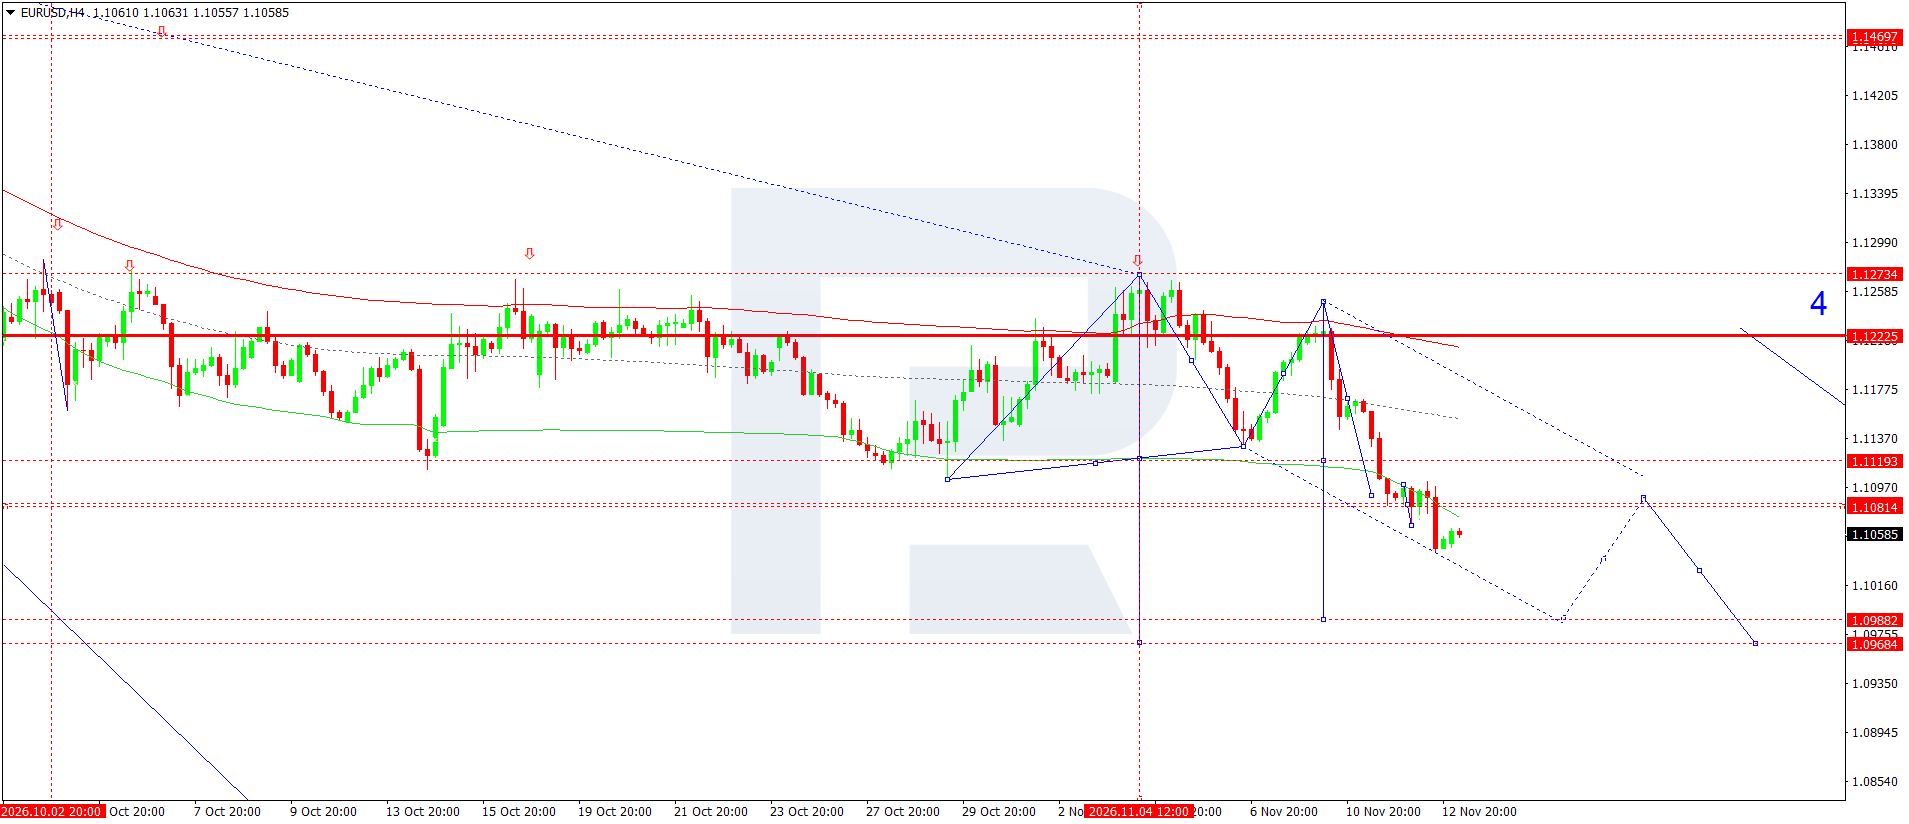
On the H4 chart, the latest price is 1.1059. The sequence of lower highs and lower lows confirms a sustained downward trend. The quote is below the middle line and the lower boundary of the displayed Price Envelope, indicating strong momentum while also increasing the likelihood of a technical rebound. The nearest resistance is around 1.1081, followed by 1.1119. The preferred scenario today is brief consolidation followed by a further decline. Consolidation below the local low around 1.1044 would open the way towards 1.0988. The next target is 1.0968, which will require selling pressure to persist.
The wave interpretation allows for a recovery ahead of a new phase of selling, but a fresh low is needed to confirm continued momentum. The 1.1119 area is an important resistance pivot within the structure under review. When assessing price movements, priority should be given to the sequence of swing highs and lows and to horizontal levels.
Selling is considered if the downward movement resumes; a return above 1.1119 would invalidate the selected short-term idea. A deeper decline would require a decisive break through the nearest support levels; until then, extending the daily targets would be premature. The most significant confirmation of selling would be an H4 candlestick close below local support without an immediate price recovery above it.
EURUSD forecast scenario
USDJPY forecast
On the morning of 13 November, rising US government bond yields are supporting the dollar against the yen. The market is reassessing the likelihood of a more restrictive Fed policy following persistent inflation readings. At the same time, the Bank of Japan (BoJ) continues to discuss monetary policy normalisation. In the summary of the October meeting published on 10 November, participants noted the need for further rate increases if economic conditions matched forecasts. The dollar's fundamental advantage cannot therefore be considered unconditional: faster tightening in Japan could narrow the yield differential and support the yen.
The exchange rate's proximity to the psychological 160 level is also significant. On Friday morning, Japanese authorities again signalled their readiness to respond to excessive currency volatility. This increases the likelihood of sharp corrections even if the uptrend persists. It is important to distinguish warnings from actual operations: the morning reports used do not confirm any new intervention. For the coming day, the main external references remain US bond movements, statements by Japanese officials, and stock market sentiment. A decline in risk appetite could increase demand for the yen.
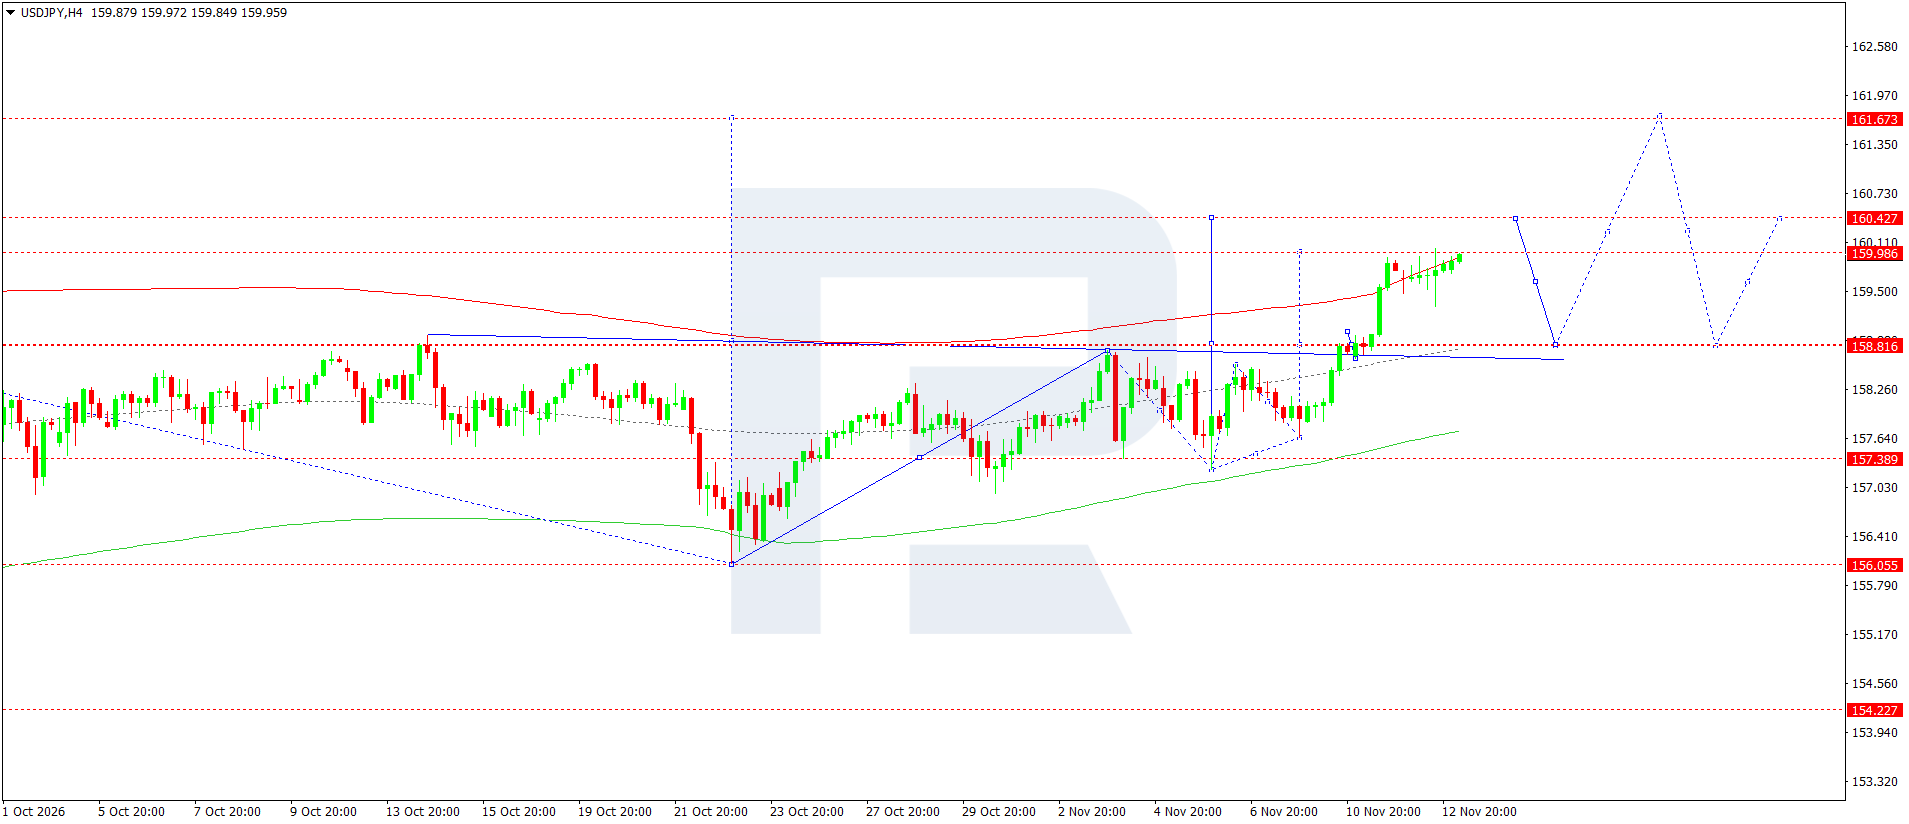
On the H4 chart, the latest quote is around 159.96. After moving above 158.82, the pair formed a sequence of higher lows, while the price is holding above the upper Envelope line. This is consistent with upward momentum, although proximity to resistance at 159.99 limits the appeal of an immediate entry. The nearest upside target is 160.43. The 161.67 level remains a more distant reference and would first require consolidation above the initial target.
Today's baseline scenario envisages an attempt to break through 160.00, followed by a move towards 160.43. Before the rise continues, a pullback towards the 159.30 area mentioned in the original description is possible; the more significant support shown on the chart is around 158.82. A return below that level would materially weaken the technical picture.
The blue projected path shows several possible fluctuations and should not be interpreted as a mandatory sequence of future candles. The wave interpretation remains a working hypothesis. Under the selected scenario, buying is considered only after a confirmed breakout above the nearest resistance.
A return below 159.70 following the breakout would be grounds for abandoning this local idea while continuing to monitor a deeper correction. The proximity of a potential intervention zone calls for particularly close attention to the speed of price movements.
USDJPY forecast scenario
GBPUSD forecast
The fundamental backdrop for sterling remains mixed on the morning of 13 November. Data released the previous day showed that UK GDP grew by 0.7% in the third quarter, following growth of 0.5% in the second quarter. Resilient economic activity strengthens the case for restrictive monetary policy. The Bank of England raised interest rates the previous week in response to inflation risks. However, positive domestic figures have not yet given sterling an advantage over the dollar, as the US market is also pricing in further tightening of financial conditions.
For the UK economy, high energy prices create a two-sided situation. They increase price pressures while simultaneously constraining households' real incomes and businesses' capacity. Higher interest rates therefore do not necessarily lead to sustained currency appreciation if they are accompanied by a deterioration in the demand outlook. US bond yields and investors' overall risk sentiment will be important in the upcoming session. If demand for the dollar persists, a GBPUSD recovery could remain corrective. A more pronounced decline in US yields, by contrast, would create conditions for a rebound after the recent fall.
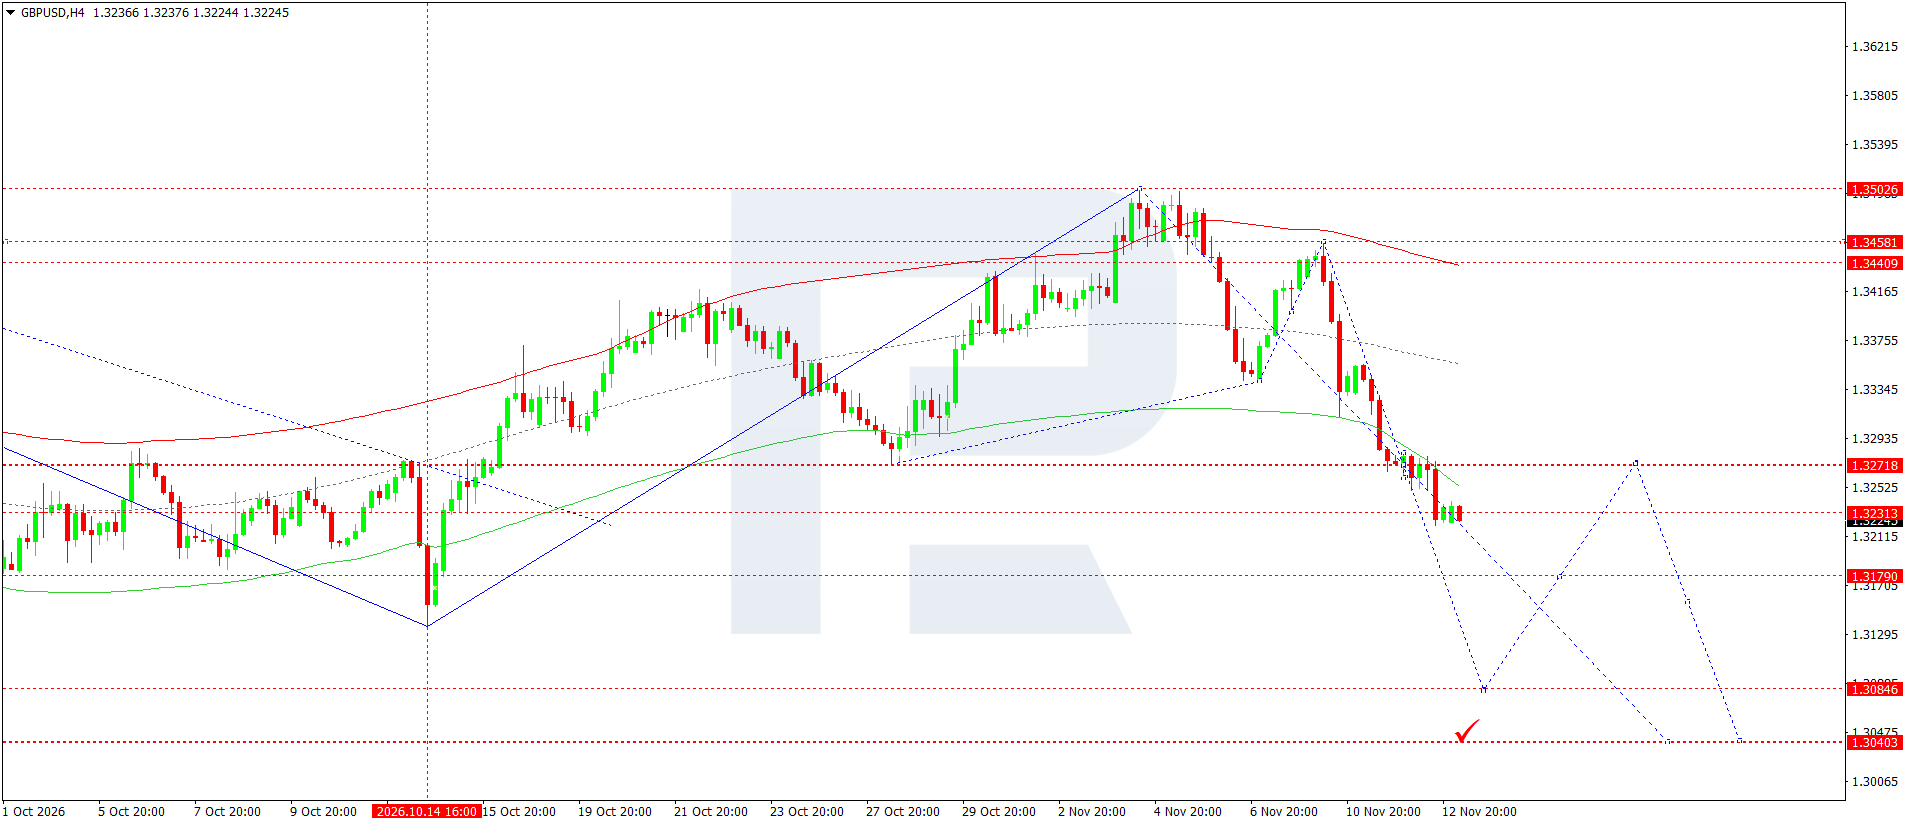
On the H4 chart, the latest price is 1.3225. Following a reversal from 1.3503, the market established a downward sequence and fell below the Envelope lines. The nearest resistance area lies between 1.3249 and 1.3272. The first level corresponds to a possible corrective return, while the second marks the upper boundary of a former support area that may now restrain buying. As long as the price remains below this area, sellers retain the advantage.
Consolidation near current levels and an attempt at recovery are possible today, after which the decline may resume. The nearest support is at 1.3179; a break below it would open the way towards 1.3085. The next target at 1.3040 relates to a continuation of the move and should not be treated as a mandatory daily target.
The wave structure allows for several corrective patterns before the decline continues. The 1.3265 area is an additional reference within resistance, where it will be important to assess buyers' ability to hold prices. A fading recovery would strengthen the case for a move towards the lower targets.
Selling is considered if downward momentum continues. Sustained recovery above 1.3272 would invalidate the local scenario and require the depth of the correction to be reassessed before trading decisions are made. If the support breakout is weak, the probability of a return to the previous range will remain high.
GBPUSD forecast scenario
AUDUSD forecast
The Australian dollar begins 13 November under the influence of conflicting factors. The Reserve Bank of Australia raised the cash rate by 25 basis points to 4.85% on 3 November. This decision supports yields on Australian assets and reflects continuing concerns about inflation. However, tighter domestic policy does not guarantee currency appreciation when the US dollar is supported by rising yields and expectations of further US rate increases.
Global risk appetite is also important for AUDUSD. Instability in the technology sector and geopolitical uncertainty may limit demand for currencies sensitive to the economic cycle. The outlook for Chinese demand and commodity markets remains an additional channel of influence, but no improvement in these factors had been confirmed at the information cut-off used. They should therefore be treated as conditions that could change the scenario, rather than as an already established positive impulse. For the coming day, the balance of factors appears moderately negative for the Australian currency. A decline in US yields or a recovery in equity indices, conversely, could trigger corrective appreciation in the pair.
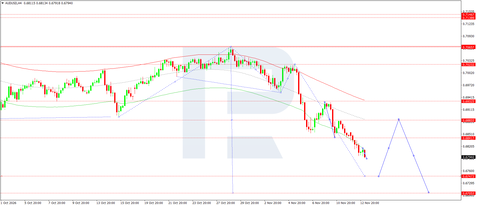
On the H4 chart, the latest price is around 0.6794. The market continues to set new lows and remains below the downward-sloping Envelope lines. The former 0.6886 area is now considerably above current quotes and represents resistance, rather than the prevailing consolidation range. Buyers' inability to reclaim this area confirms that sellers retain the initiative.
A brief rebound towards 0.6815 is possible today, after which sellers may renew their pressure. The nearest notable resistance above is at 0.6842. The principal target for a continued decline is around 0.6747. A break below it would make 0.6705 the next reference, although reaching that level could require several sessions.
The blue projection allows for a deeper recovery following the initial decline but does not prescribe a mandatory path. Within the wave model, the persistence of lower highs supports the hypothesis of further downward momentum. The preference for selling is therefore determined by the direction of the highs, the price's position relative to the Envelope, and the nearest levels.
An entry is considered if the decline resumes below the current area. Consolidation above 0.6842 would invalidate the local continuation idea and increase the likelihood of a prolonged correction towards previous resistance levels. Selling pressure would be confirmed by a new low without a rapid recovery above the broken level.
AUDUSD forecast scenario
USDCAD forecast
By the morning of 13 November, USDCAD is being supported by a strong US dollar, although the Canadian currency's position cannot be explained solely by diverging monetary policy directions. The Bank of Canada (BoC) raised its target rate by 25 basis points to 2.50% on 28 October. It would therefore be incorrect to suggest that Canadian policy is continuing to ease. Nevertheless, US interest rates remain higher, and expectations of further tightening in the US support the appeal of dollar-denominated assets.
Oil is a separate factor for the Canadian dollar. Rising commodity prices usually improve Canada's export revenues and may restrain gains in the pair. At the same time, a geopolitical surge in oil prices can worsen global risk sentiment and strengthen demand for the US dollar. The overall reaction therefore depends on what drives the commodity market's movement, not merely its direction. For the coming day, attention will focus on US bond yields, the sustainability of the rise in oil prices, and potential changes in rate expectations. Together, these factors suggest that the likelihood of two-way intraday fluctuations will remain elevated.
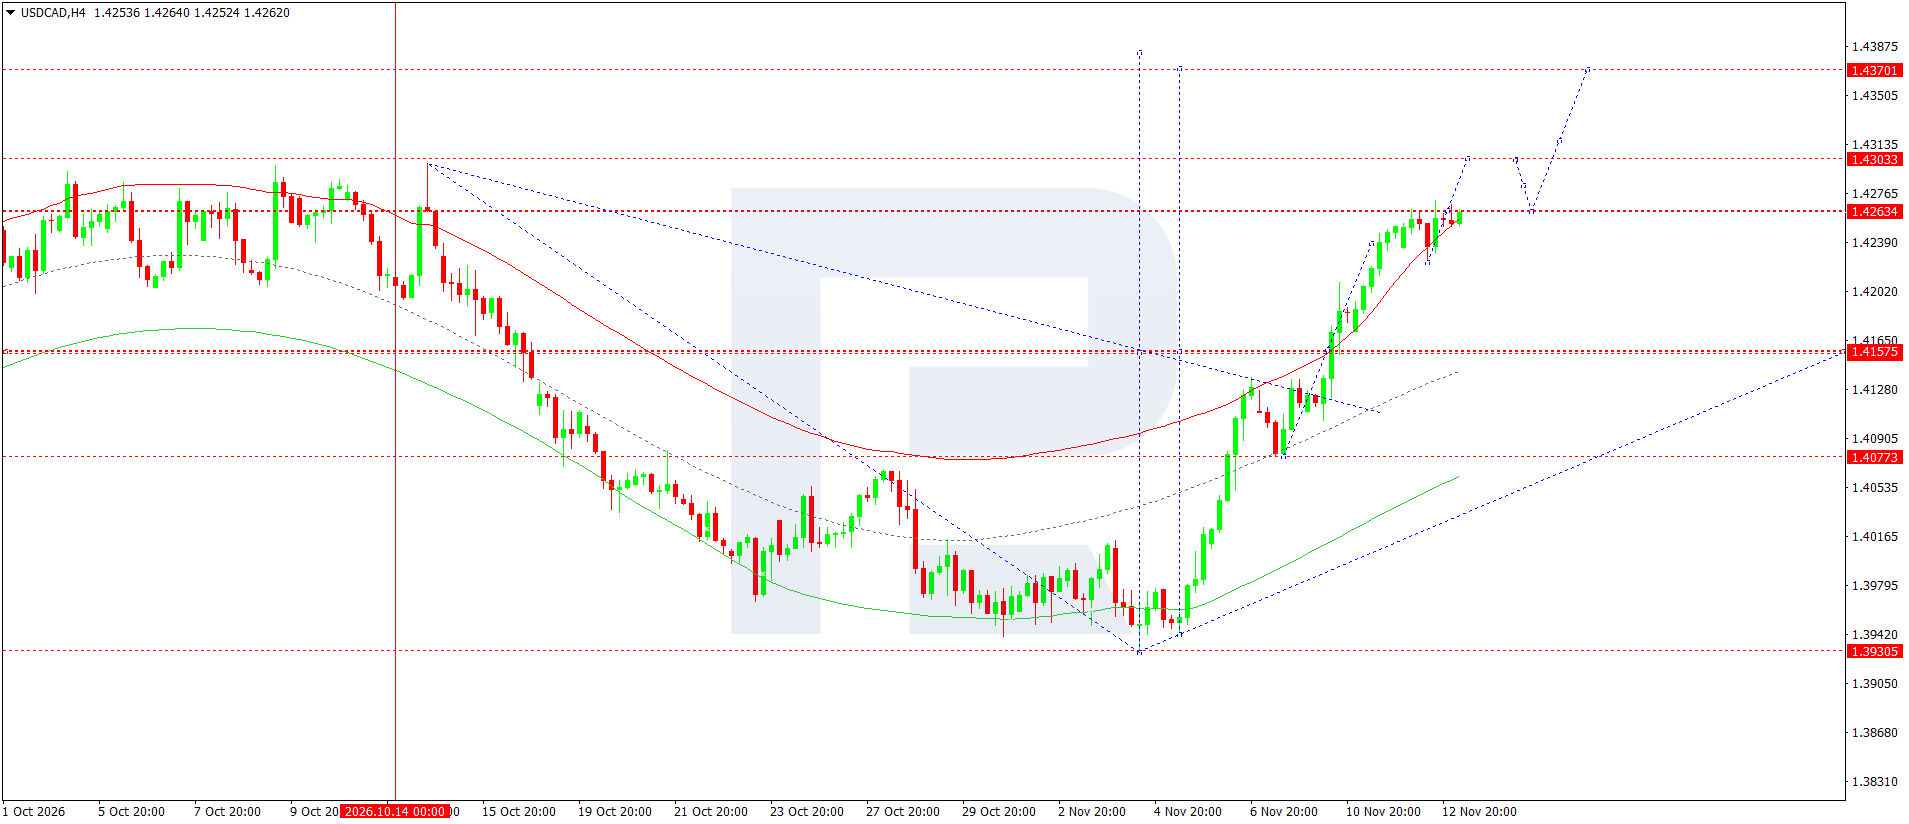
On the H4 chart, the latest price is 1.4262. An upward impulse has developed from the low around 1.3931, and the quote is above all the displayed Envelope lines. However, the market has approached resistance at 1.4263, so further gains require confirmation of buying activity. The next immediate target is at 1.4303.
Today's baseline scenario envisages consolidation below resistance followed by an attempt to break higher. After reaching 1.4303, a retest of the 1.4263 area is possible. If that level holds, the next reference will be 1.4370. Acceleration above it would extend the potential of the bullish structure, but would require further confirmation of sustained demand from buyers.
The key deeper support is around 1.4158, where a reversal area previously lay. A return there would represent a substantial extension of the correction. The wave count is consistent with the hypothesis of continued gains, with the preservation of higher lows remaining the principal condition for the current impulse to develop. Buying is considered after the nearest resistance has been overcome.
A decline below 1.4240 following such a breakout would invalidate the selected local idea and point to the risk of a false upside break. Confirmation for buying would ideally come from the broken area holding on the first retest.
USDCAD forecast scenario
XAUUSD forecast
By the morning of 13 November, rising US bond yields remain the main constraint on gold. Higher yields on interest-bearing instruments increase the opportunity cost of holding the metal. A stronger dollar further worsens the conditions for gold purchases by holders of other currencies. Persistent US inflation and discussions of further rate increases sustain this source of pressure, although the direction of real yields also depends on changes in inflation expectations.
Geopolitical uncertainty works in the opposite direction, maintaining potential demand for safe-haven assets. However, such demand does not guarantee an immediate rise in prices: when reducing risk, investors may sell liquid assets to cover losses and maintain positions. The current weakness in gold should therefore not automatically be taken to mean that its safe-haven role has disappeared. For the coming session, the balance between dollar momentum and defensive demand will be decisive. A decline in US yields could support a recovery, whereas a further rise would increase the probability of another test of the lows. Specific unverified reports of new central bank purchases are not included in the scenario.
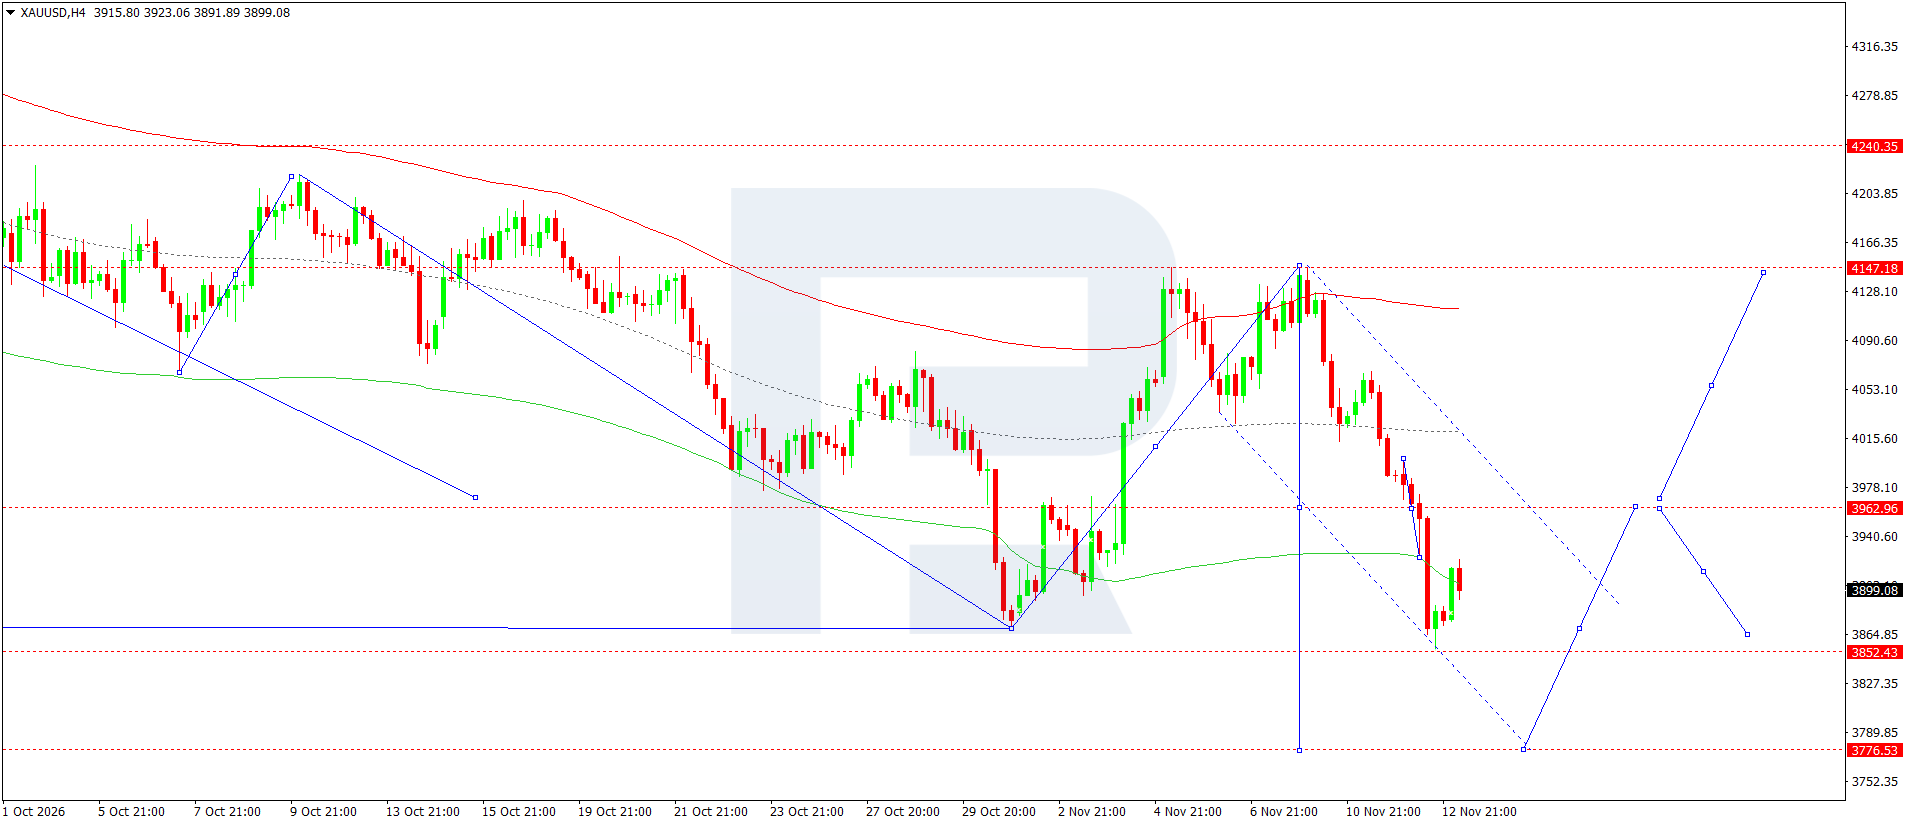
On the H4 chart, the latest price is 3,899. Following the decline from the 4,147 area, the market made new local lows near support at 3,852 and then rebounded. The quote remains below the middle line and upper boundary of the Envelope, while the recent sequence of highs slopes downwards. This preserves the bearish bias despite the possibility of a continued recovery.
The nearest corrective reference today is the 3,925 area. More significant resistance is marked around 3,963. As long as the market remains below it, the recovery is regarded as part of a downward move. Another break below 3,852 would open the potential for a decline towards 3,777. A break through that level would signal an extension of the decline beyond the range.
The blue wave markings also allow for a strong recovery after the lower target is reached, so they should not be treated as unambiguous confirmation of selling at any level. The wave interpretation retains a bearish preference until a sequence of consistently higher lows emerges. The selected scenario envisages selling when the decline resumes below current levels.
A return above 3,963 would invalidate the local bearish idea and require an assessment of the likelihood of a recovery towards higher resistance levels. Buyers' reaction when the market approaches the lows again will be particularly important.
XAUUSD forecast scenario
US 500 forecast
The US stock market enters 13 November with heightened sensitivity to the cost of capital and news from the technology sector. US indices ended the previous session lower as pressure on Nvidia outweighed support from energy companies. Uncertainty surrounding the leadership of the largest maker of AI accelerators has raised further questions about the prospects of companies linked to artificial intelligence infrastructure. This matters for the broad index because of the high concentration of market capitalisation among the largest technology issuers.
The second source of pressure is interest rates. Rising bond yields increase the discount rate applied to future earnings and make highly valued companies particularly sensitive. Expensive energy simultaneously supports the oil sector and increases costs for consumers and businesses. Gains in individual sectors can therefore cushion an index decline without necessarily changing its overall direction. For the coming day, the resilience of demand for technology shares, bond movements, and oil prices will be important. Improving sentiment could produce a rebound, but a sustained recovery would require an easing of pressure from financial conditions.
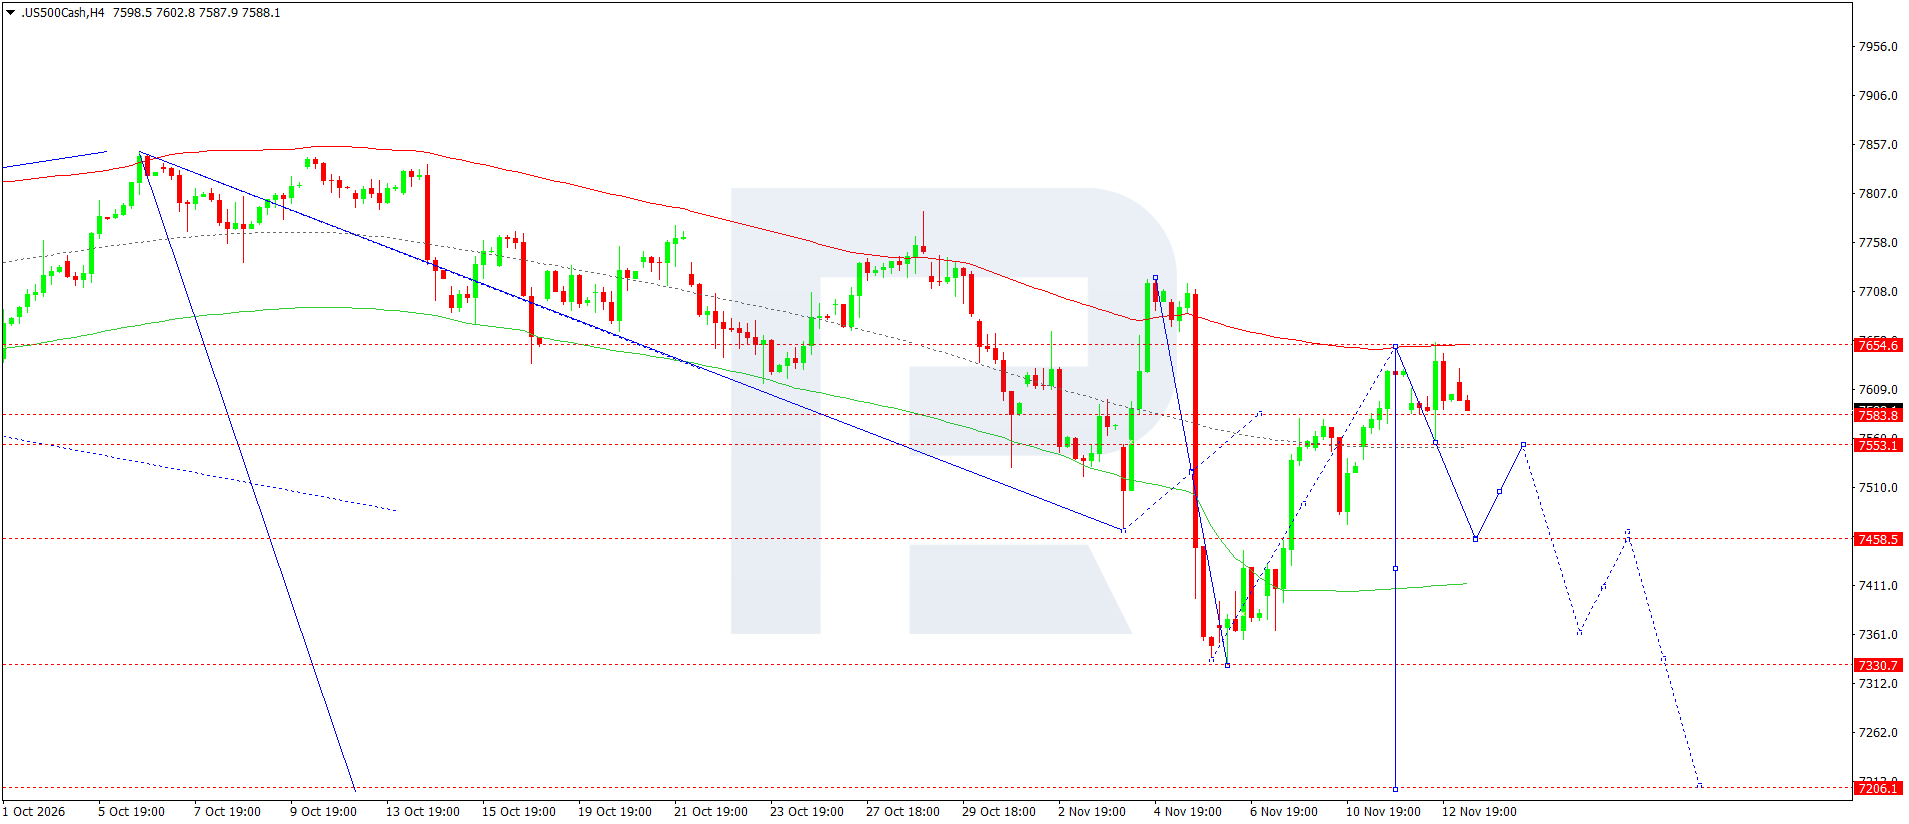
On the H4 chart provided, the latest price of the US 500 contract is 7,588. This figure refers to the broker's instrument and does not replace the official cash index level. After recovering from 7,331, the market approached the 7,655 area twice but failed to consolidate above it. The quote is now moving back towards intermediate support at 7,553.
Today's baseline scenario envisages a move below 7,584, followed by a test of 7,553. A break below this support level would create conditions for a move towards 7,459. A return to the breakout zone is possible after the target is reached. The more distant levels of 7,331 and 7,206 relate to an extension of the bearish structure and are not treated as a mandatory outcome of a single session.
The upper Envelope line around 7,655 limits the recovery, while the lower line lies considerably below the current price. This configuration allows for further fluctuations within a broad range. The blue path is a scenario projection, not a proven wave sequence. Selling is considered when a new downward impulse is confirmed. Sustained consolidation above 7,655 would invalidate the local scenario and increase the likelihood of a further recovery towards the market's previous highs. Failure to follow through after a breakout would increase the likelihood of a recovery within the range.
US 500 forecast scenario
BTCUSD forecast
Bitcoin begins 13 November under pressure from a combination of macroeconomic and market-specific factors. Stronger expectations of US rate increases make interest-bearing instruments more attractive and limit demand for assets that generate no current cash income. At the same time, deteriorating sentiment in the technology sector is spilling over into the cryptocurrency market as investors become less willing to take risks. This link is not constant, but it can become particularly apparent during periods of broad position reduction.
Reports of outflows from US spot Bitcoin exchange-traded funds remain an additional negative factor. They indicate weakening in one channel of investment demand, although they do not by themselves determine the precise scale of further price movements. Without verified statistics, each decline should not be attributed to a specific amount of liquidations or to actions by large holders. US yields, technology share performance, and the resilience of demand following fresh lows will be important in the upcoming session. A weakening of dollar momentum could trigger a sharp rebound, but fundamental conditions currently appear more likely to restrain the recovery than to support a confident return to growth.
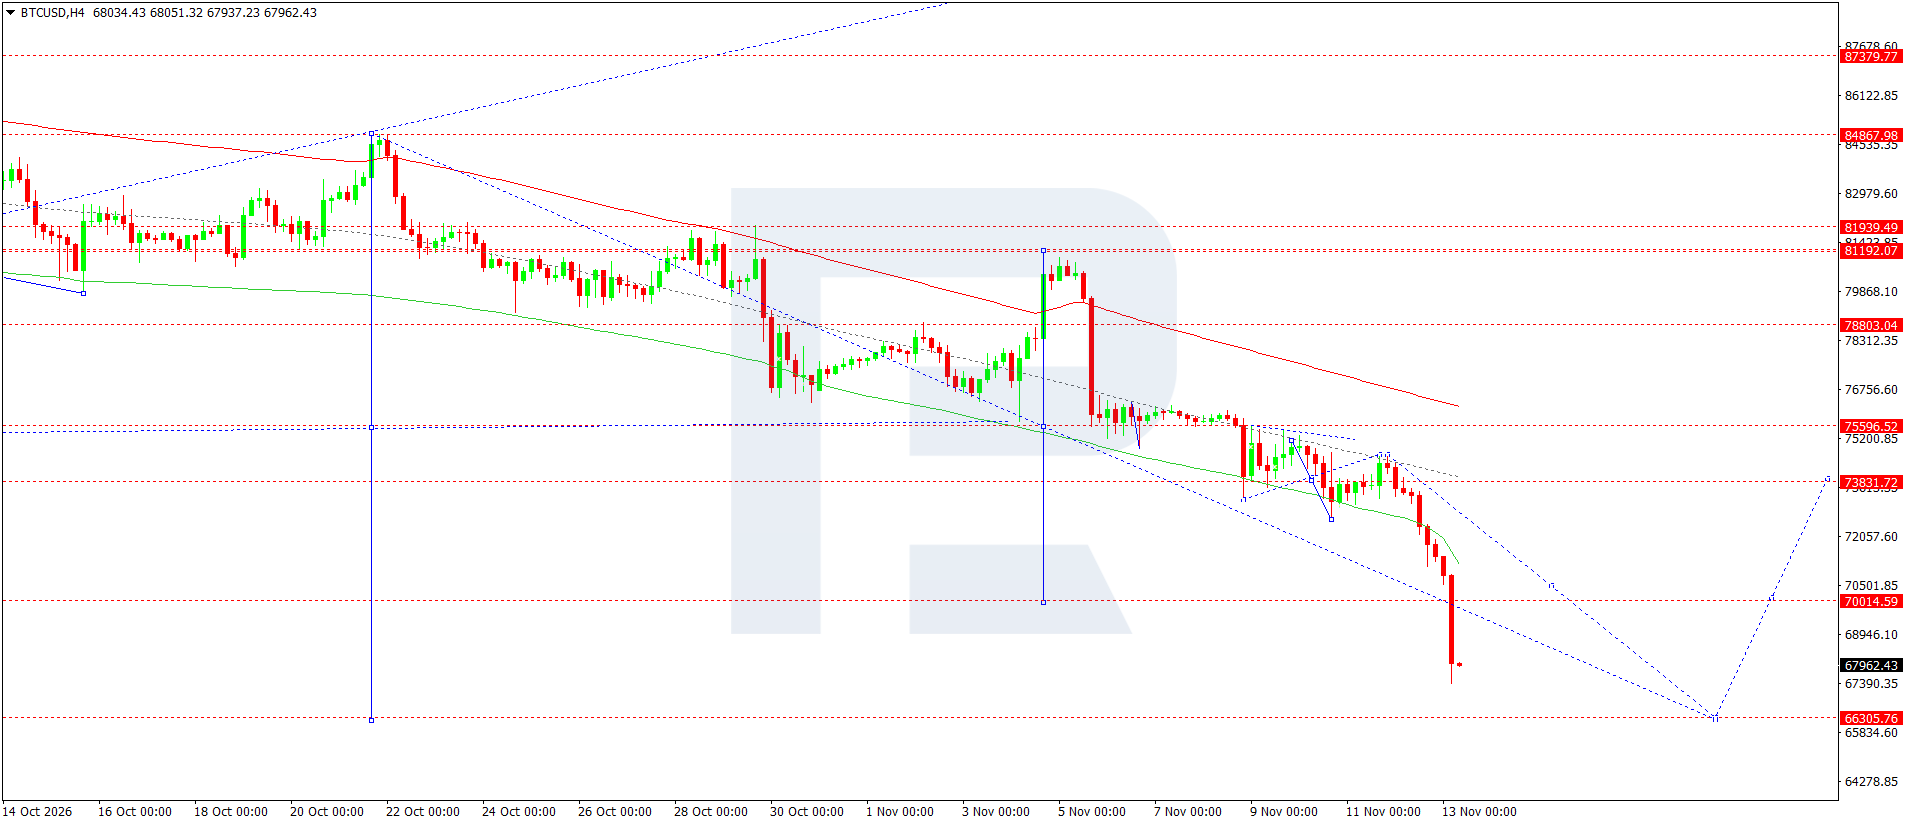
On the H4 chart, the latest price is 67,962. Following an acceleration of selling, short-term volatility remains high, making the reaction to nearby horizontal levels especially important. After breaking below 73,832 and 70,015, the market accelerated its decline, forming a large bearish impulse candle. The price is below all the Envelope lines, and the sequence of highs and lows continues to point downwards.
A brief period of stabilisation after the strong impulse is possible today. The nearest significant resistance lies around 70,015, while the main lower reference is marked at 66,306. A return to resistance will remain corrective until a confirmed reversal structure emerges. A break below 66,306 would require a reassessment of the targets on a wider chart, as the image does not show enough reliable subsequent levels.
The blue markings suggest a recovery after the support level is reached, but do not confirm that a bottom has already formed. The wave structure still shows signs of an incomplete downward impulse. The selected scenario therefore involves selling on a continued decline, with protection above the nearest resistance. A sustained recovery above 70,015 would invalidate the local idea and increase the likelihood of a deeper correction towards 73,832. The potential return on the selected trade is smaller than the risk set for it.
BTCUSD forecast scenario
Editors’ picks


EURUSD forecast 2026–2027: technical analysis, price levels & predictions
The EURUSD outlook for 2026 and 2027: key levels on the daily chart, three trading scenarios and the policy gap between the Fed and the ECB that drives the pair.

Gold (XAUUSD) forecast 2026: technical analysis, price levels & predictions
Where gold could trade in 2026: key levels, three trading scenarios with entry triggers and the forecasts from J.P. Morgan, Deutsche Bank and Goldman Sachs.
Forecasts presented in this section only reflect the author’s private opinion and should not be considered as guidance for trading. RoboForex bears no responsibility for trading results based on trading recommendations described in these analytical reviews.