
Daily technical analysis and forecast for 16 November 2026
Daily technical analysis and forecast for EURUSD, USDJPY, GBPUSD, AUDUSD, USDCAD, XAUUSD, US 500, and BTCUSD for 16 November 2026.
Each scenario on this page reflects the market structure on the H4 chart as of 10:00 AM UTC+2 on 16 November 2026. The assessment considers the current H4 chart structure, key support and resistance levels, the direction of the medium-term movement, and the prevailing fundamental backdrop.
EURUSD forecast
As of the morning of 16 November 2026, the fundamental outlook for EURUSD is shaped by interest rate differentials and persistent inflation. On 28 October, the Federal Reserve kept its policy rate within the 3.75–4.00% range, with two members voting for an increase. On 29 October, the European Central Bank left its deposit rate at 2.50%. This differential supports the relative attractiveness of dollar-denominated instruments, although it does not in itself guarantee further appreciation of the US currency.
The US consumer price index rose by 0.4% month on month in October. Persistent price pressures limit the scope for rapid monetary easing. In the eurozone, the energy shock is simultaneously increasing inflation risks and weakening growth prospects. The ECB explicitly acknowledges this combination of factors. Consequently, potential tightening of European monetary policy will not necessarily provide sustained support for the euro: market participants are also assessing lost income and higher financing costs. During the day, the response of bond yields to new information will be important. Falling US yields could trigger a recovery in the pair, while rising yields would sustain selling pressure.
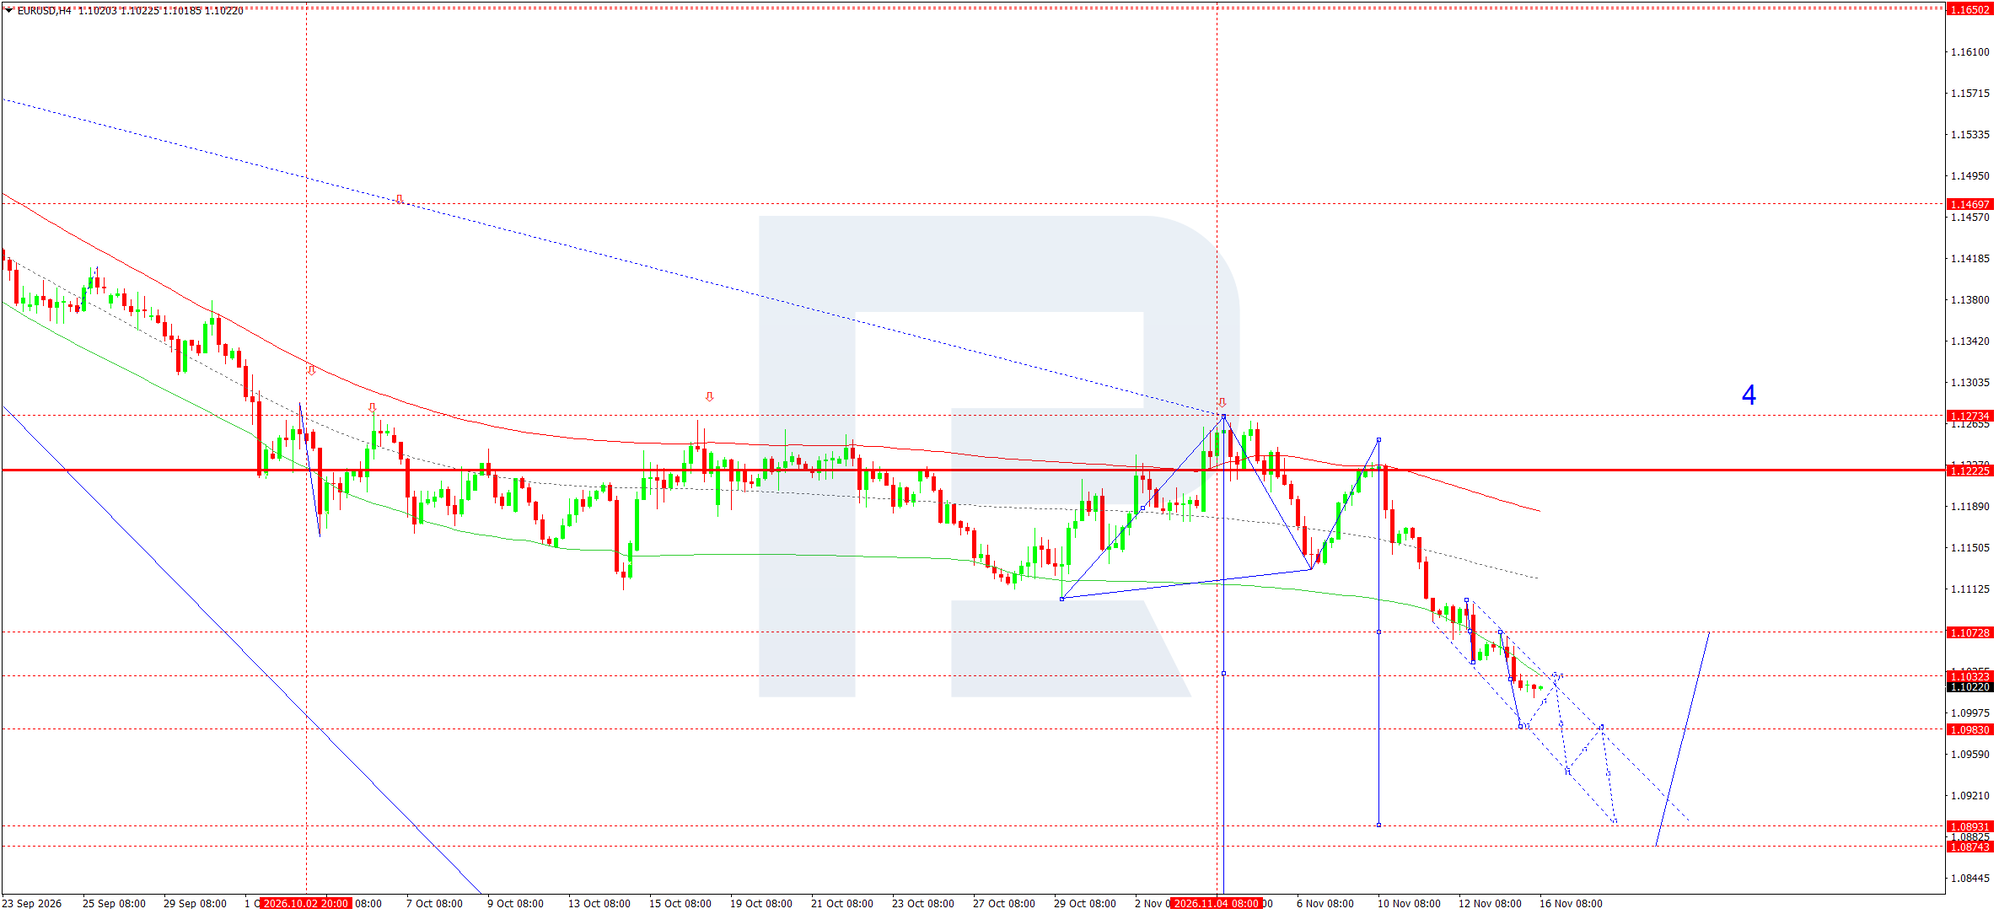
On the H4 chart, the price stands at 1.1022. A sequence of lower highs and lower lows maintains the downtrend. Quotes are below both the midline and the lower boundary of the illustrated Envelope, reflecting strong momentum while also increasing the likelihood of a technical rebound. The nearest resistance is at 1.1032, with the next significant area around 1.1073.
The main scenario for 16 November anticipates a move towards support at 1.0983. A breakout below this level, followed by sustained trading beneath it, would open the way towards 1.0893 and 1.0874. These more distant targets relate to the developing wave and are not necessarily expected to be reached in a single session.
Selling may be considered on a move below 1.1017, with the nearest target at 1.0983. A return above 1.1032 would weaken the local momentum, while consolidation above 1.1073 would require a reassessment of the daily scenario. The wave count allows for further decline but does not generate a standalone signal without price confirmation. An entry decision depends on an actual breakout, since merely touching the level without follow-through may be part of ordinary intraday consolidation.
EURUSD forecast scenario
USDJPY forecast
The fundamental backdrop for USDJPY on the morning of 16 November is linked to an unexpected weakening of the Japanese economy. The preliminary estimate showed that real GDP contracted by 0.1% year on year in the third quarter. This was the first decline in four quarters, whereas a Jiji survey had suggested slight growth. Weak output complicates further rate increases by the Bank of Japan and may limit yen appreciation.
At the same time, the US policy rate remains higher than Japan's, while persistent inflationary pressure supports the Fed's cautious approach. What matters for the pair is not only the current interest rate differential but also changing expectations for forthcoming decisions. Dovish BoJ comments combined with resilient US bond yields would favour dollar buyers. More hawkish signals from the Japanese regulator could shift the balance towards the yen.
Another factor is the exchange rate's proximity to the psychological 160.00 area. Morning press reports point to the market's focus on the risk of intervention by the Japanese authorities. This increases the likelihood of sharp moves against the uptrend. The pair's advance therefore needs confirmation through support holding, particularly after the strong momentum of previous days. A deterioration in global sentiment could also increase demand for the yen and trigger a correction.
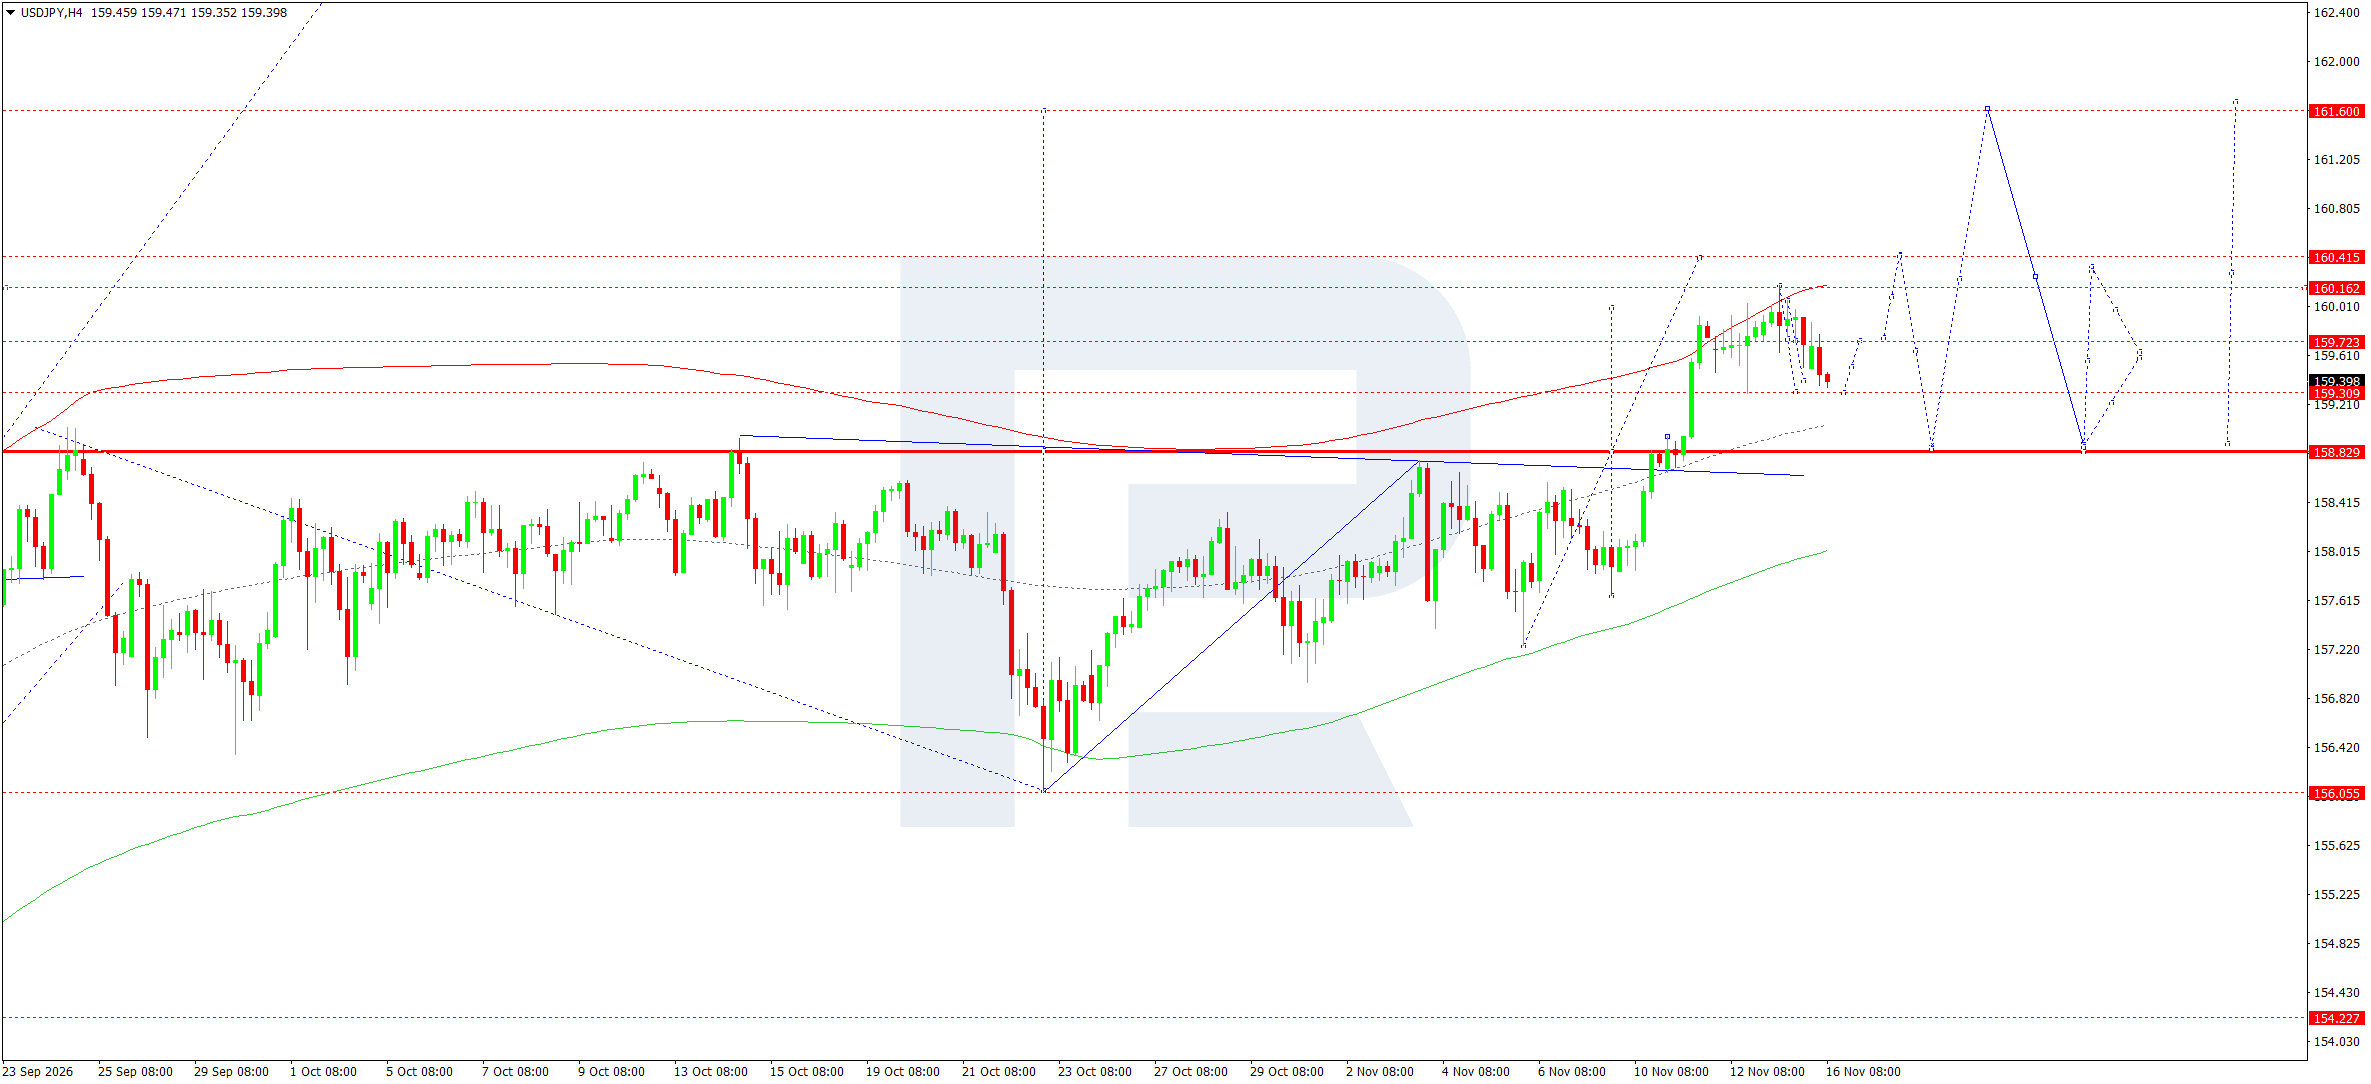
On the H4 chart, the latest price is 159.40. A pullback formed after the rise towards 160.16, but the pattern of higher lows remains intact for now. The nearest support is at 159.30, while the key base of the previous breakout is at 158.83. Resistance levels are located at 159.72, 160.16, and 160.42.
The baseline scenario for 16 November envisages a test of the 159.30 level followed by a recovery if demand emerges. A return above 159.72 would bring 160.16 back into focus. Only consolidation above that area would improve the prospects of a move towards 160.42 and then 161.60. The latter is an extended wave target.
Buying on a recovery through 159.45 relies on the nearest support holding. The stop loss is positioned below 159.30, as losing this level would worsen the conditions for further growth. A drop below 158.83 would invalidate the current bullish structure and increase the likelihood of a deeper correction.
USDJPY forecast scenario
GBPUSD forecast
On the morning of 16 November, the fundamental picture for GBPUSD combines support from UK interest rates with pressure from a strong dollar. On 5 November, the Bank of England raised its rate by 0.25 percentage points to 4.00%. Eight members voted for the decision, while one preferred a larger increase. UK inflation stood at 3.5% in September, and the regulator expects it to accelerate further due to energy costs.
The rate increase makes sterling relatively more attractive, but also increases the burden on lending and domestic demand. The BoE emphasises uncertainty about the second-round effects of the energy shock on wages and other prices. The market is therefore assessing not only the likelihood of the next increase but also the economy's capacity to withstand more expensive financing. This combination prevents a clear-cut fundamental signal for the British currency.
On the US side, persistent inflation and the Fed's cautious stance remain influential. As long as US yields remain high, sterling recoveries may encounter selling pressure. Falling yields or an improvement in global risk appetite, by contrast, would create conditions for a corrective rise. During the day, it is preferable to monitor the pair's response to resistance levels: a failure to extend gains after positive news would confirm buyers' weakness.
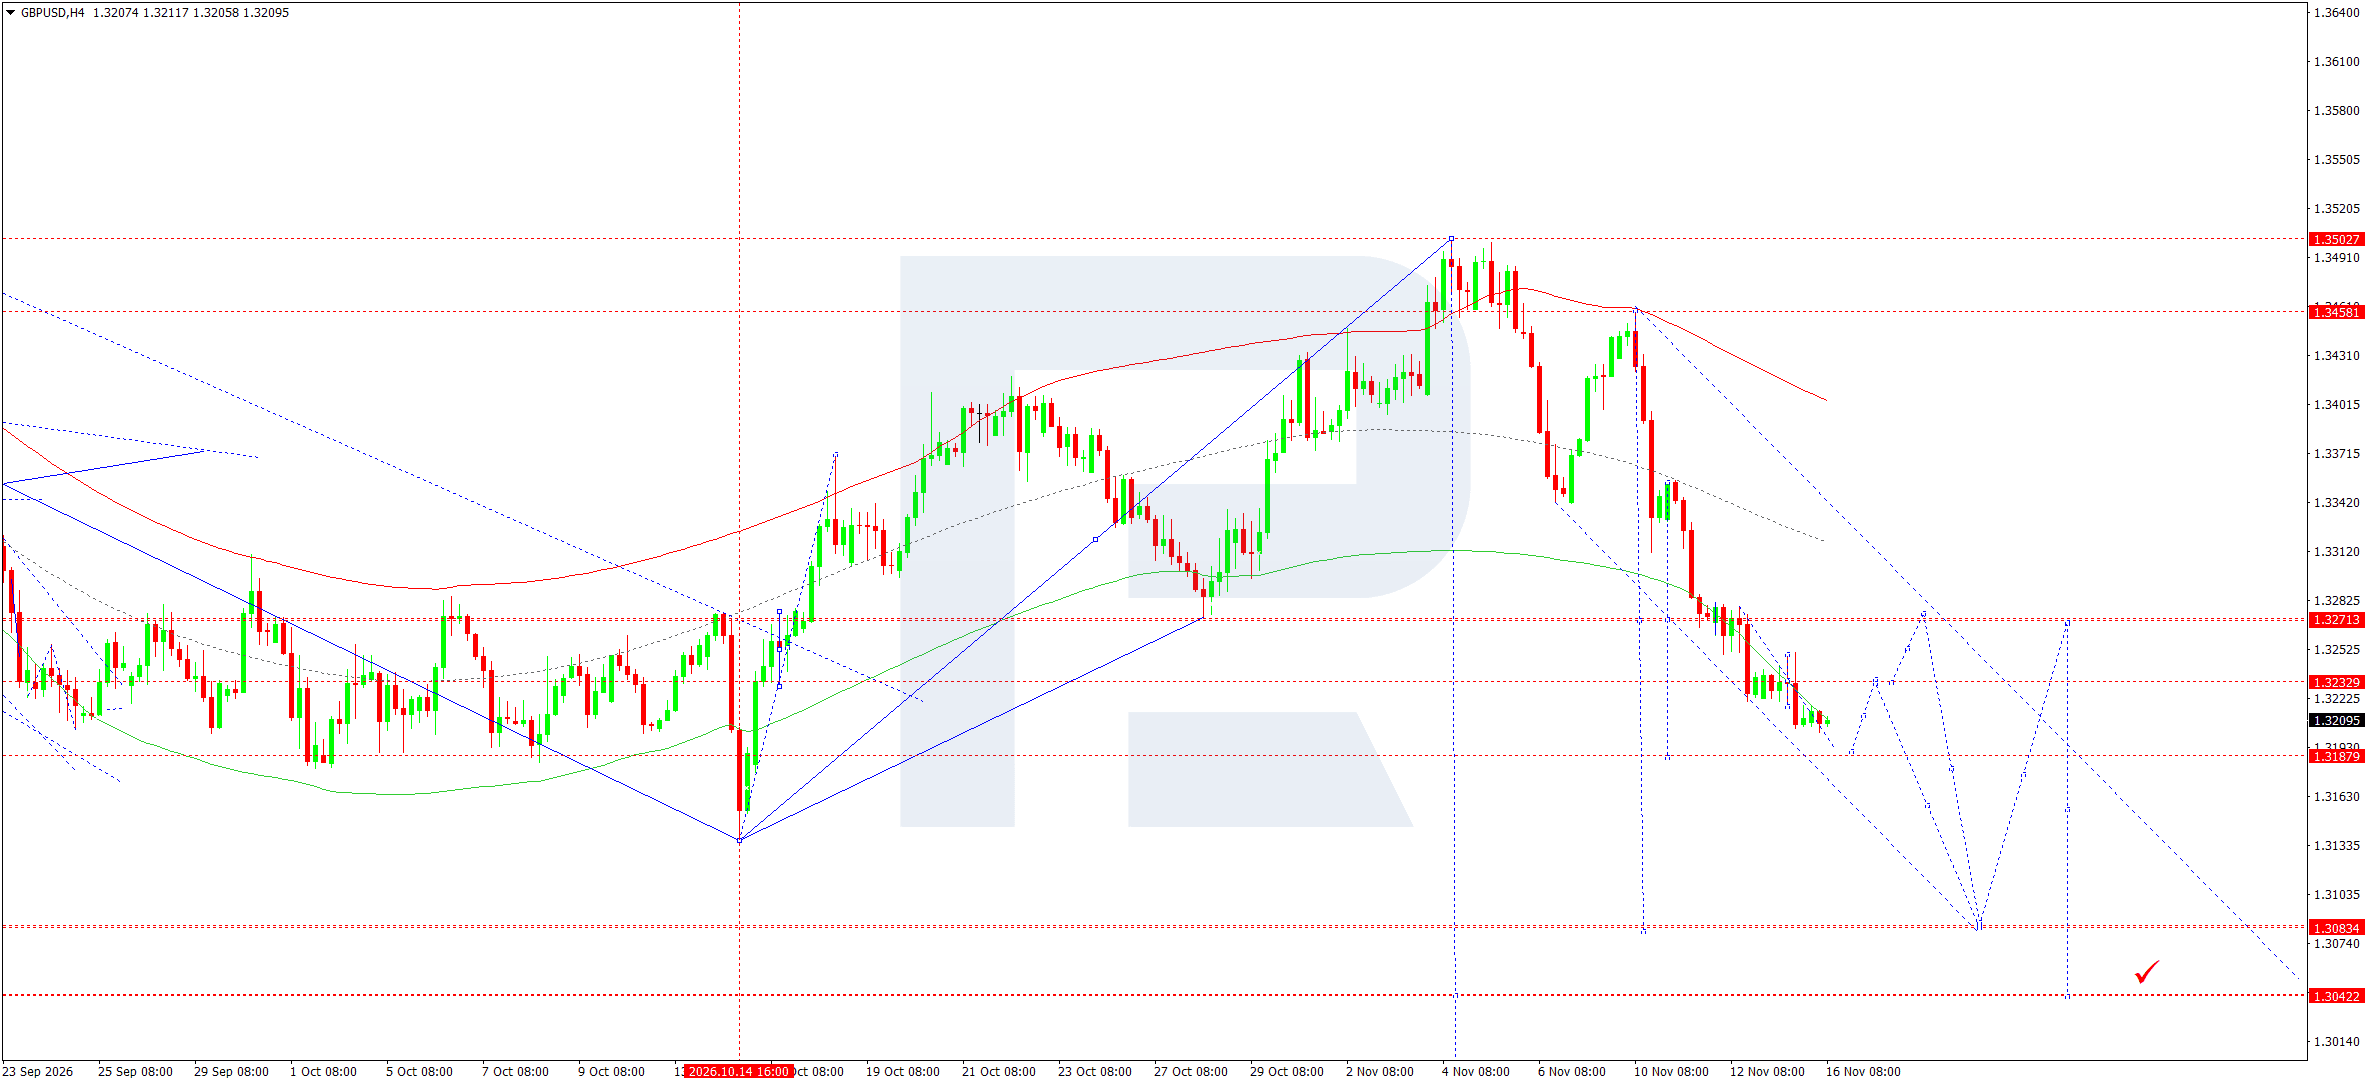
On the H4 chart, the latest price is near 1.3210. A series of lower highs has formed following the reversal from 1.3503. Quotes remain below the Envelope's midline, while its boundaries slope downwards. The nearest support is at 1.3188. Resistance levels are at 1.3233 and 1.3271.
The main scenario anticipates a test of the 1.3188 level. A rebound towards 1.3233 is possible after this mark is reached, where the resilience of selling pressure will need to be assessed. A break below support and consolidation beneath it would open the way towards 1.3083. A more distant target is at 1.3042 and relates to the development of the downward wave beyond the move necessarily expected during the day.
Selling on a move through 1.3205 suggests that the current momentum will continue. A stop loss above 1.3233 limits the risk from a corrective recovery. The stated take-profit level is designed for an extended move following a break below 1.3188, so reaching the target today is not guaranteed. Consolidation above 1.3271 would disrupt the local bearish structure and require the priority given to selling to be reconsidered. Further consolidation is possible before the nearest support level is broken, so the pace of any move towards the distant target cannot be determined in advance.
GBPUSD forecast scenario
AUDUSD forecast
The fundamental assessment of AUDUSD for 16 November reflects a combination of restrictive Australian monetary policy and investors' cautious attitude towards risk. On 3 November, the Reserve Bank of Australia raised its rate by 0.25 percentage points to 4.85%. The regulator pointed to widespread inflationary pressures and revised its price forecast upwards. Inflation is now expected to return to the upper boundary of the target range only by the end of 2027.
A high interest rate can support the Australian dollar through asset yields. However, the RBA also notes weak productivity and uncertainty surrounding the consequences of the housing market downturn. Energy and other commodity costs are adding to difficulties for businesses. A rate increase therefore cannot automatically be interpreted as sufficient grounds for sustained currency appreciation.
Externally, the outlook for Chinese demand and global capital flows is important. When risk appetite declines, the Australian dollar is generally vulnerable even if domestic interest rates look attractive. US dollar resilience further limits AUDUSD's recovery. Falling US yields and improving sentiment in equity markets could provide conditions for a rebound. Until these factors coincide, the fundamentals are more consistent with corrections within the continuing downward movement.
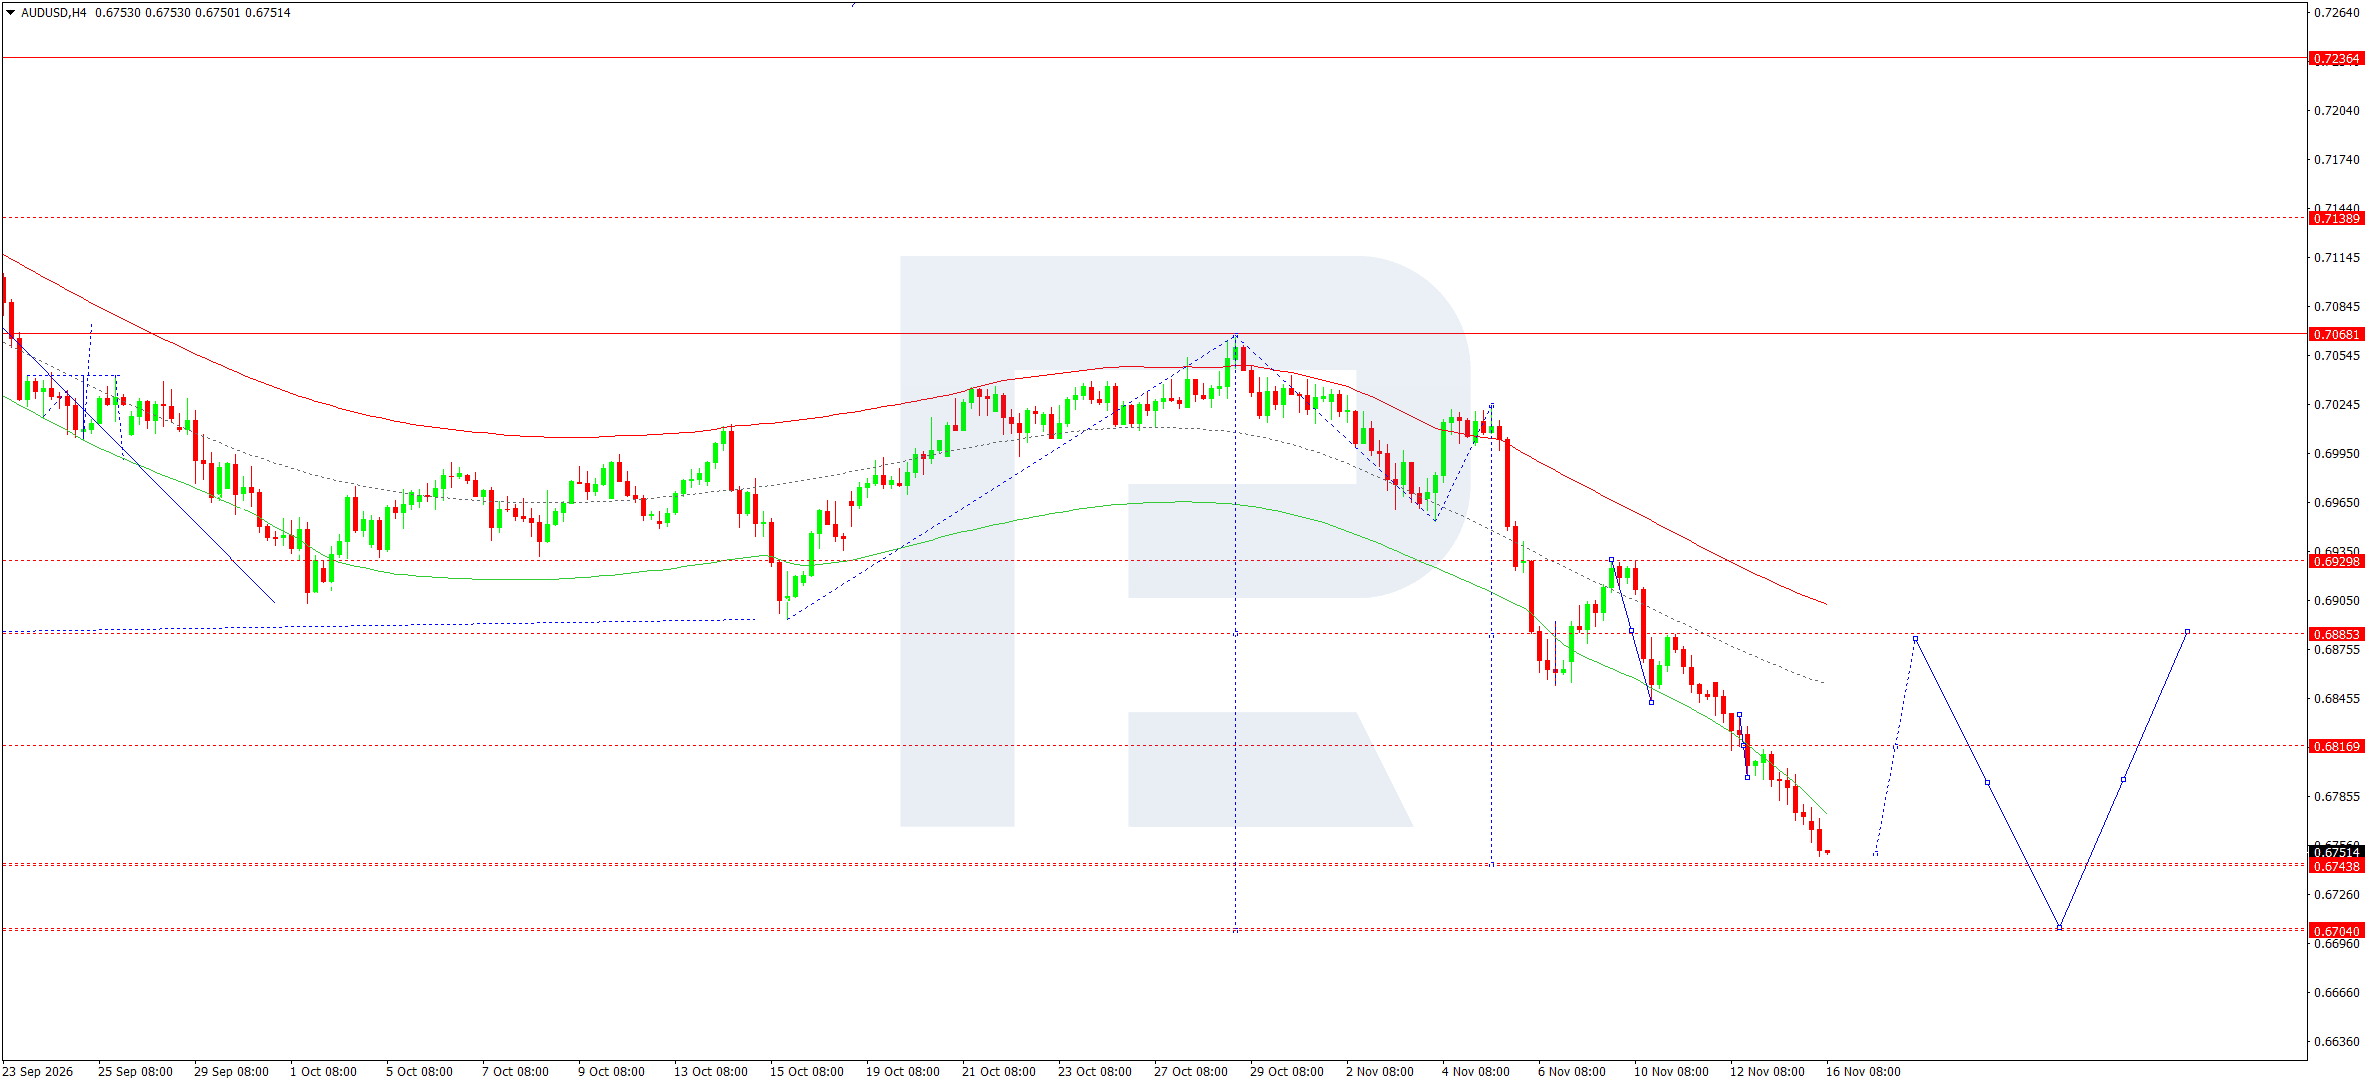
On the H4 chart, the price is standing at 0.6751. The market continues to post lower lows and is trading below the descending Envelope. The nearest support is at 0.6744, with the next at 0.6704. The 0.6817 and 0.6885 levels act as resistance. These are the values shown in the chart labels and refine the rounded levels in the original description.
The baseline scenario for 16 November remains a test of the 0.6744 level. If this area holds, a correction towards 0.6817 is possible, although the rebound alone would not change the trend's direction. A breakout and consolidation below the support level would make a further decline towards 0.6704 likely. A return above 0.6817 would ease selling pressure and increase the likelihood of broader consolidation.
Selling on a move through 0.6746 suggests renewed momentum after a local pause. A stop loss at 0.6770 limits the risk of a short-term recovery. A decisive break below the nearest support is needed to reach the target. If the price establishes a sustained reversal upwards, the scenario will need to be invalidated until the bearish structure is confirmed again. The price remaining below resistance after a rebound would support the view that sellers retain the advantage today.
AUDUSD forecast scenario
USDCAD forecast
For USDCAD, the key event on 16 November will be the release of Canada's October inflation data. The official calendar confirms that the figures are due today, so their outcome should not yet be included in the morning assessment. Higher inflation could strengthen expectations of tighter Canadian monetary policy and support the national currency. Weaker figures, by contrast, could restore the advantage to US dollar buyers.
On 28 October, the Bank of Canada raised its rate by 0.25 percentage points to 2.50%. Its accompanying statement noted resilient global activity amid elevated energy prices. This creates a mixed backdrop for the Canadian dollar. High oil prices improve export revenues but also raise inflation and household costs. The exchange rate's reaction depends on which of these channels dominates at a given moment.
The US policy rate remains higher than Canada's, continuing to support dollar-denominated investments. At the same time, a substantial rise in USDCAD ahead of a major release increases the likelihood of profit-taking. The fundamentals therefore allow for a corrective decline within the pair's bullish structure. Assessing the resilience of such a pullback will require monitoring oil prices, bond yields, and the contents of the inflation report together. Anticipation of the data alone does not provide a directional signal.
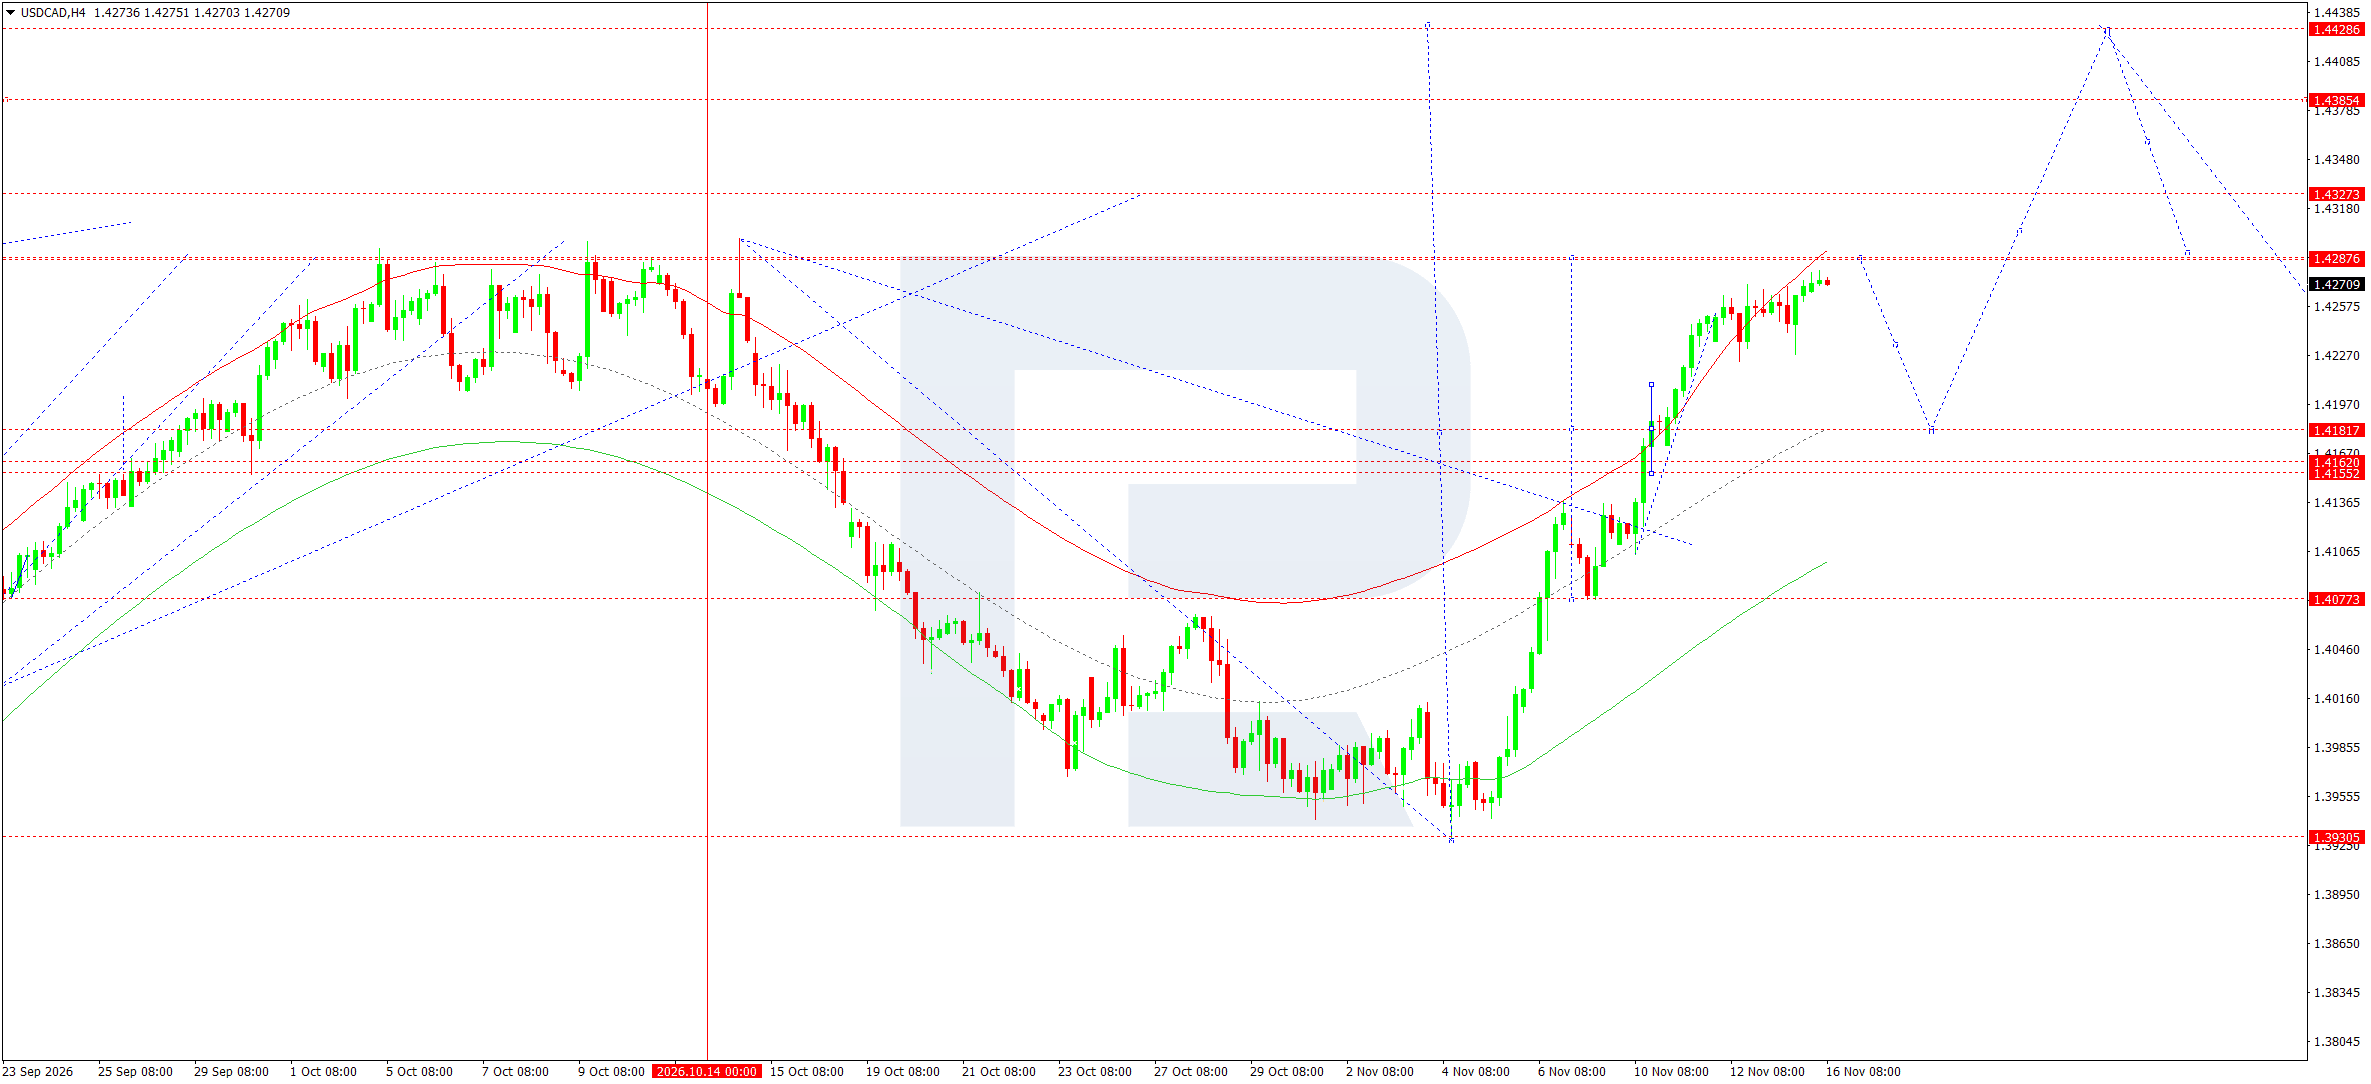
On the H4 chart, the latest price is 1.4271. After reversing from 1.3931, the market formed a pronounced upward wave and approached resistance at 1.4288. The price is near the upper boundary of the Envelope, increasing the likelihood of a pause. The next resistance levels are at 1.4327, 1.4385, and 1.4429.
For 16 November, the outlook suggests consolidation below 1.4288, with a possible corrective decline. The nearest significant pullback target is 1.4182, followed by the 1.4162–1.4155 area. If these support levels hold, the prospects for a subsequent resumption of growth will remain intact. Conversely, consolidation above 1.4288 would open the way towards 1.4327 without requiring a deep pullback.
The selected SELL scenario is corrective. Selling on a move through 1.4266 requires confirmation that the near-term upward momentum is weakening, while a stop loss above 1.4288 limits the risk of the trend continuing. The 1.4182 target corresponds to the indicated support. If the price breaks upwards out of consolidation, selling will lose priority, as the overall uptrend remains intact. Ahead of the inflation release, there is an increased likelihood of a sharp expansion in the trading range, which is important for the chosen corrective direction.
USDCAD forecast scenario
XAUUSD forecast
As of the morning of 16 November, gold remains sensitive to the dollar and interest rate expectations. A morning Reuters report links pressure on the metal to the strengthening US currency and hawkish signals from Fed officials. Market participants are awaiting further indications about the future path of rates. Rising yields on dollar-denominated instruments increase the opportunity cost of holding gold, which does not generate interest income.
Persistent inflation creates mixed conditions for the metal. On the one hand, it supports interest in preserving purchasing power. On the other hand, the prospect of tighter monetary policy can strengthen the dollar and limit demand for gold. The direction of the move therefore depends primarily on the response of real yields rather than simply on the fact that consumer prices are rising.
Geopolitical tensions sustain potential demand for safe-haven assets but do not rule out selling when leverage is reduced and participants need liquidity. For intraday analysis, dollar resilience and gold's ability to move back above broken levels are important. A weaker US currency would create conditions for a rebound. Further dollar appreciation alongside high yields would support the current bearish scenario. However, there is insufficient reason to regard every rise as the beginning of a new uptrend.
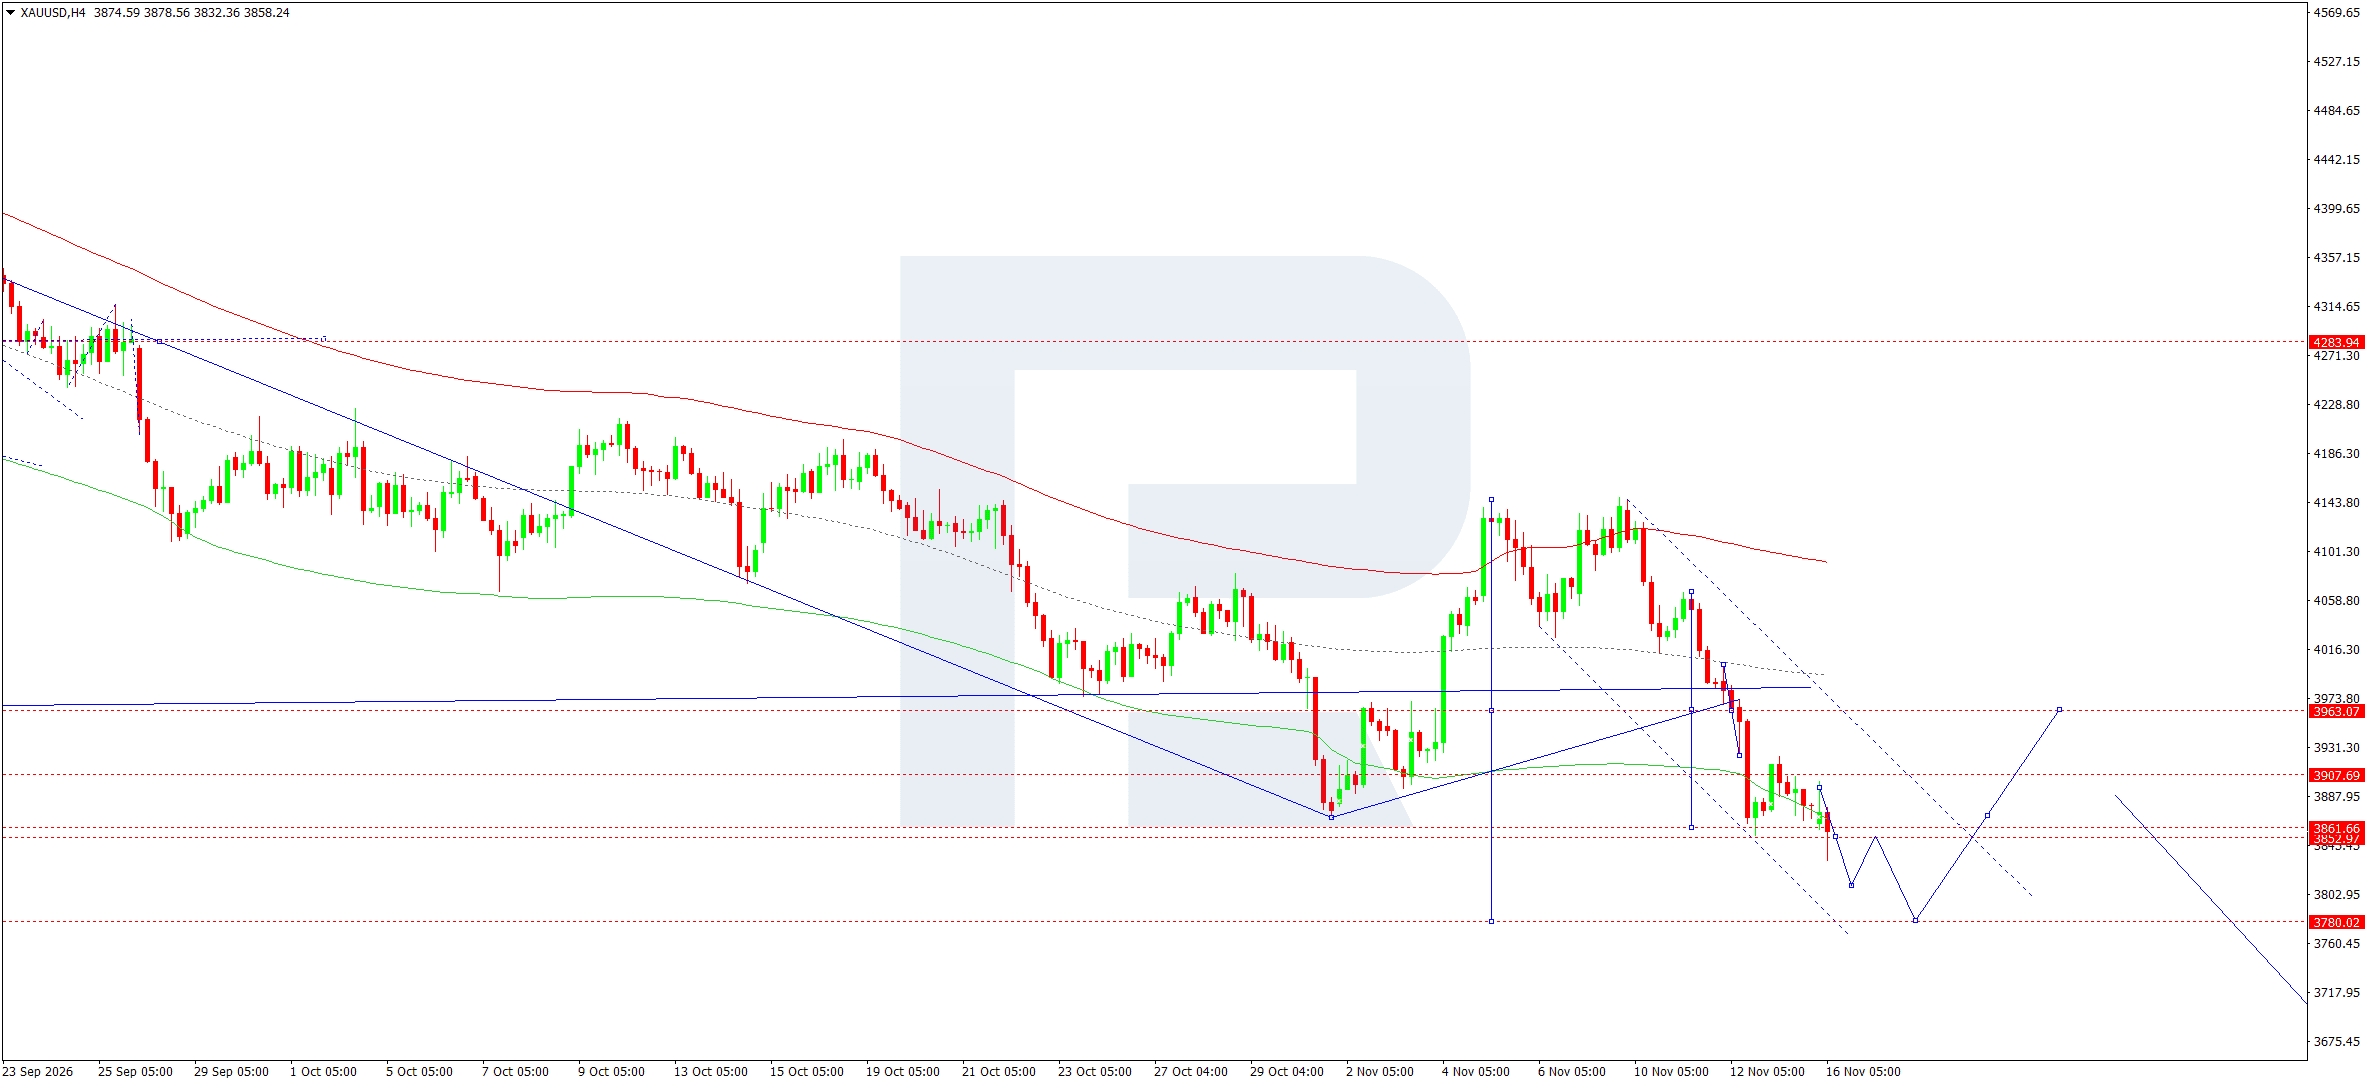
On the H4 chart, the latest price is 3,858. The market broke through the 3,963 area and recorded a new local low near 3,832. The sequence of lower highs and lower lows continues. Quotes are below the Envelope's midline, and its direction confirms the dominance of downward momentum.
The nearest area of interaction between supply and demand lies between 3,853 and 3,862. Consolidation below 3,853 would make a further decline through the 3,832 area towards 3,780 likely. An interim rebound to 3,853 after a new low would be regarded as a retest of the broken area from below. Higher resistance levels are at 3,908 and 3,963.
The main scenario for 16 November envisages selling on a move through 3,853, targeting 3,780. A stop loss at 3,885 is placed above the nearest fluctuations and limits recovery risk. A return above 3,908 would weaken the bearish scenario, while consolidation above 3,963 would require its reassessment. The 3,770 target from the original description remains an additional projection. Its relevance will depend on market behaviour after the main support is reached.
XAUUSD forecast scenario
US 500 forecast
The fundamental backdrop for the US 500 on the morning of 16 November is marked by investor caution towards the technology sector. Asian equity markets are under pressure during the session, while market participants are watching developments surrounding NVIDIA ahead of its expected earnings report. The heavy weighting of the largest technology companies in US indices amplifies the effect of such events on overall risk appetite.
Another significant factor is the cost of capital. October's 0.4% month-on-month rise in US consumer prices keeps attention focused on the risk of monetary policy remaining restrictive. High bond yields increase the discount rate applied to future profits and reduce the attractiveness of expensive equities. Companies whose valuations depend heavily on expected results in future years remain particularly sensitive.
At the same time, resilient US economic activity supports corporate revenues, so the fundamental picture does not necessarily imply an uninterrupted decline in the index. Falling yields and convincing corporate forecasts could trigger a recovery. For the current session, the reaction of futures and individual major issuers to news is more important than assuming that all sectors will behave identically. Index movements before the main US session opens may occur under different liquidity conditions, requiring breakouts to be confirmed after trading activity increases.
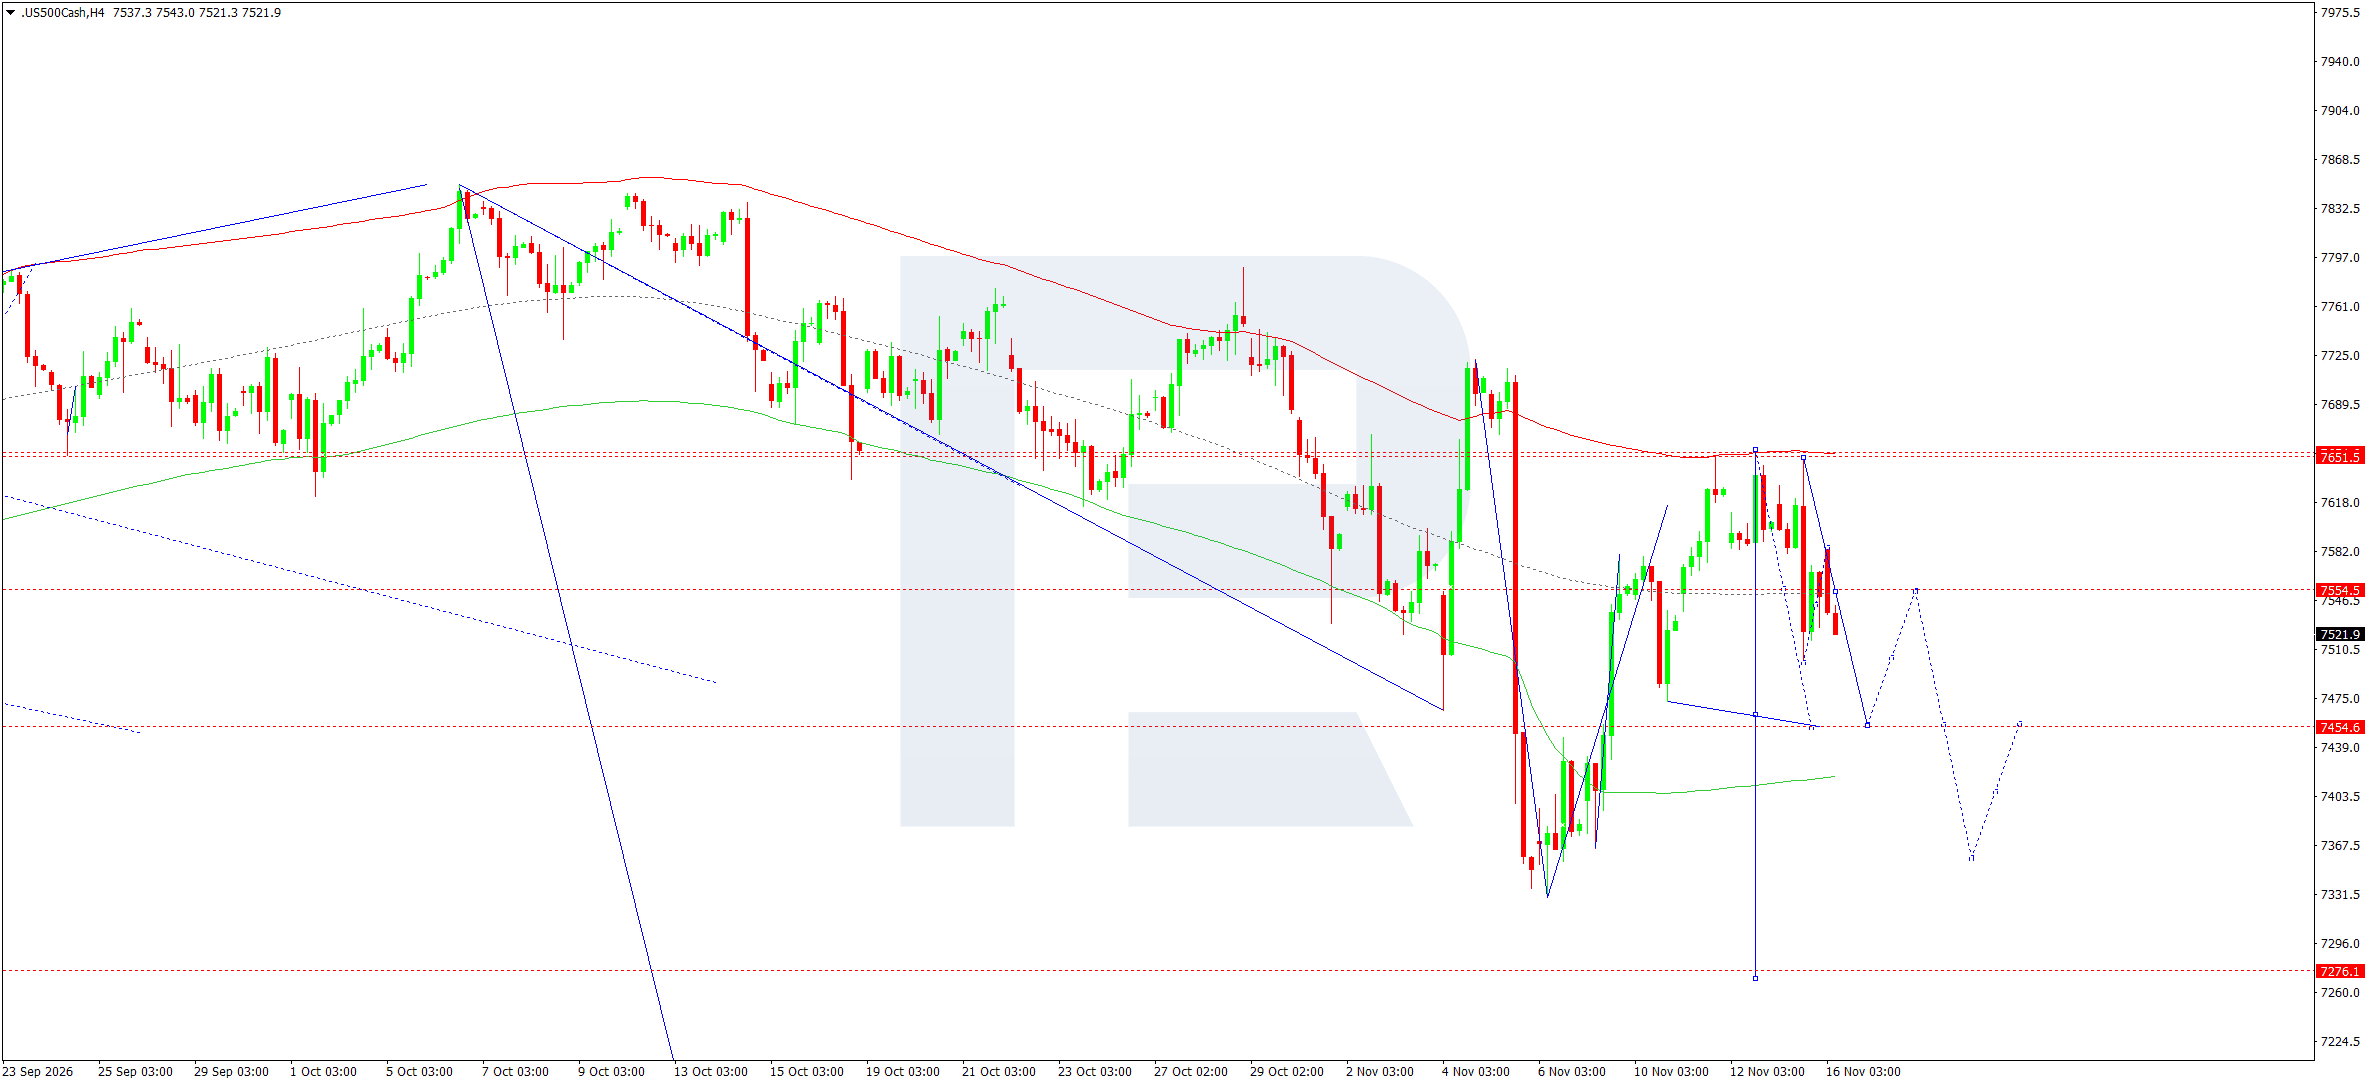
On the H4 chart, the latest US 500 contract price is 7,522. After recovering from the 7,332 area, the market encountered resistance near 7,652 and declined again. The nearest supply level is at 7,555. Support is at 7,455, with the previous low area and 7,276 level below it.
The main scenario for 16 November anticipates a further decline towards 7,455. Before that, a return to 7,555 is possible; if the price fails to consolidate above this level, selling pressure will persist. A break below 7,455 would open the way for a retest of the 7,360–7,332 area. The distant target at 7,276 would become relevant only if a stronger downward wave develops.
Selling on a move through 7,517 targets the nearest support at 7,455. A stop loss at 7,559 is positioned above local resistance. Consolidation above 7,555 would weaken the immediate bearish scenario and increase the likelihood of a recovery towards 7,652.
US 500 forecast scenario
BTCUSD forecast
The fundamental assessment of BTCUSD for 16 November takes into account investors' generally reduced willingness to take risks and cryptocurrencies' continued sensitivity to dollar liquidity. Morning market reports note Bitcoin's sharp preceding decline and an attempt to stabilise after a move towards the 62,000 area. This suggests a recovery scenario but does not confirm that the downtrend has ended.
High dollar interest rates increase the appeal of interest-bearing instruments and limit demand for speculative assets. Meanwhile, tensions in the technology sector can affect cryptocurrencies through changes in overall sentiment. This relationship is not constant, so a decline in equities cannot automatically be interpreted as an inevitable fall in Bitcoin. The actual price reaction and buyers' ability to defend established supports matter more.
After a sharp move, the likelihood of short-covering and a technical rebound increases. However, without verified data on current exchange-traded fund flows and liquidations, the recovery cannot be attributed to any specific source of demand. For the next session, a weaker dollar, stabilising equity markets, and a return above the nearest resistance would favour an advance. Continued pressure on risk assets, by contrast, would increase the likelihood of a retest of the low.
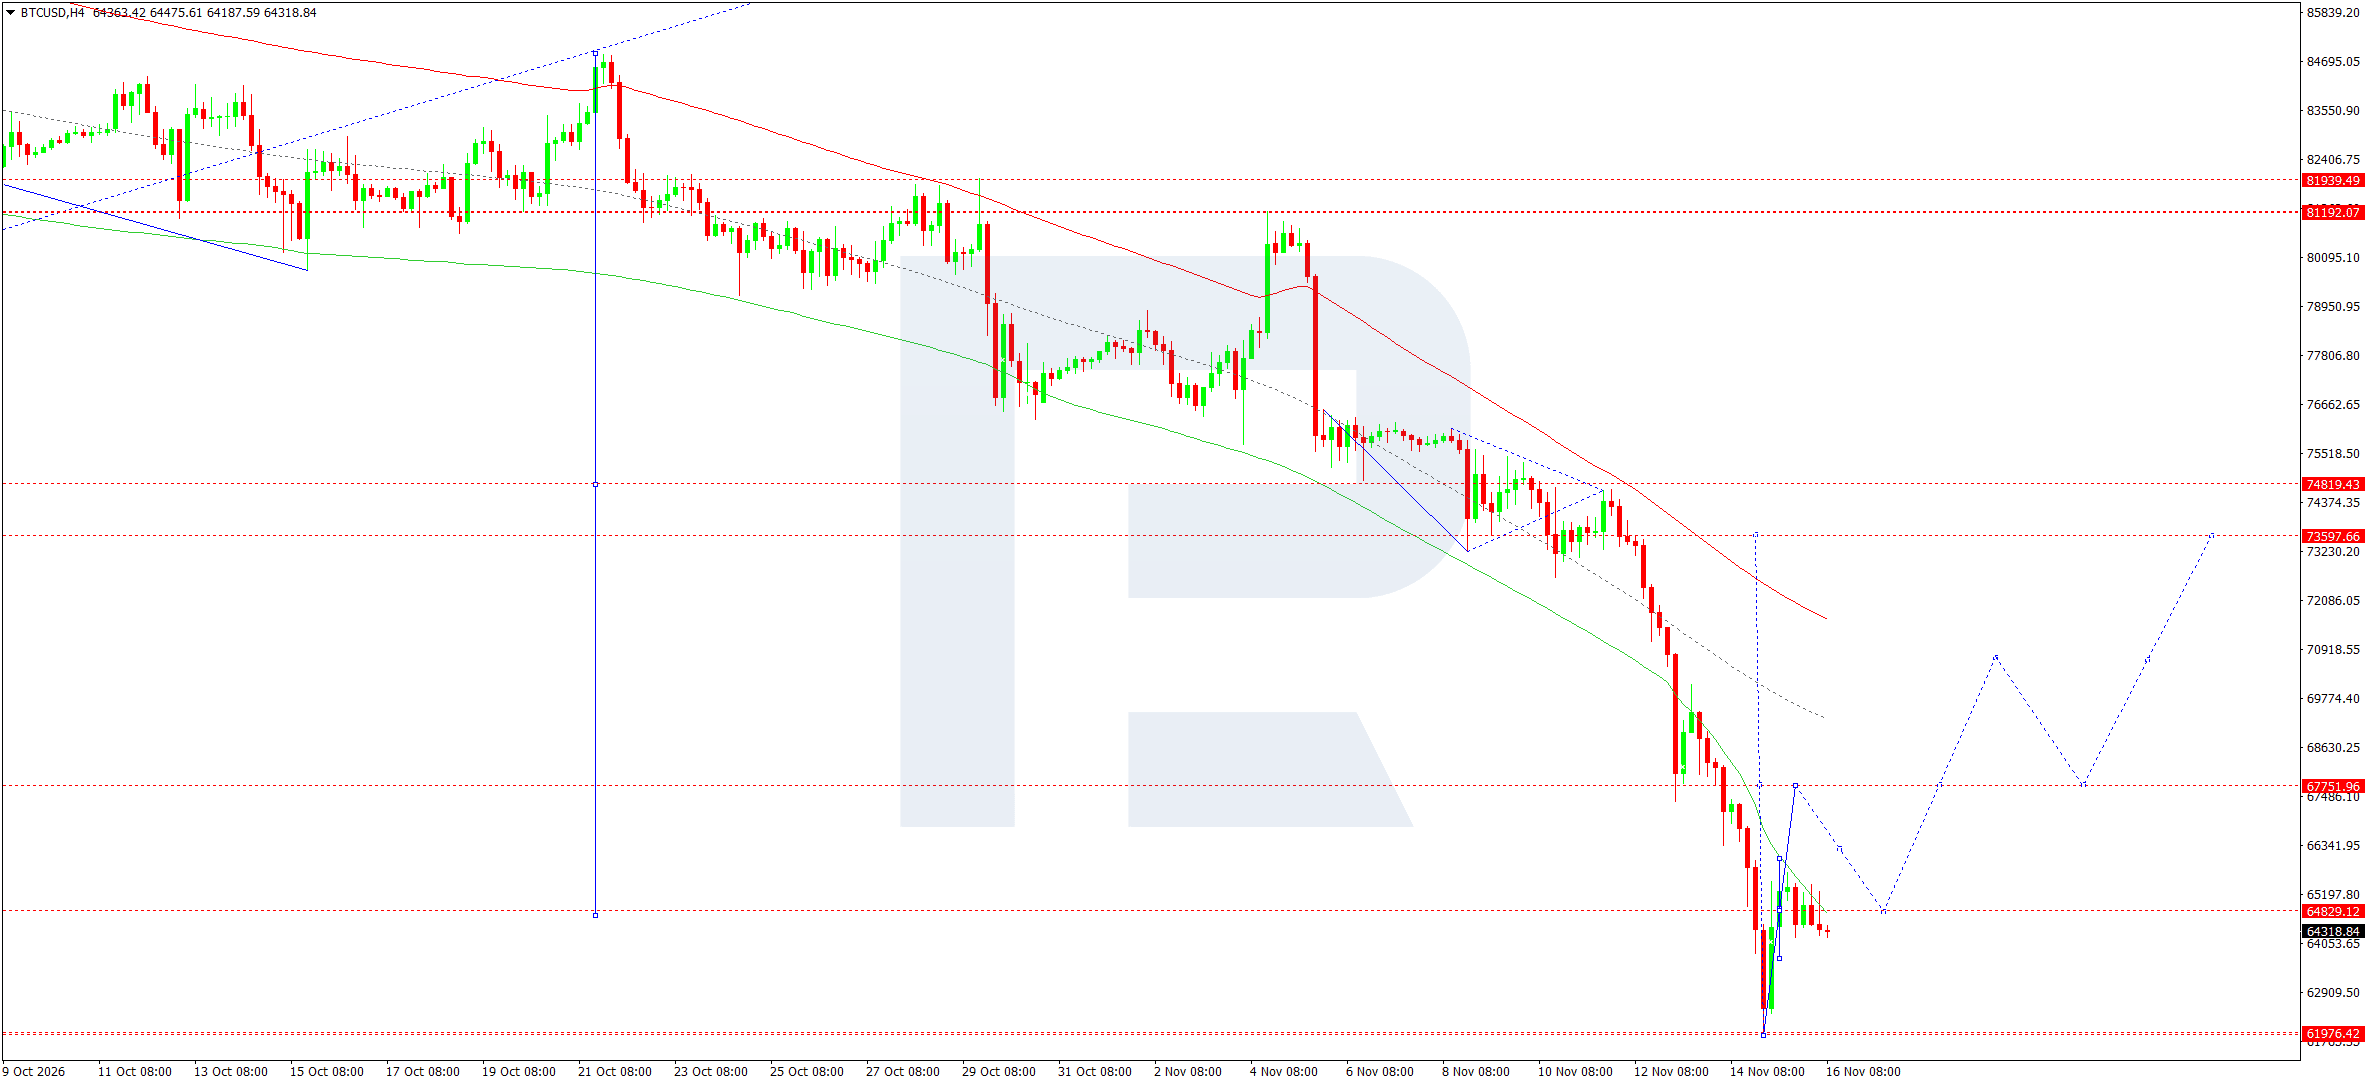
On the H4 chart, the latest price is 64,319. The market previously reached 61,976, then rebounded and entered local consolidation. The Envelope's midline and both boundaries slope downwards. The proposed purchase is therefore a correction within the main bearish trend.
The nearest resistance level is located at 64,829, with the next recovery target at 67,752. Higher up are the 70,900 area and the 73,598 level. The baseline scenario for 16 November suggests a recovery towards 67,752 only after a convincing return above 64,829. A subsequent pullback to the broken level would help assess the resilience of demand. The distant targets require separate confirmation and are not mandatory daily targets.
Buying is envisaged on a move through 64,835, as entering immediately below resistance would impair the scenario's quality. A stop loss at 63,950 limits the risk of a failed breakout. A return below 61,976 would invalidate the current recovery hypothesis and confirm continuation of the bearish structure. Reaching 67,752 remains a conditional target.
BTCUSD forecast scenario
Editors’ picks


EURUSD forecast 2026–2027: technical analysis, price levels & predictions
The EURUSD outlook for 2026 and 2027: key levels on the daily chart, three trading scenarios and the policy gap between the Fed and the ECB that drives the pair.

Gold (XAUUSD) forecast 2026: technical analysis, price levels & predictions
Where gold could trade in 2026: key levels, three trading scenarios with entry triggers and the forecasts from J.P. Morgan, Deutsche Bank and Goldman Sachs.
Forecasts presented in this section only reflect the author’s private opinion and should not be considered as guidance for trading. RoboForex bears no responsibility for trading results based on trading recommendations described in these analytical reviews.