
Daily technical analysis and forecast for 17 November 2026
Daily technical analysis and forecast for EURUSD, USDJPY, GBPUSD, AUDUSD, USDCAD, XAUUSD, US 500, and BTCUSD for 17 November 2026.
Each scenario on this page reflects the market structure on the H4 chart as of 10:00 AM UTC+2 on 17 November 2026. The assessment considers the current H4 chart structure, key support and resistance levels, the direction of the medium-term movement, and the prevailing fundamental backdrop.
EURUSD forecast
The fundamental backdrop for the euro remains subdued. Following last week's US inflation releases, the market has strengthened expectations of further monetary tightening by the Federal Reserve. This supports the dollar through interest rate expectations and limits the recovery in EURUSD. At its 29 October meeting, the European Central Bank left rates unchanged, emphasising that subsequent decisions would depend on incoming data. Thus, what matters for the euro is the relative pace of policy changes by the two central banks, rather than simply the fact that European rates remain unchanged.
Today, attention turns to US retail sales and industrial production. Strong readings could confirm resilient demand and increase pressure on the pair. Weak data, conversely, would create conditions for profit-taking on the dollar. European sentiment indicators and comments from ECB officials could influence intraday fluctuations, but their impact may be short-lived without a significant reassessment of interest rate expectations. The fundamental balance therefore leaves room for corrective rises in the euro while leaving it vulnerable to renewed selling.
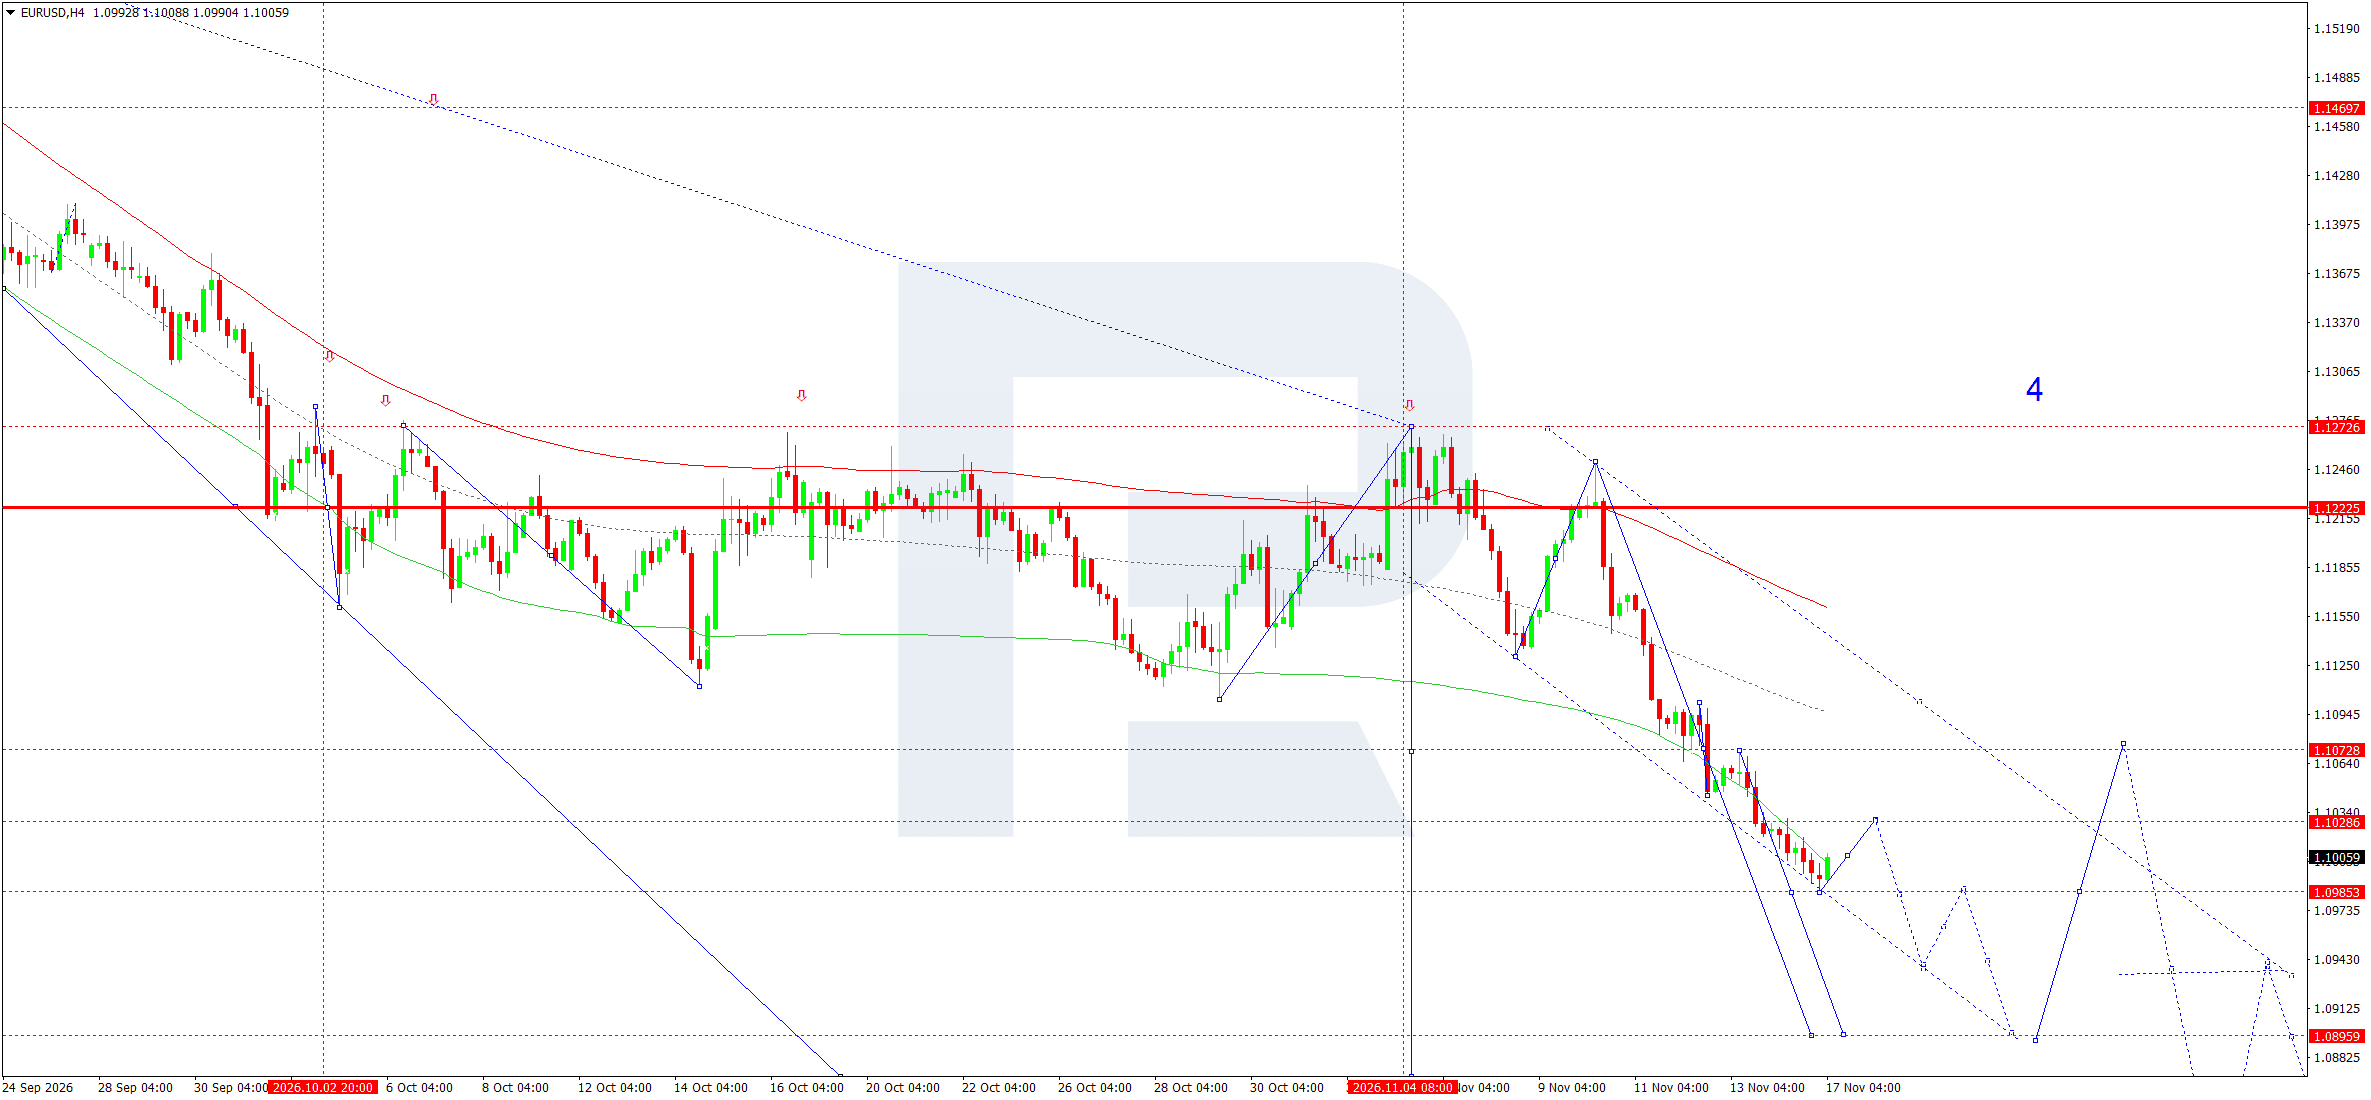
On the H4 chart, the sequence of lower highs and lower lows continues. The latest price is 1.1006, with the nearest support at 1.0985. Quotes are below the midline and upper boundary of the plotted Price Envelope, consistent with sellers' dominance. A recovery began after a test of the lower area, but there are no signs of a completed reversal yet.
For 17 November, the baseline scenario anticipates a correction towards 1.1029, followed by a return to 1.0985. Consolidation below support would open the way towards the intermediate 1.0940 area and then 1.0896.
The wave interpretation allows for continued downward momentum, but the wave count itself does not guarantee that it will materialise. Selling is considered if the decline resumes through 1.1001. A return above 1.1029 would weaken this scenario, while consolidation above 1.1073 would require a reassessment of the short-term structure. The centre of the broader range around 1.1223 remains distant resistance. The daily outlook therefore retains a conditional bearish bias, with the course of the correction assessed based on price reactions to nearby resistance levels and the nature of the subsequent pullback.
EURUSD forecast scenario
USDJPY forecast
The fundamental balance for USDJPY is shaped by two opposing factors. Expectations of further US interest rate hikes support the dollar, while deteriorating investor risk appetite could generate demand for the yen. The morning market report on 17 November points to a decline in USDJPY amid weakness in technology shares. This shows that the dollar's interest rate advantage does not rule out local corrections in the pair when risk positions are reduced.
For the Bank of Japan, persistent domestic inflation, wages, and the state of the economy are important. Without a confirmed new decision from the central bank, a policy change cannot be treated as an established driver of today's move. The main external reference point for the pair therefore remains the US: retail sales and industrial production releases could change expectations for the Fed's next step. Strong data would support yields and the dollar, while weak readings could deepen the correction. However, falling yields do not necessarily imply a sustained reversal of the overall bullish structure. Their reaction must be assessed alongside equity market performance and demand for safe-haven assets.
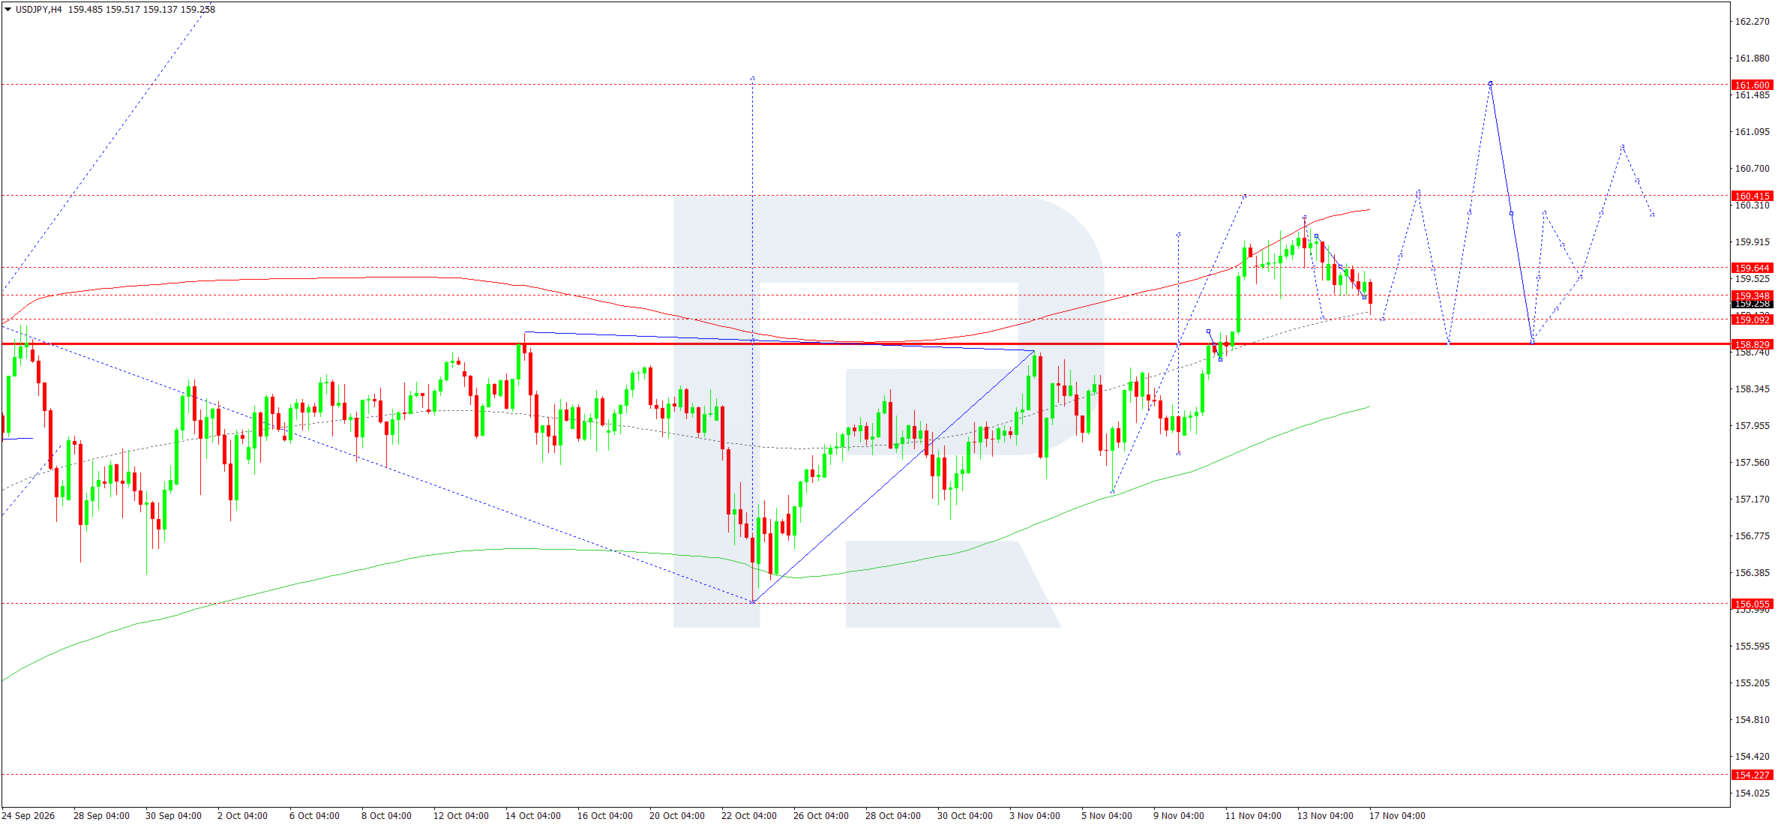
On the H4 chart, the latest price is around 159.26. After rising towards the 160.17 area, the market is forming a sequence of locally lower highs. Quotes have fallen below 159.64 and 159.35, approaching support at 159.09. However, the broader bullish structure remains intact as long as the key 158.83 area holds. Consequently, the current weakness is viewed primarily as a correction of the preceding advance.
For 17 November, consolidation above 159.09 is likely, with an attempt to recover towards 159.35 and 159.50. If buyers fail to gain a foothold above this area, another decline towards 159.09 and 158.83 is expected. The selected selling scenario requires a move through 159.21 to confirm renewed pressure.
Consolidation above 159.64 would invalidate the expectation of an immediate continuation of the correction and shift attention back to 160.42. The more distant upside target at 161.60 would become relevant only after a confirmed breakout above upper resistance. The wave pattern shown suggests alternating rises and pullbacks around 158.83, but does not mean that every projected path must occur. On the daily horizon, monitoring the nearest support levels remains the priority. Expecting growth to resume prematurely without price confirmation remains unjustified.
USDJPY forecast scenario
GBPUSD forecast
The fundamental picture for sterling remains mixed. In early November, the Bank of England raised its key interest rate to 4.00% in response to inflation risks. This decision supports yields on British assets but also tightens conditions for lending and domestic demand. Consequently, the rate hike alone does not ensure sustained sterling appreciation, particularly when the market is simultaneously revising the expected US interest rate path towards tighter Fed policy.
Today, UK labour market data and subsequent inflation expectations are important. Sustained wage growth could support expectations of further action by the BoE. Weaker employment, by contrast, would heighten concerns about economic activity. Until the actual figures are released, these possibilities should be treated as conditional. US retail sales and industrial production could also alter the balance: strong readings would support the dollar, while disappointing data would give sterling room to recover. Energy costs and external conflicts remain additional sources of uncertainty affecting UK inflation and households' real incomes.
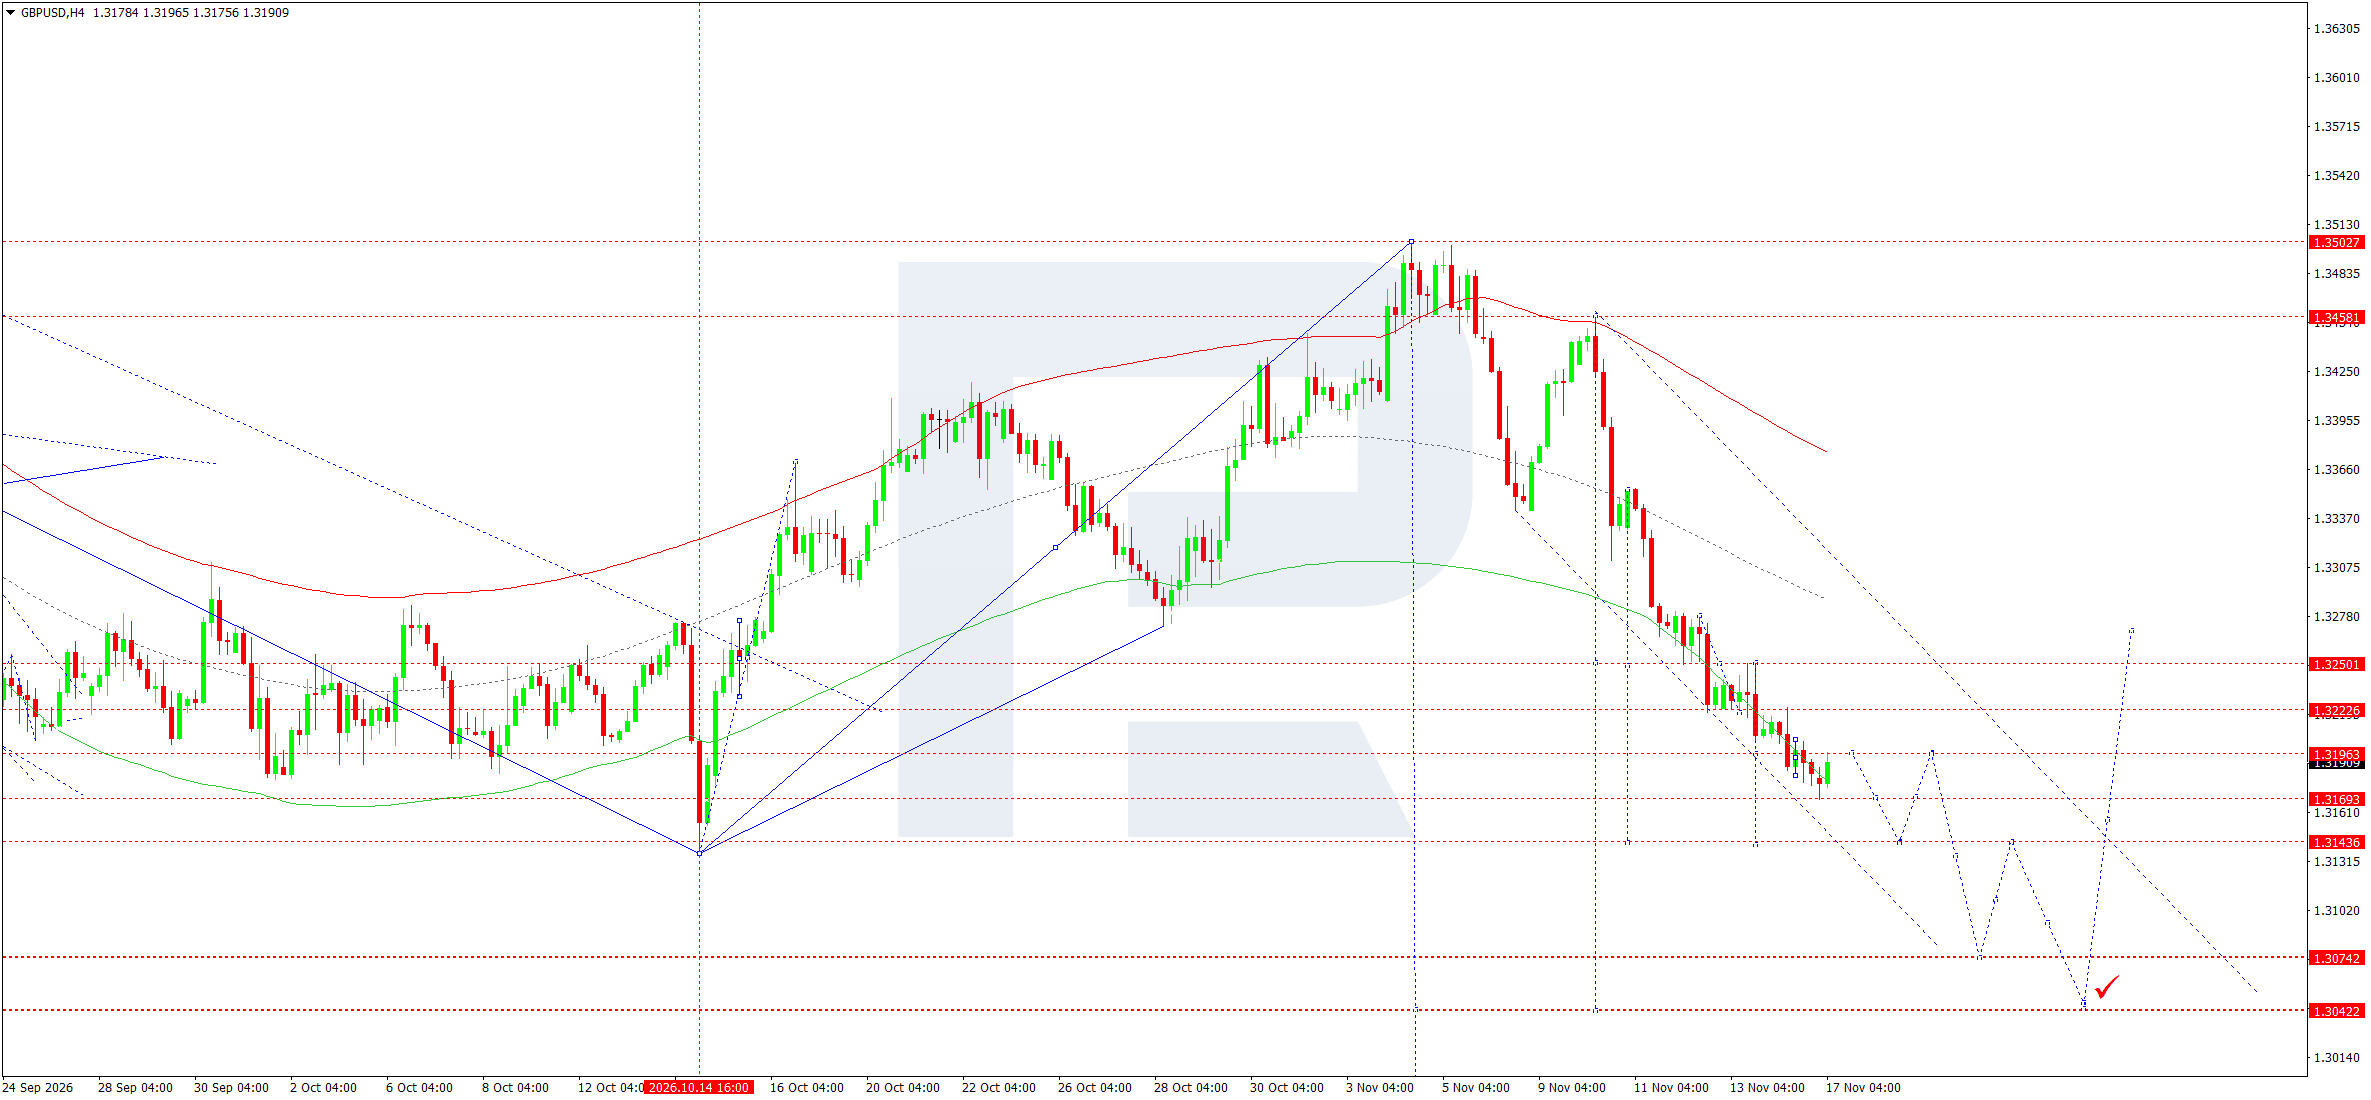
On the H4 chart, GBPUSD retains a pronounced bearish structure following a reversal from its November highs. The latest price is 1.3191. The nearest resistance is at 1.3196, followed by 1.3223 and 1.3250, with support levels at 1.3169 and 1.3144. Quotes trading beneath the descending midline of the Price Envelope confirm ongoing pressure, although proximity to local lows increases the likelihood of an initial rebound.
For 17 November, the main scenario envisages a limited recovery towards the 1.3196 area, followed by another move towards 1.3169. A break below this support would create scope for a decline towards 1.3144. If downward momentum extends, the next target is 1.3074.
The trading scenario envisages selling on a decline through 1.3186. A stop loss above 1.3223 protects against the correction developing into a deeper recovery. A return above 1.3250 would require the local bearish preference to be reconsidered.
The wave count is consistent with a further decline, but confirmation would come from actual breakouts below support levels. As long as the structure of lower highs and lower lows remains intact, any rise is treated as corrective. The subsequent outlook will depend on sellers' resilience when the nearest support levels at the bottom of the range are tested again.
GBPUSD forecast scenario
AUDUSD forecast
The Australian dollar is caught between support from domestic monetary policy and pressure from the US currency's global strengthening. On 3 November, the Reserve Bank of Australia raised its rate by 25 basis points to 4.85%. This reflects persistent inflation risks and limits the case for expecting rapid policy easing. The published minutes of the November meeting help assess how firmly this course may be maintained, but a high policy rate alone does not eliminate AUDUSD's sensitivity to external demand and global risk appetite.
On the morning of 17 November, pressure on the Australian currency coincided with declines in technology shares and growing expectations of further Fed tightening. This is an unfavourable combination for the AUD: the dollar benefits from interest rate support, while investors reduce exposure to risk-sensitive instruments. China's economic performance remains an important channel through demand for Australian commodities. However, individual moves in commodity prices cannot automatically be translated into exchange rate movements without confirmation from the broader market. Today's US retail sales and industrial production could intensify existing pressure or trigger short-term profit-taking on long dollar positions.
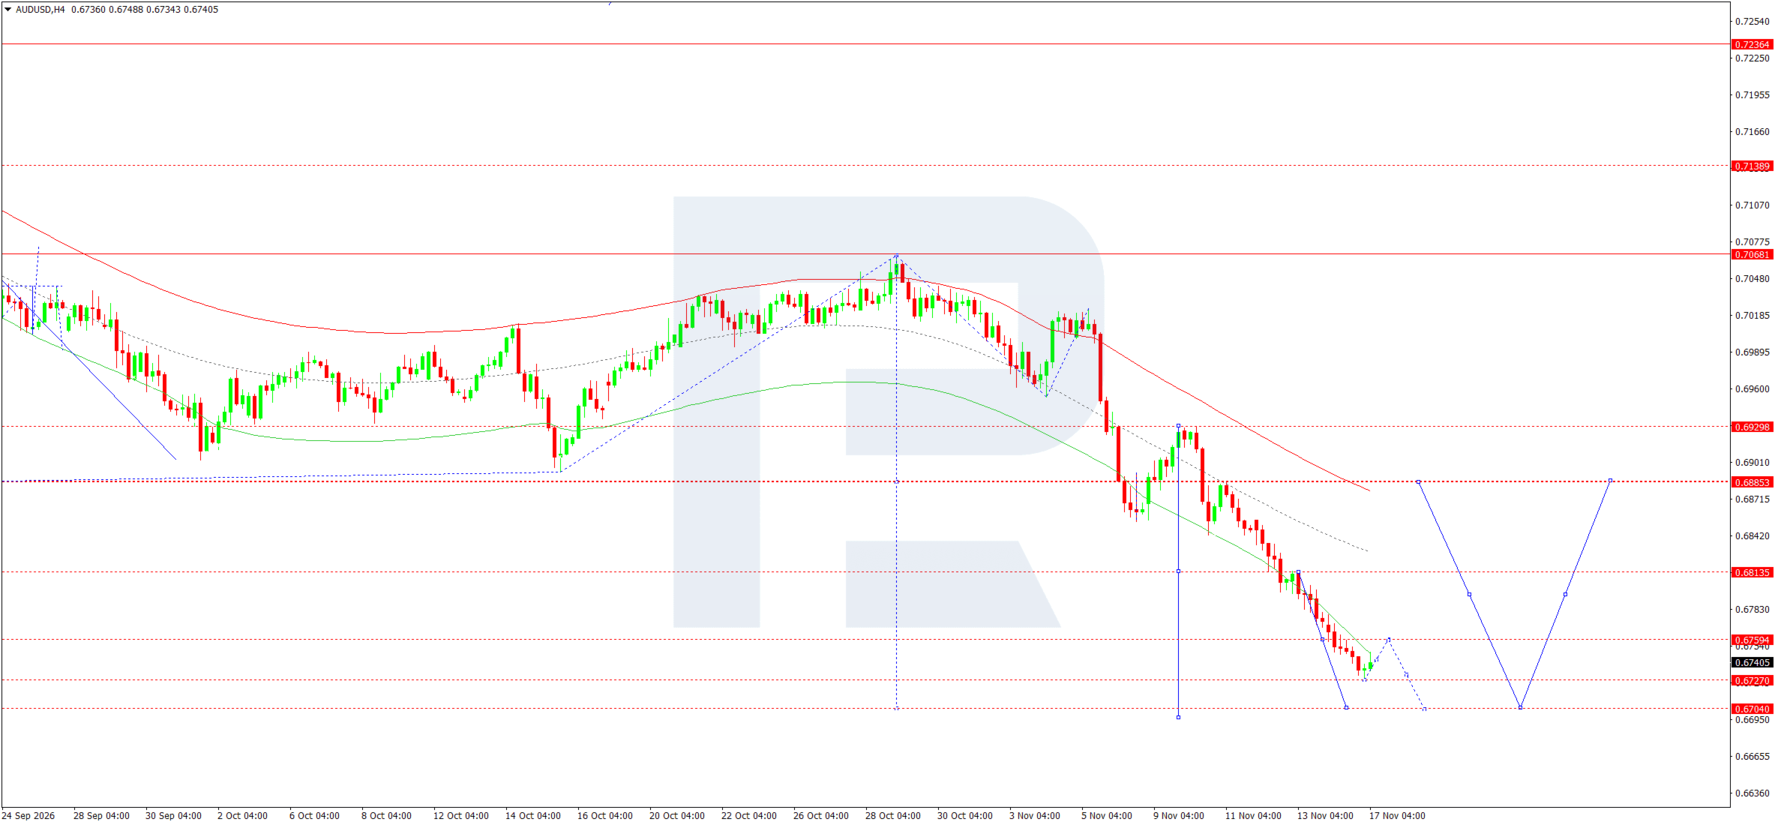
On the H4 chart, the latest price is 0.6741. The pair continues to decline after leaving its previous range, setting new local lows. The nearest support levels are at 0.6727 and 0.6704, with resistance lying at 0.6759, followed by 0.6814. All the main lines of the plotted Price Envelope slope downwards, so a modest rebound does not yet change the technical preference.
For 17 November, the baseline scenario suggests a recovery towards 0.6759 followed by renewed selling pressure. A decline through 0.6736 would trigger the selected trading scenario. The first test of momentum strength would be 0.6727; consolidation below this level would open the way towards 0.6704. Profit-taking and the formation of a base for a correction are possible at this level.
A rebound from 0.6704 could return quotes to 0.6759 and then 0.6814, but the latter target requires separate confirmation and may be reached later. A return above 0.6759 would ease immediate pressure, whereas sustained consolidation above 0.6814 would change the short-term structure.
The wave pattern supports the bearish interpretation while keeping the projected trajectory conditional. The price remaining below the nearest resistance would support the selected trade direction until new lows are recorded.
AUDUSD forecast scenario
USDCAD forecast
The Canadian dollar is navigating a combination of domestic inflation, oil market conditions, and US interest rate expectations. Data released on 16 November showed Canada's annual consumer inflation holding at 3.1% in October. At the same time, analysts' assessments of core indicators point to more subdued underlying domestic price pressure. For the Bank of Canada, this makes it necessary to distinguish the impact of individual goods components from the persistence of the broader inflation process before determining its next interest rate decisions.
On the US dollar side, expectations of further Fed tightening remain in place following strong US inflation releases. The difference between the central banks' anticipated responses could support USDCAD even in the absence of new decisions today. Oil also matters: weakness in oil prices generally worsens Canada's export conditions, while a recovery could support the national currency. This relationship should be assessed conditionally, as dollar demand and investors' risk appetite also change simultaneously. US retail sales and industrial production will be important catalysts during the day. Strong figures could support a further rise in the pair, while weak data would increase the likelihood of a correction after a substantial advance.
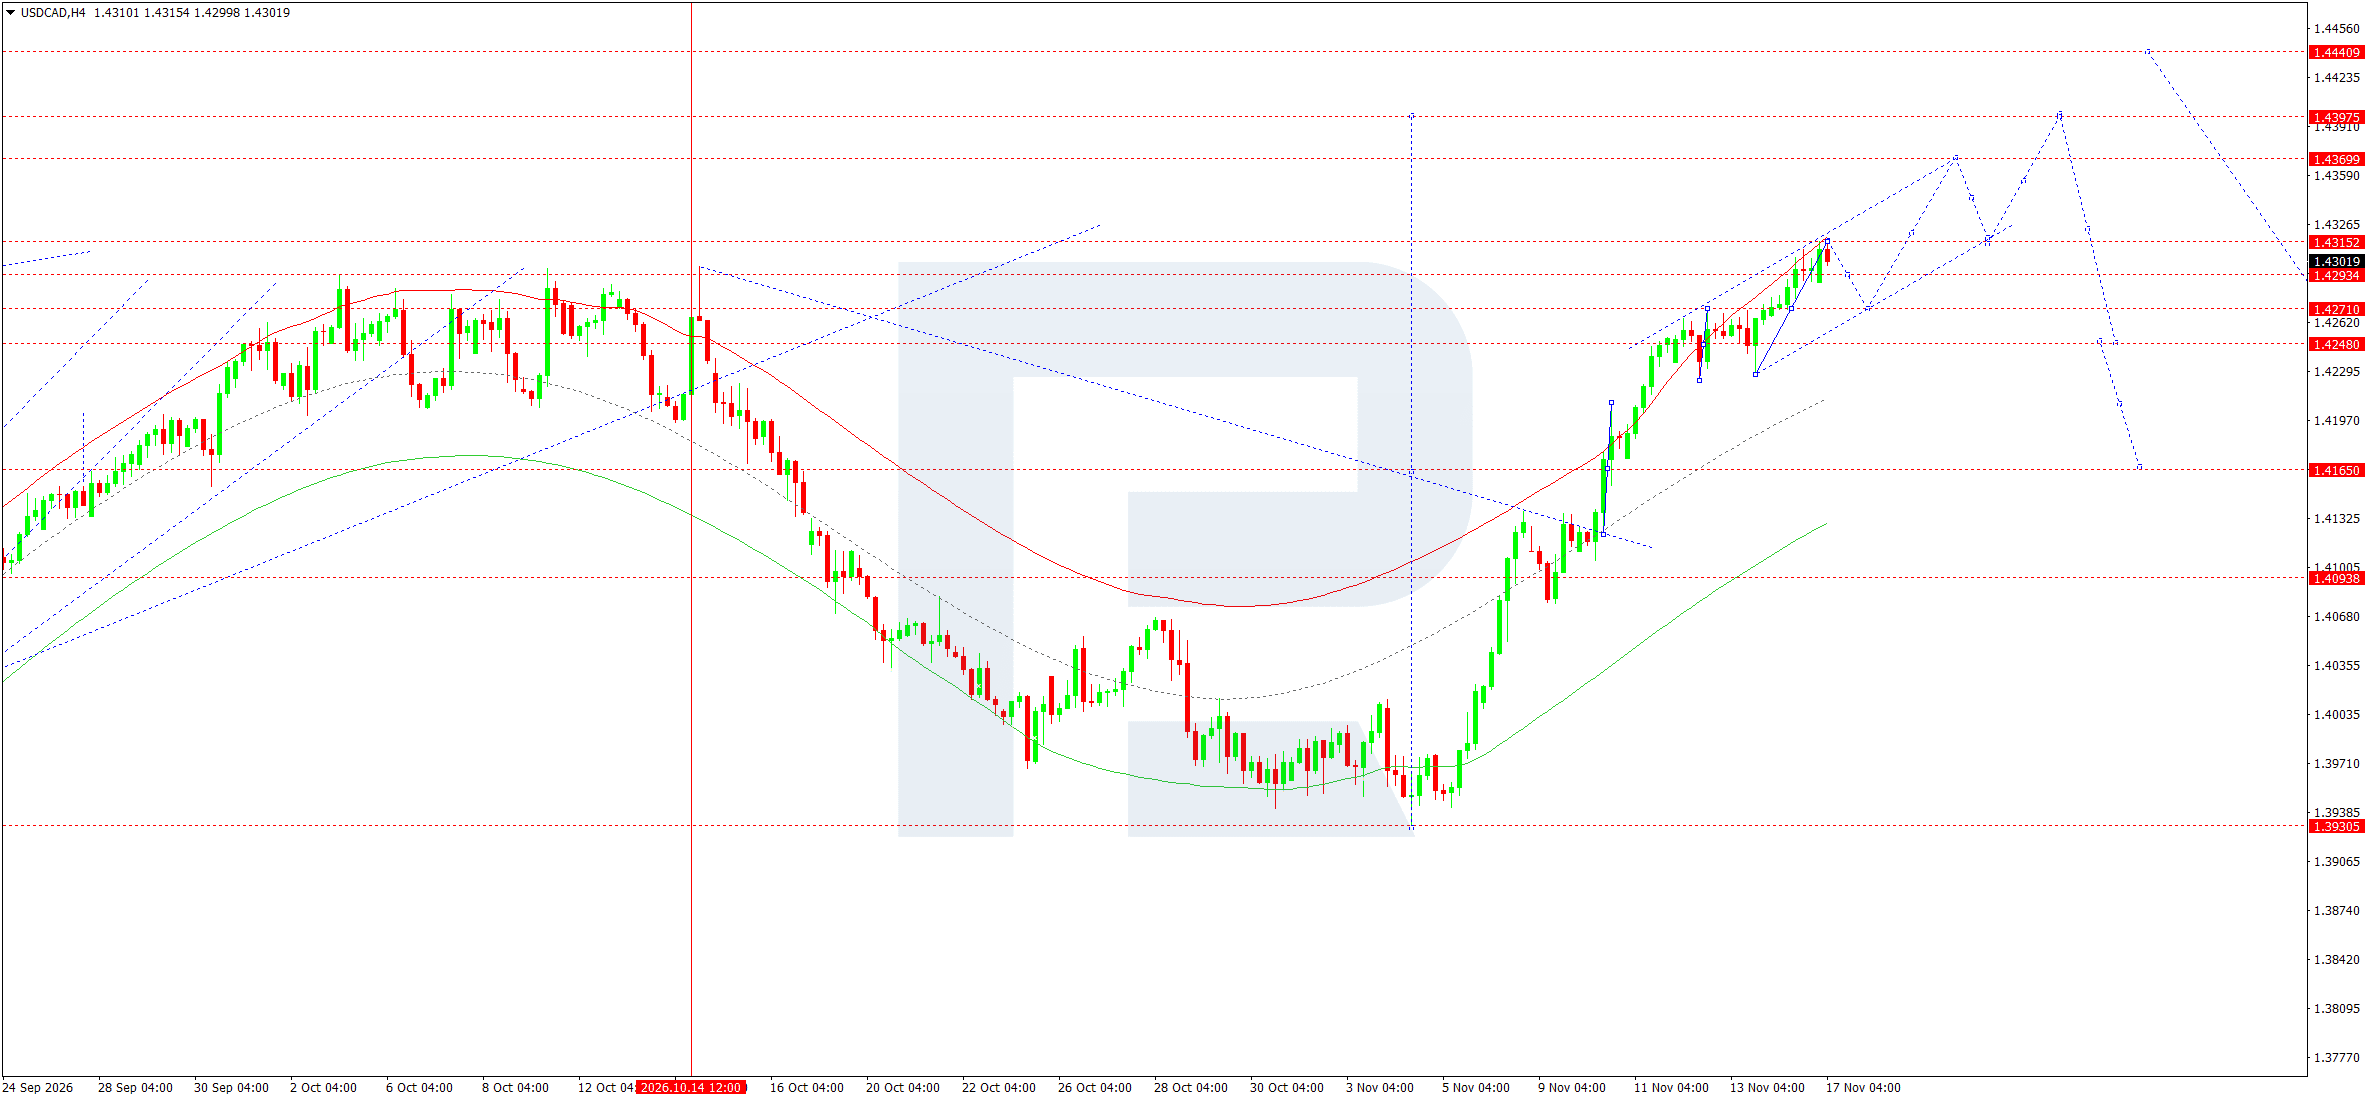
On the H4 chart, the latest price is 1.4302. Following a reversal from its November base, the market has been posting successively higher lows and highs. Quotes remain above the ascending midline of the Price Envelope and have approached resistance at 1.4315. The nearest support levels are at 1.4293 and 1.4271, with the 1.4248 area below.
For 17 November, the main scenario envisages consolidation below 1.4315 and continued growth after resistance is overcome. Buying on a move through 1.4307 is regarded as an early entry within the current bullish structure; consolidation above 1.4315 would provide confirmation. The next target is at 1.4370, followed by a possible test of 1.4398. The 1.4441 area is a more distant target.
As the price is already above 1.4300, a further breakout above that level cannot be regarded as an independent new bullish signal. A decline towards 1.4271 remains an acceptable correction but would invalidate the proposed short-term trade. Consolidation below 1.4248 would significantly weaken the bullish scenario and increase the likelihood of a move towards 1.4165.
The wave count allows for a continued advance but does not rule out an initial pullback. If resistance is not broken, it is preferable to assess the trading range after the corrective movement has ended.
USDCAD forecast scenario
XAUUSD forecast
Gold remains sensitive to a strengthening dollar and changes in real yields on US bonds. A World Gold Council review dated 16 November notes the unfavourable combination of these factors amid increasingly hawkish interest rate expectations. For an instrument that generates no interest income, this environment raises the opportunity cost of holding it. Inflation concerns therefore do not necessarily support XAUUSD: if they strengthen expectations of Fed rate increases, the metal's initial reaction may remain negative.
Geopolitical uncertainty sustains potential demand for safe-haven assets, but its intensity varies and does not guarantee a price reversal. When reducing risky positions, market participants may also sell gold to obtain liquidity. Today's important reference points will be US retail sales and industrial production. Strong data could support the dollar and yields, increasing pressure on the metal. Weak readings would raise the likelihood of a recovery. It is important to distinguish short-term short-covering from a sustained change in the fundamental environment: the latter would require a more consistent decline in interest rate expectations. Until such confirmation emerges, upward movements are regarded as corrections within the current bearish structure.
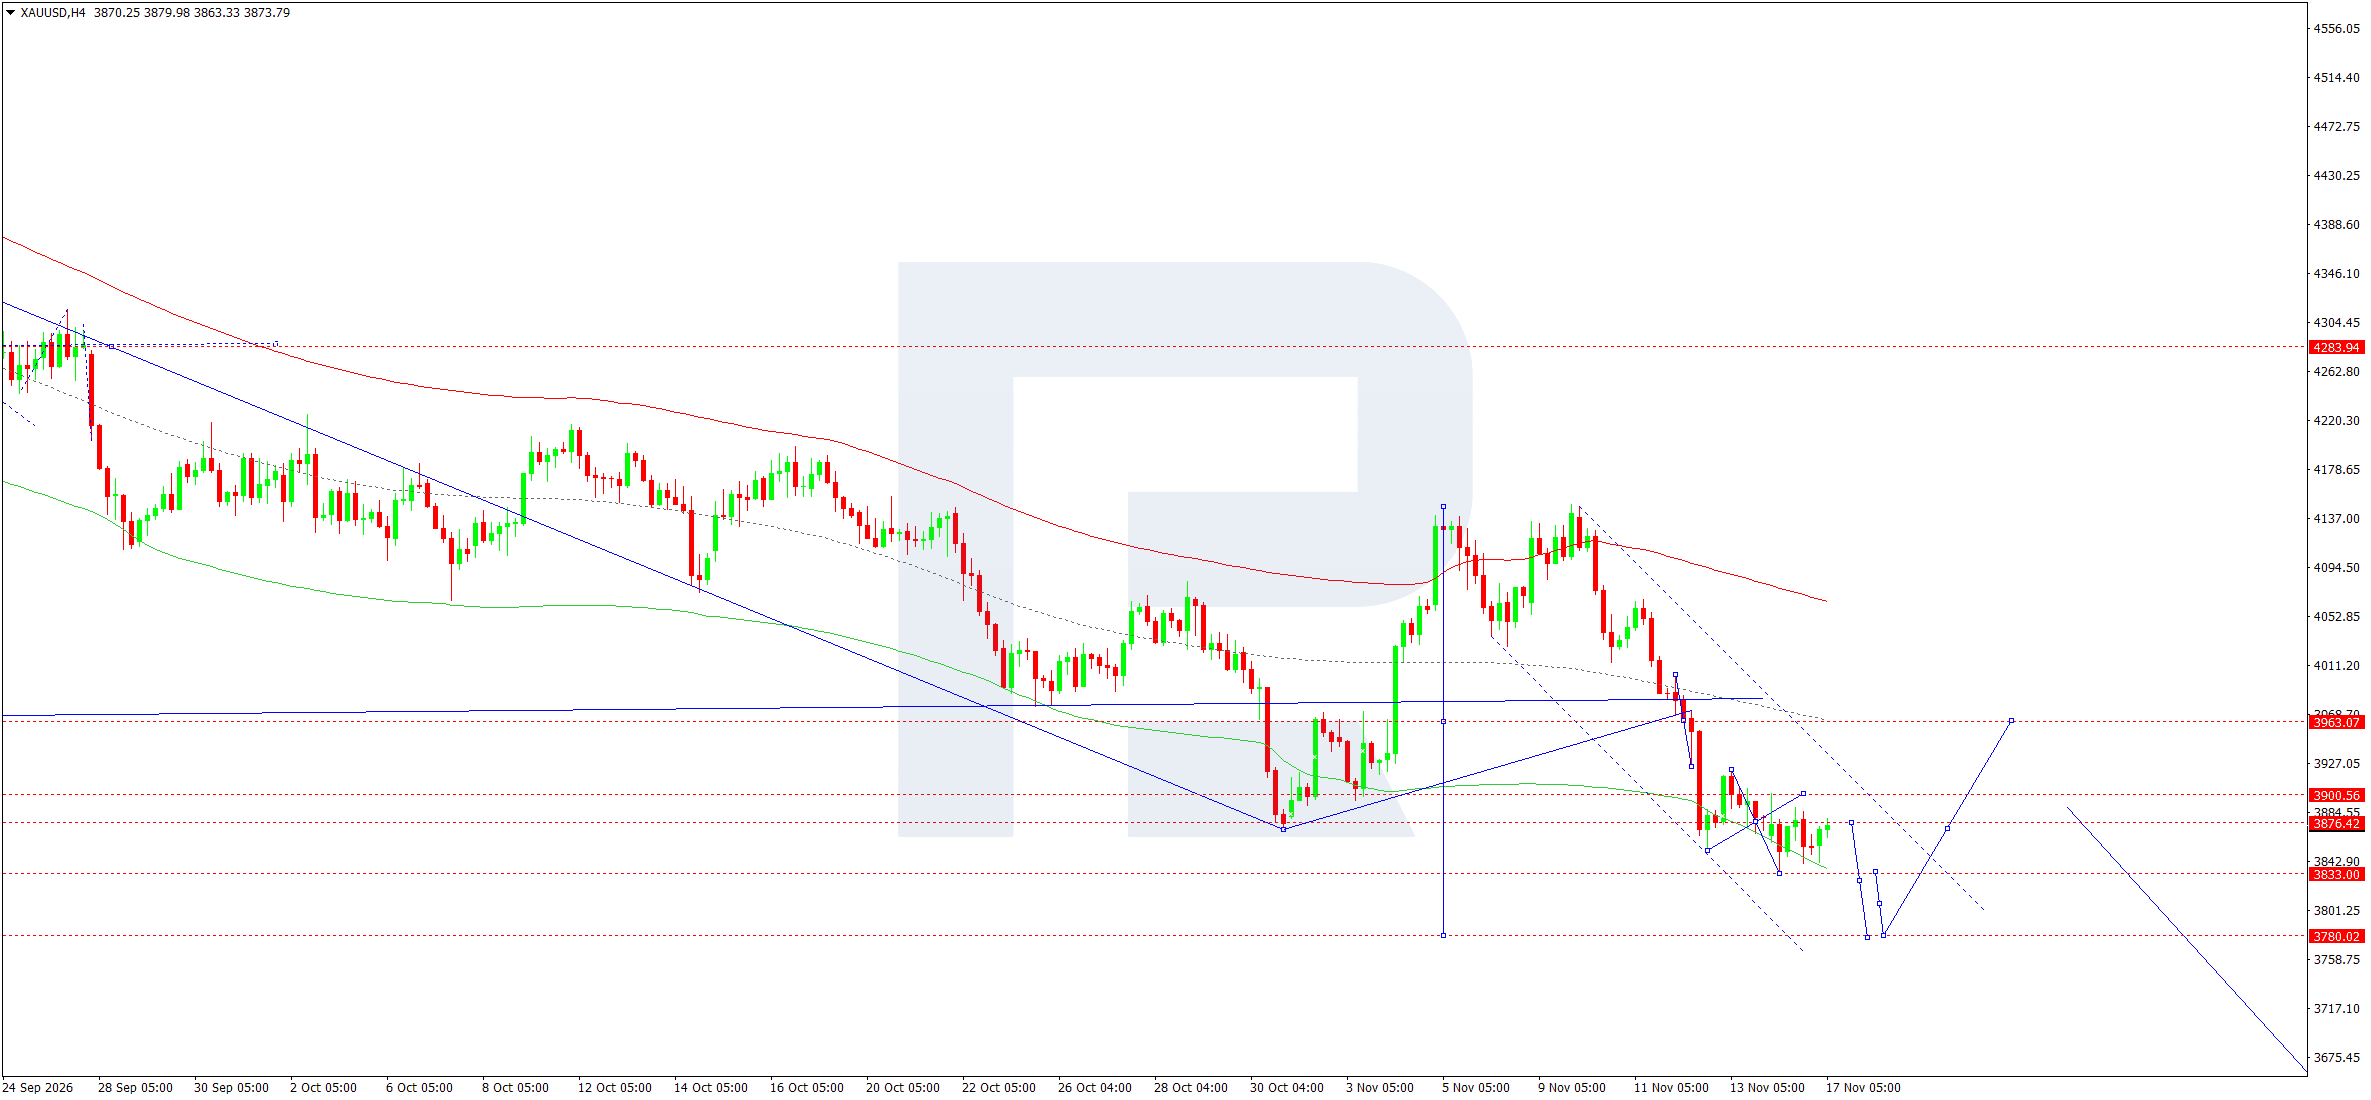
On the H4 chart, the latest price is 3,874. After falling towards the 3,833 area, the market recovered to resistance at 3,876. Quotes remain below 3,901 and the central area of the Price Envelope near 3,963. The sequence of lower highs continues, and local consolidation does not yet indicate a completed reversal.
For 17 November, the baseline scenario anticipates a failed attempt to consolidate above 3,876, followed by a return to 3,833. Selling on a decline through 3,869 targets a continuation of this move. A break below 3,833 would open the way towards 3,780, corresponding to the nearest plotted support and the lower area of the projected structure.
A return above 3,901 would weaken the bearish scenario, while consolidation above this area would increase the likelihood of a correction towards 3,963. The stop loss is placed above the nearest resistance to distinguish an ordinary test of the level from a deeper recovery.
The wave interpretation suggests another decline but does not confirm the precise sequence of future fluctuations in advance. Reaching the target depends on momentum persisting after the price breaks out of consolidation.
XAUUSD forecast scenario
US 500 forecast
The US stock market enters the session under the influence of a reassessment of the technology sector and expectations of further monetary tightening. Morning reports on 17 November point to continued pressure on shares of companies associated with artificial intelligence. This matters for the broad index because of the substantial weight of the largest technology issuers. Even resilience in some defensive sectors may prove insufficient if investors continue to reduce their positions in the market's most expensive segments.
NVIDIA’s forthcoming earnings report increases investors' sensitivity to revenue forecasts, capital expenditure, and the returns on infrastructure investment. However, its future results cannot be treated as already known. US retail sales and industrial production are additional factors. Strong data could support expectations for corporate revenues, but could simultaneously heighten concerns about Fed rates. The index's reaction therefore depends on which channel dominates. Weak data is also ambiguous: falling yields could support equity valuations, while worsening earnings expectations would limit a recovery. This combination implies more volatile intraday movements and a need for technical breakouts to be confirmed.
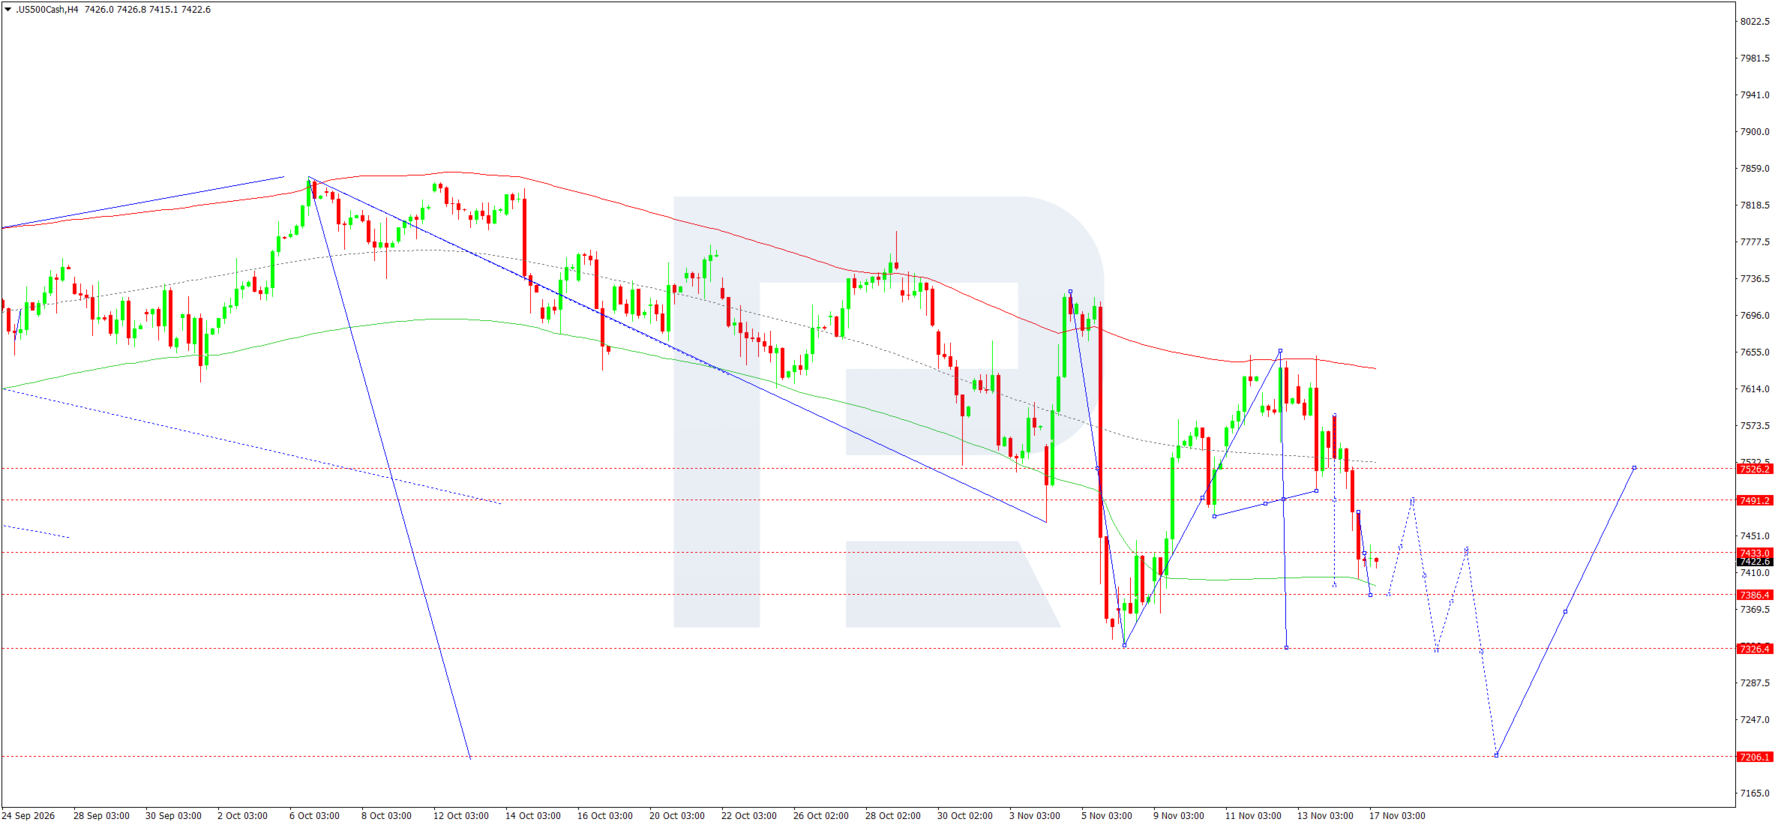
On the H4 chart, the latest US 500 price is 7,423. Following a failed recovery towards a local November high, the index resumed its decline. Quotes are below resistance at 7,433, with the nearest support at 7,386. Above are 7,491 and 7,526. The downward slope of the Price Envelope's midline is consistent with continued selling pressure.
For 17 November, the main scenario envisages consolidation near current levels followed by a test of the 7,386 level. Selling on a decline through 7,418 targets a continuation of this momentum. Consolidation below the first support would create scope for a move towards 7,326. The 7,206 level remains an extended target if selling intensifies, rather than an obligatory outcome of a single session.
A stop loss above 7,491 takes account of a possible initial corrective rise. A return above 7,526 would weaken the bearish scenario and require a fresh assessment of the structure.
The wave pattern suggests further decline followed by a recovery once a base has formed. The first confirmation is expected after a decisive breakout below support.
US 500 forecast scenario
BTCUSD forecast
The fundamental environment for Bitcoin remains challenging owing to a combination of elevated interest rate expectations and investors' cautious attitude towards risk. Recent market reports point to continued pressure from outflows from Bitcoin exchange-traded funds. This limits the market's ability to recover quickly after a sharp decline, as a sustained rise requires fresh demand rather than merely temporary short-covering. The precise volume of flows should nevertheless be assessed for each individual reporting period.
Expectations of further Fed tightening increase the appeal of dollar liquidity and complicate the recovery of speculative assets. Pressure on technology shares also creates an unfavourable backdrop, although the correlation between cryptocurrencies and equity markets is not constant. Following a substantial fall, sharp rebounds are possible as selling subsides and short positions are liquidated. Such movements do not in themselves demonstrate that a new uptrend has begun. Today's US retail sales and industrial production could change interest rate expectations and overall risk appetite. The scenario of a local rise in Bitcoin is therefore viewed as a technical correction subject to ongoing fundamental constraints, not as a confirmed improvement in the long-term picture.
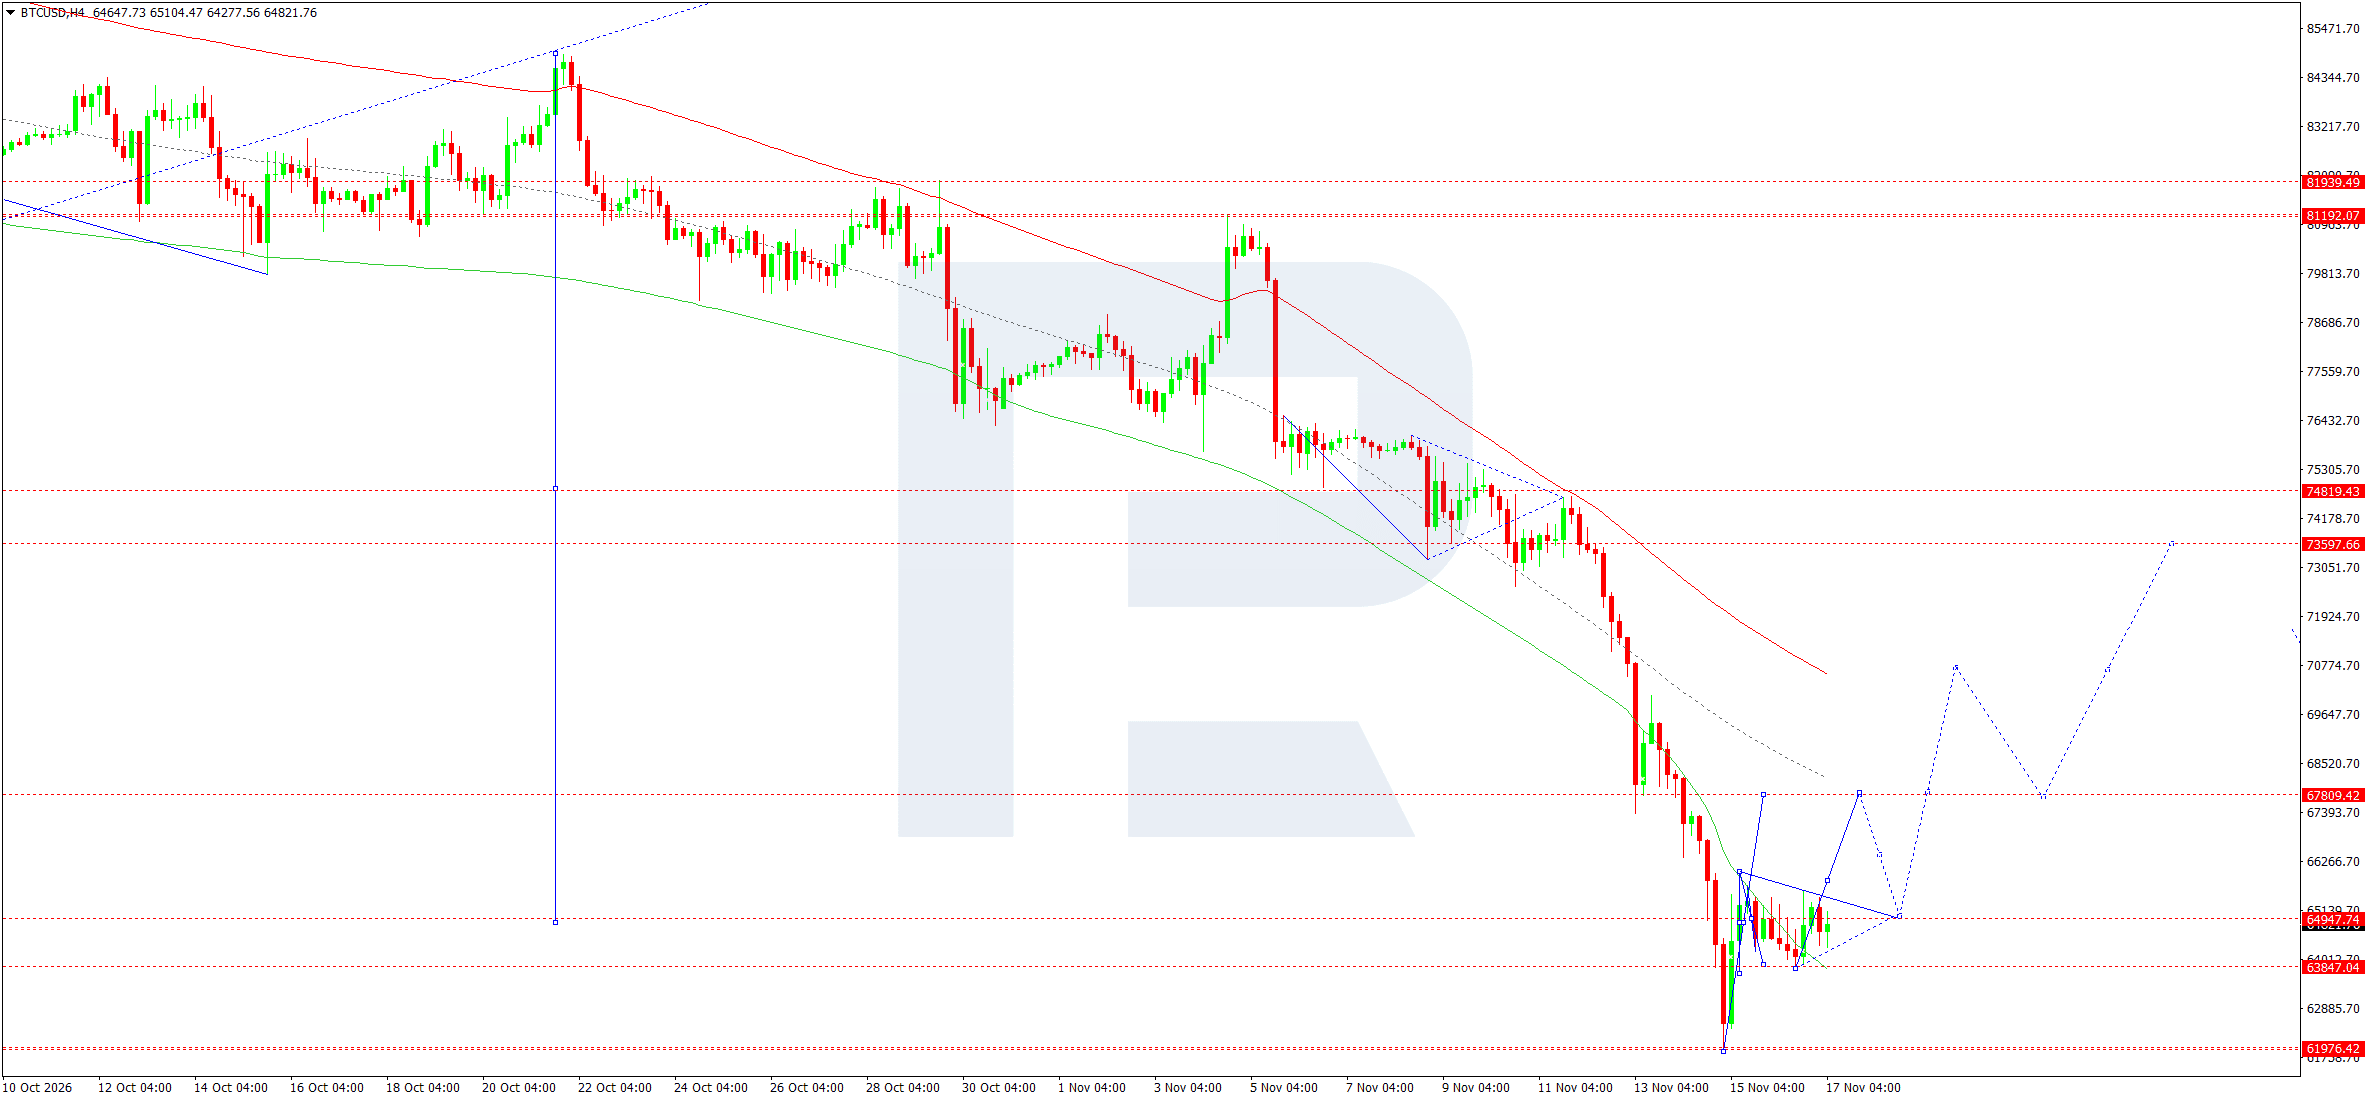
On the H4 chart, the latest BTCUSD price is 64,822. After reaching the 61,976 area, the market recovered and is forming a tight consolidation between support at 63,847 and resistance around 64,948. The broader bearish structure remains intact: quotes are well below the midline and upper boundary of the Price Envelope.
For 17 November, a corrective BUY scenario is considered on a move through 64,827 followed by consolidation above 64,948. The proximity of the entry to the current price means confirmation of a breakout from the range is crucial. If the price successfully breaks upwards, the nearest target is 67,809. A subsequent retest of the 64,948 area is then possible.
A stop loss below 63,847 limits the risk of a failed recovery. A return below this support would invalidate the local buying scenario and increase the likelihood of another move towards 61,976. Further growth towards 70,775 and 73,598 would require a break above 67,809 and is not among the mandatory daily targets.
The plotted wave pattern suggests a recovery, but the direction of the main trend will change only after a sustained sequence of higher highs and higher lows has formed. The resilience of the rebound depends on buyers retaining their nearest support.
BTCUSD forecast scenario
Editors’ picks


EURUSD forecast 2026–2027: technical analysis, price levels & predictions
The EURUSD outlook for 2026 and 2027: key levels on the daily chart, three trading scenarios and the policy gap between the Fed and the ECB that drives the pair.

Gold (XAUUSD) forecast 2026: technical analysis, price levels & predictions
Where gold could trade in 2026: key levels, three trading scenarios with entry triggers and the forecasts from J.P. Morgan, Deutsche Bank and Goldman Sachs.
Forecasts presented in this section only reflect the author’s private opinion and should not be considered as guidance for trading. RoboForex bears no responsibility for trading results based on trading recommendations described in these analytical reviews.