
Daily technical analysis and forecast for 18 November 2026
Daily technical analysis and forecast for EURUSD, USDJPY, GBPUSD, AUDUSD, USDCAD, XAUUSD, US 500, and BTCUSD for 18 November 2026.
Each scenario on this page reflects the market structure on the H4 chart as of 10:00 AM UTC+2 on 18 November 2026. The assessment considers the current H4 chart structure, key support and resistance levels, the direction of the medium-term movement, and the prevailing fundamental backdrop.
EURUSD forecast
Eurostat's preliminary estimate showed annual inflation in the eurozone accelerating from 3.8% to 4.0% in October. Energy prices rose by 20.8% year-on-year, while inflation excluding energy, food, alcohol, and tobacco remained at 2.5%. At the end of October, the European Central Bank kept its deposit rate at 2.50%. The composition of price pressures matters for the euro. Rising energy costs simultaneously increase inflation and worsen conditions for businesses and households, so the single currency's reaction to the final estimate will depend on the dynamics of the underlying components.
The US Federal Reserve is keeping its policy rate within the 3.75–4.00% range. Two participants in the October vote preferred a quarter-percentage-point hike. US consumer prices rose by 0.4% month-on-month in October, while the latest retail sales estimate showed monthly growth slowing from 0.8% to 0.2%. If the minutes highlight concerns about broad-based price pressures, the dollar could find support. A muted response from US bond yields would make a euro rebound easier.
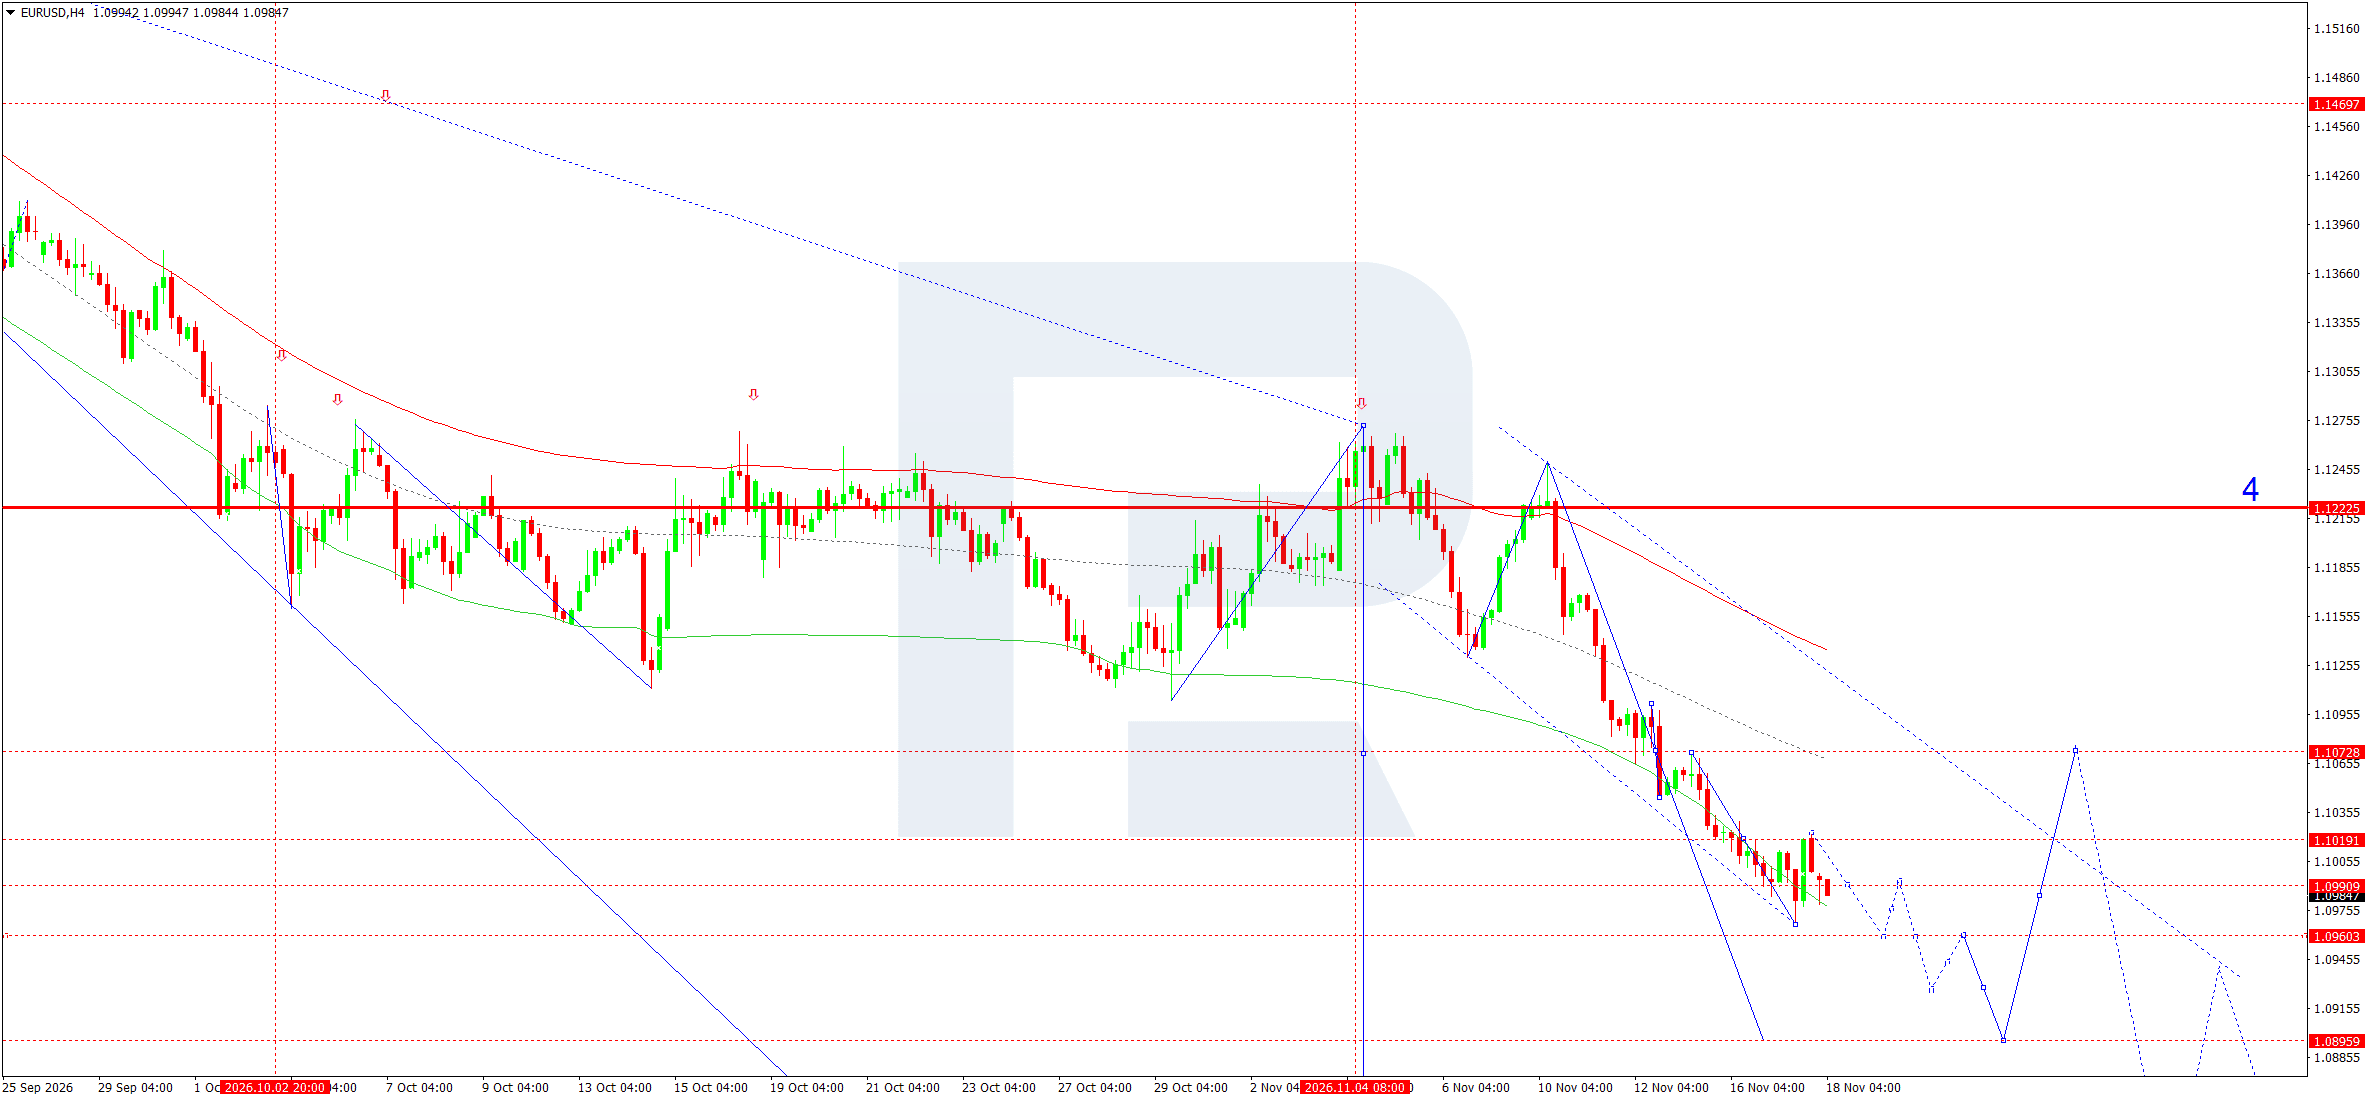
On the H4 chart, EURUSD remains in a bearish structure. A rebound from the 1.0975 area stalled near 1.1019, after which the price fell back below 1.0991. A return towards 1.0994 is possible at the beginning of the session. If this attempt ends below 1.1019, the nearest support will be at 1.0960. A break below this level would open the way towards 1.0940, where a brief consolidation and a possible rebound towards 1.0983 could occur. Consolidation below 1.0940 would bring the next target at 1.0896 into focus. The 1.0870 level represents an extension of the move and would require continued selling after 1.0896 is tested.
In the Elliott Wave count, lower highs are consistent with a continued decline. The wave matrix pivot is at 1.1222.
On the intraday horizon, the reaction to 1.1019 is more important: a sustained return above this level would weaken the bearish scenario and create scope for a correction towards 1.1073. The entry is below the current quote so that the scenario is triggered when selling resumes. Reaching the 1.0940 target would first require a break below the 1.0960 support level, where the move may slow.
EURUSD forecast scenario
USDJPY forecast
The Bank of Japan is keeping its overnight interest rate target at around 1.25%. The materials from its October meeting noted that rising energy and raw material costs could slow economic activity. This creates two opposing effects for the yen. More expensive imports worsen the terms of trade, while the pass-through of higher costs to consumer prices could strengthen the case for further rate hikes. A reassessment of this outlook could quickly reduce interest in positions based on the interest rate differential between the US and Japan.
The Federal Reserve's 3.75–4.00% policy rate range preserves the short-term yield advantage of dollar-denominated instruments. Meanwhile, the US sales report published on Tuesday showed a slowdown in the headline figure, while sales excluding motor vehicles and petrol rose by 0.5%. This combination leaves the pair sensitive to details in the Fed minutes. Rising US bond yields would favour the dollar. Falling yields or a deterioration in risk appetite could trigger the covering of short yen positions. Near 160.00, the market's sensitivity to comments by Japanese authorities about the exchange rate remains an additional source of volatility.
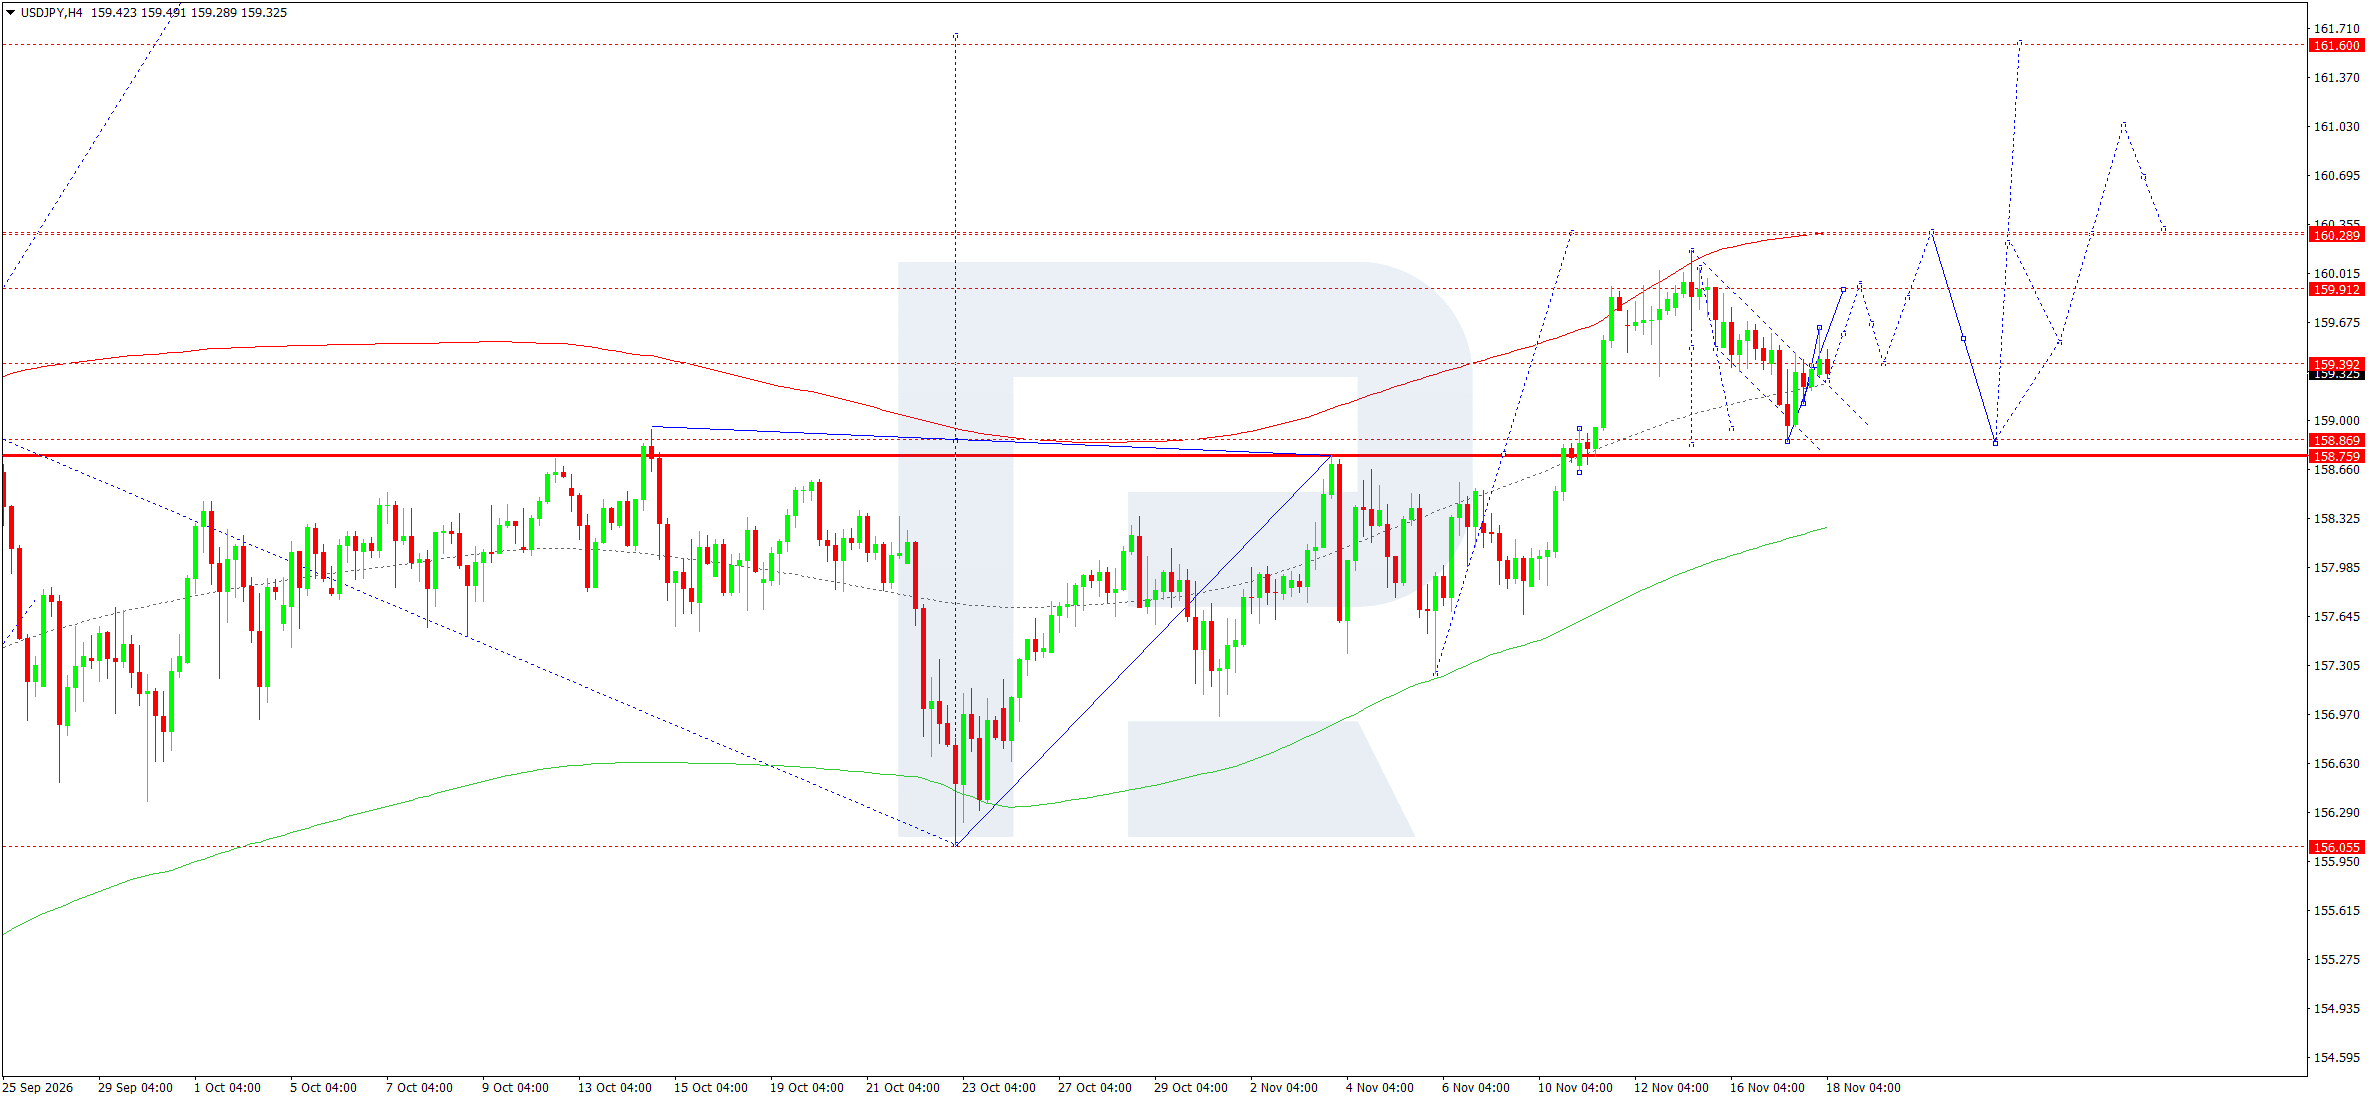
On the H4 chart, the decline from the November highs brought the pair into the support area marked at 158.87. A rebound returned the price to 159.33, immediately below resistance at 159.39. As long as higher local lows continue to form, a retest of the 159.39 level remains possible. Consolidation above this level would open the way towards 159.91. After reaching that area, the price could pull back towards 159.39–159.30, particularly if upward momentum slows ahead of the round 160.00 level.
In the Elliott Wave count, the current rise is viewed as a resumption of the upward move after a correction. The wave matrix pivot is around 158.80, close to the 158.76–158.87 zone. If this area holds and 159.91 is breached, the more distant target is at 160.29, near the Price Envelope's upper boundary in the current section.
A return below 159.10 would cast doubt on the selected rebound scenario and increase the likelihood of a retest of the 158.87 level. The entry at 159.38 allows the scenario to be triggered on an approach to resistance, while the price holding above 159.39 would confirm further growth.
USDJPY forecast scenario
GBPUSD forecast
In November, the Bank of England raised its key interest rate by 0.25 percentage points to 4.00%. Eight voting members supported the move, while one favoured a larger increase of 0.50 percentage points. According to the BoE, rising energy prices could push UK inflation to around 5% by the middle of next year. For sterling, the release of the October Consumer Price Index will test how far price pressures have spread beyond energy. Accelerating services inflation could reinforce expectations of further tightening and support a recovery in sterling.
At the same time, rising energy bills are restricting households' real incomes. If the UK report shows an acceleration in headline inflation but subdued services inflation, the deterioration in the consumption outlook could limit support from interest rate expectations. In the US, October's 0.4% monthly increase in consumer prices keeps attention focused on the risk of a Fed rate hike. The forthcoming minutes will show how widely participants discussed further tightening. For GBPUSD, the sequence of events matters: the initial move following the UK figures could change after the US bond market reacts.
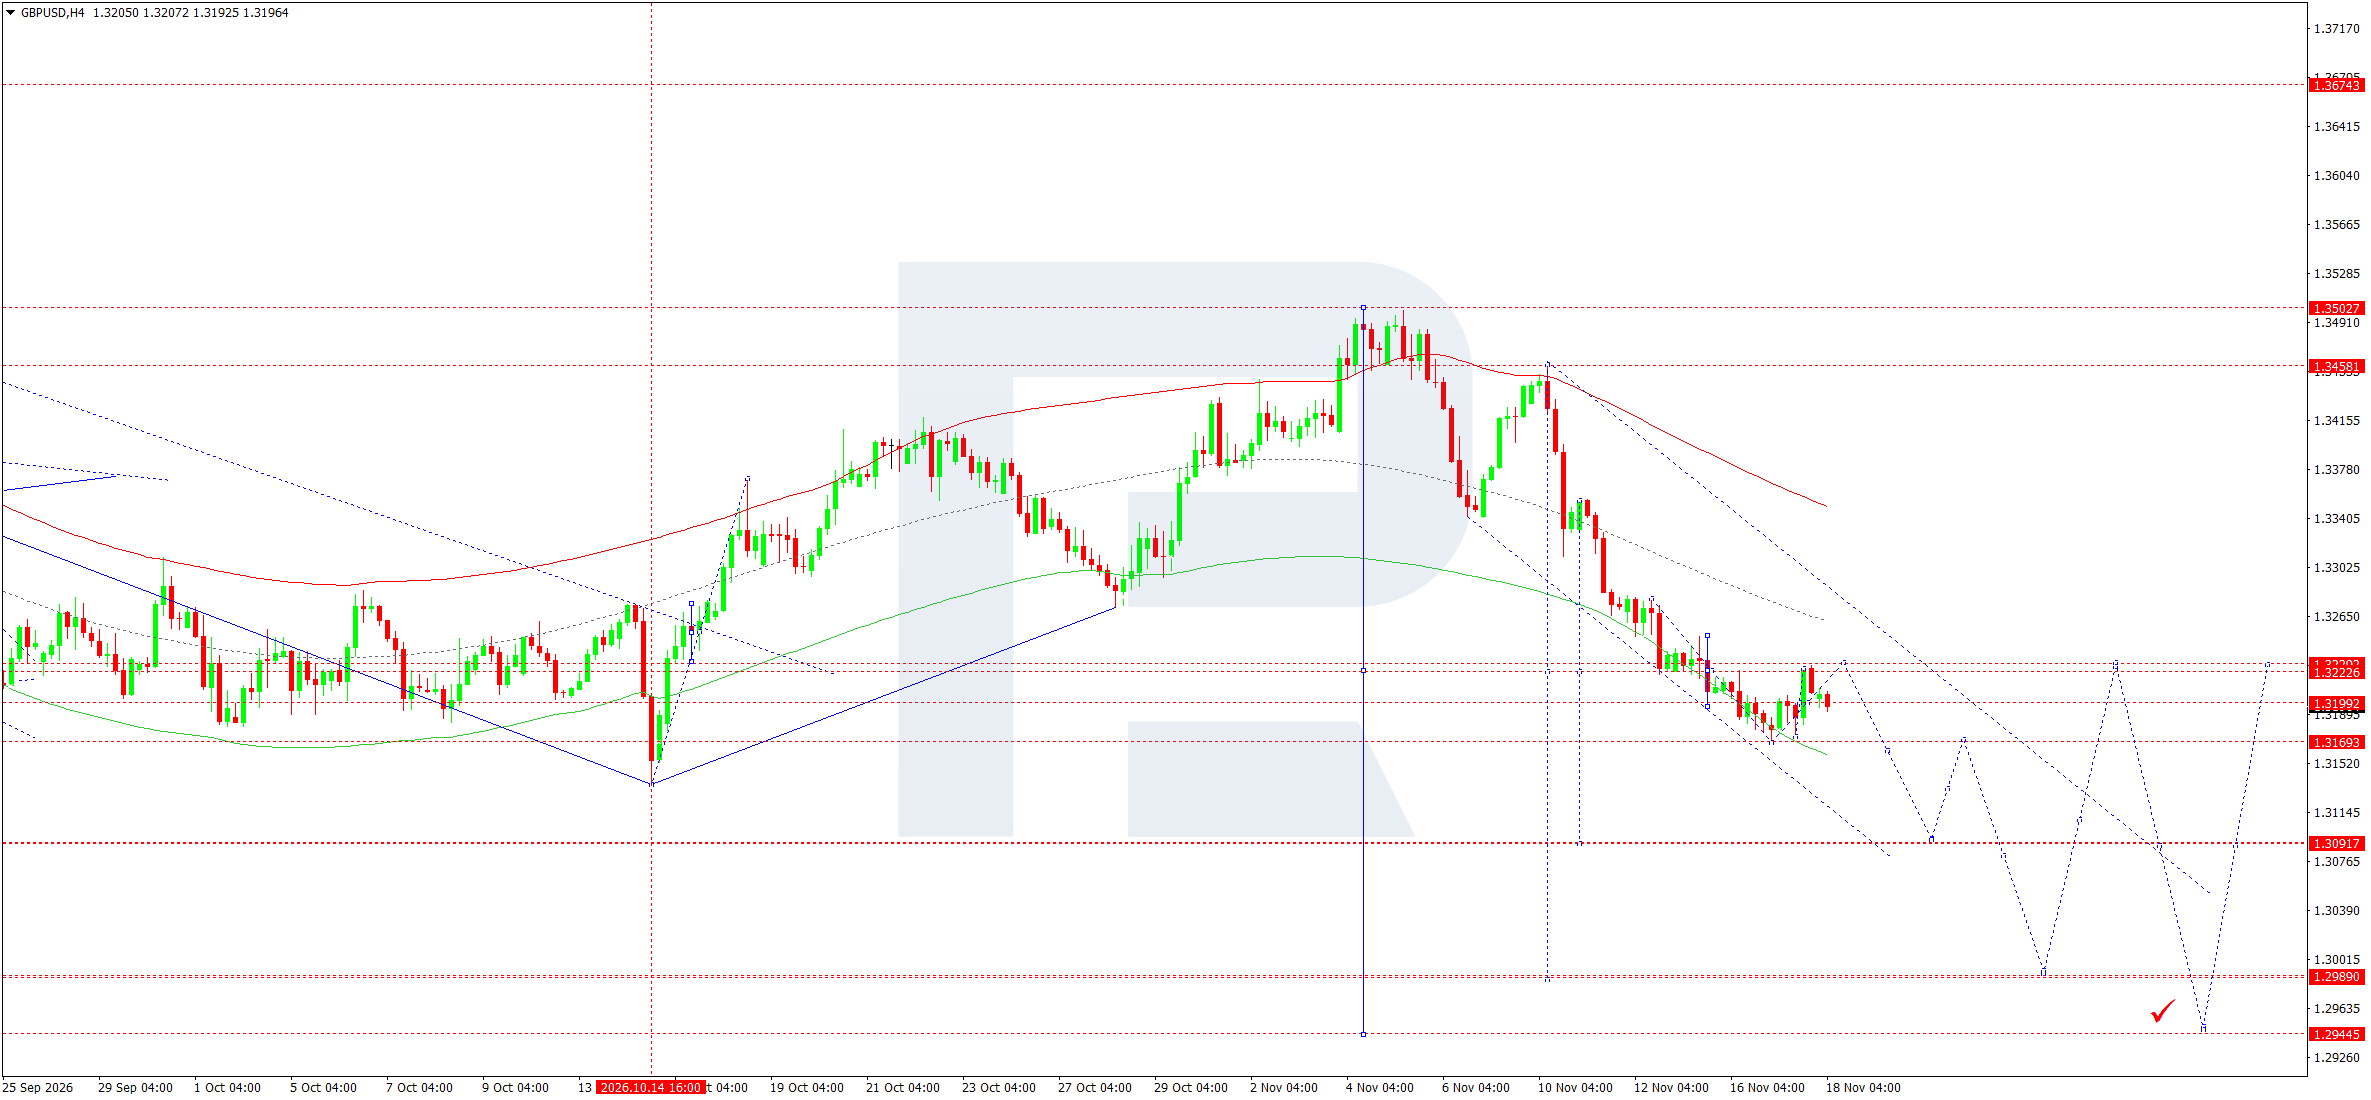
On the H4 chart, GBPUSD maintains a series of lower highs following the reversal from 1.3503. The latest rebound from the 1.3169 area encountered selling pressure in the 1.3223–1.3229 zone, and the price returned below 1.3199. Another approach to 1.3228 is possible during the session. If buyers cannot hold this area, a return towards 1.3169 is expected. A move below it would increase the likelihood of a test of 1.3145. Once this level is breached, the next target would be 1.3092, marked on the chart as a reference level for the downward projection.
In the Elliott Wave count, the rebound fits into a corrective wave. The working wave matrix pivot is around 1.3250. Consolidation above 1.3229 would weaken the day's selling scenario and increase the likelihood of a return towards 1.3250. On approaching 1.3092, an opposing reaction towards 1.3160 is possible.
The 1.2989 area remains a more distant target, which would become relevant following a sustained move below 1.3092. The entry is designed to capture a continuation of the move after a return below 1.3199, while the stop loss is placed beyond the upper boundary of the nearest resistance zone.
GBPUSD forecast scenario
AUDUSD forecast
In November, the Reserve Bank of Australia raised its target interest rate to 4.85%. The published minutes noted that inflation remains high and could stay above the target range for longer than previously expected. Factors cited included higher fuel and commodity prices as well as domestic price pressures. Australia's high interest rate supports the appeal of local-currency instruments, but the October employment report is still due. The most recently published seasonally adjusted unemployment rate was 4.7% in September. The upcoming data will be important for assessing how far the labour market allows the RBA to continue tightening.
During the session, AUDUSD will be sensitive to the Fed minutes and changes in global risk appetite. If US yields rise, the Australian interest rate advantage may provide only limited support for the pair. Conversely, gains in industrial metals and resilience in Asian equity markets could boost corrective demand for the Australian dollar. Simultaneous US dollar appreciation and falling commodity prices would make another test of local support more likely. The pair's response to external markets is especially important ahead of Australia's employment report.
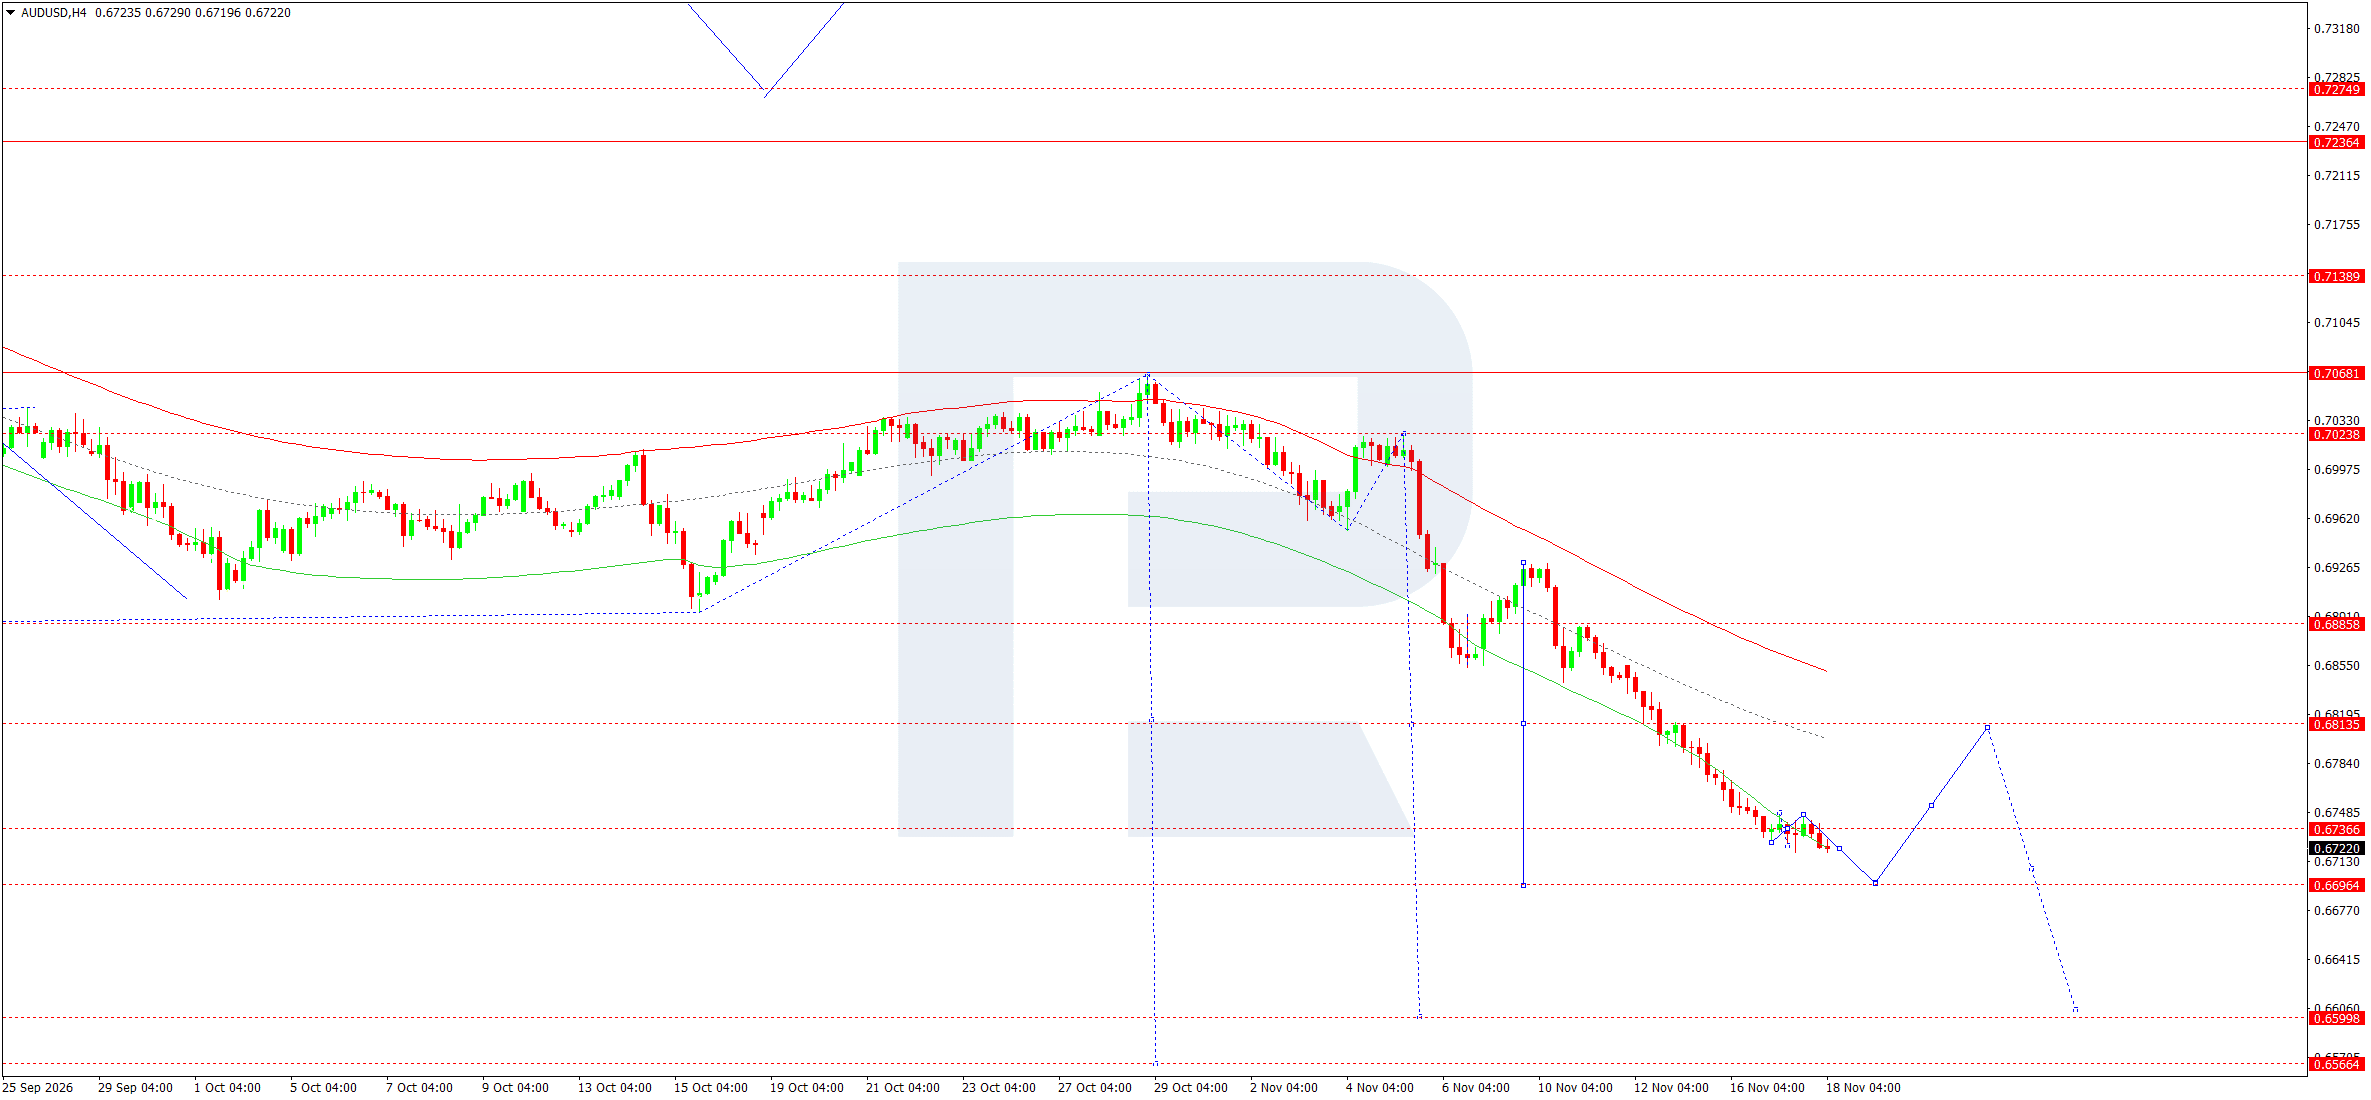
On the H4 chart, the downtrend from the October high at 0.7068 remains intact. After moving through 0.6814, the price continued to form lower highs and lower lows, while a brief consolidation around 0.6734 ended with a return below 0.6737. The nearest target for 18 November is at 0.6696. If it holds, a rebound towards 0.6740 is possible. A return above this area, confirmed by an H4 candlestick close, would improve the technical outlook for a broader correction, with an upside target at 0.6814.
The pivot of the bearish wave matrix is at 0.6813. The slope of the Price Envelope lines and the sequence of highs support the bearish interpretation of the Elliott Wave count. The trading scenario covers the nearest leg of the move towards 0.6696.
An approach to this support could trigger short-covering, so the target is set at the nearest level. Consolidation below it would bring 0.6600 and 0.6566 into focus as the next targets. A return above 0.6742 would cast doubt on an immediate continuation of the decline and create conditions for a correction.
AUDUSD forecast scenario
USDCAD forecast
At the end of October, the Bank of Canada raised its overnight rate by a quarter of a percentage point to 2.50%, seeking to contain the spread of energy-driven price pressures. Data published on 16 November showed that Canada's annual inflation remained at 3.1%, while the measure excluding energy slowed from 2.1% to 2.0%. Petrol prices fell by 2.5% over the month despite their substantial year-on-year increase. This pattern of inflation gives the BoC reason to monitor the secondary effects of rising energy costs, but weakens the case for immediately raising rates in response to the headline index.
The difference between US and Canadian interest rates continues to favour the US dollar. If the Fed minutes reinforce expectations of further tightening, USDCAD would gain fundamental support as it tests its November high. The second factor for the session is oil. The US Energy Information Administration estimated the average October Brent price at USD 124 per barrel. Future commodity price dynamics matter for the Canadian dollar: another rise in oil prices could support the currency through export revenues, while a decline in oil would amplify the influence of the interest rate differential.
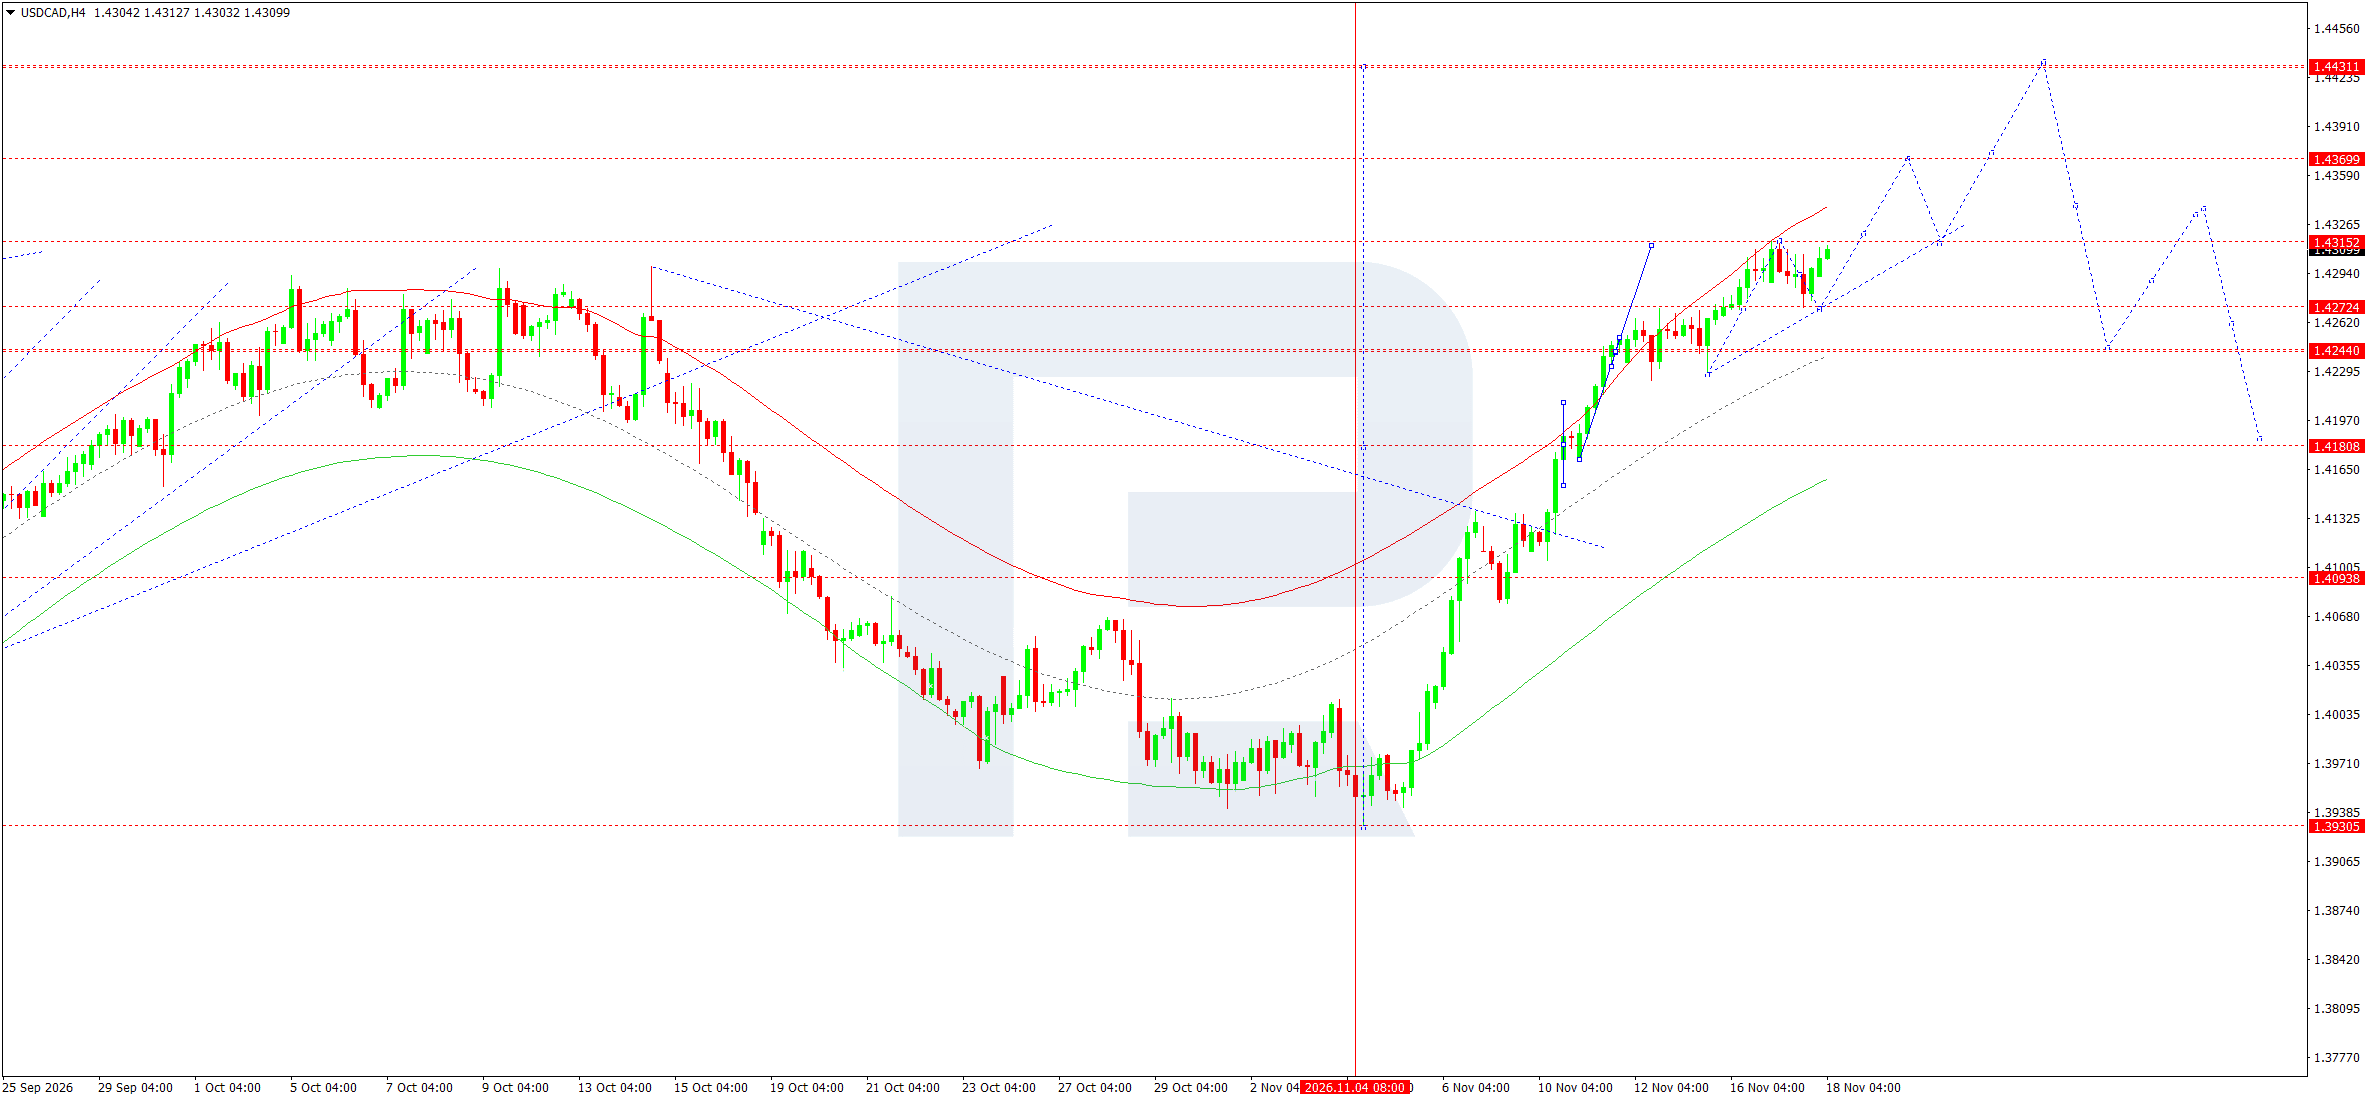
On the H4 chart, USDCAD recovered from its November low of 1.3931 and rose towards 1.4315. The latest pullback stalled near 1.4272, after which the price approached resistance again. A tight consolidation below 1.4315 is likely during the session. Holding above 1.4300 on another approach to the high would preserve the possibility of a breakout. Following consolidation above 1.4315, the nearest target lies in the 1.4369–1.4370 area. The initial touch of resistance could be accompanied by a brief return below the entry level.
The Elliott Wave count maintains a sequence of rising prices, with the working wave matrix pivot around 1.4160. The 1.4370 area is the nearest target of the upward projection. Once it is reached, a return towards 1.4315 is possible.
If former resistance holds as support, the next target lies around 1.4431. If the breakout fails and the price falls below 1.4291, the day's trading scenario will be invalidated. In that case, a retest of the 1.4272 level is likely, and a break below it would increase the likelihood of a correction towards 1.4244.
USDCAD forecast scenario
XAUUSD forecast
The outlook for gold is shaped by US interest rate expectations and movements in real yields. In its 16 November review, the World Gold Council noted that the yield on 10-year US inflation-protected bonds had risen by approximately 30 basis points since the beginning of the month. Higher real yields increase the opportunity cost of holding gold. A stronger dollar adds further pressure, as the metal becomes more expensive in other currencies. Together, these factors help explain why elevated US inflation can coincide with falling gold prices.
The release of the Fed minutes remains the key event of the session. October's 0.4% monthly increase in consumer prices and disagreements in the latest vote keep yields sensitive to discussion of further tightening. A more cautious interpretation of the minutes could weaken the dollar and facilitate a corrective rise in the metal. A separate source of support comes from geopolitical risks in the Middle East. Stronger demand for safe-haven assets could trigger a rapid rebound, especially if real yields also decline. The combination of these conditions would matter more for gold than a change in any single indicator.
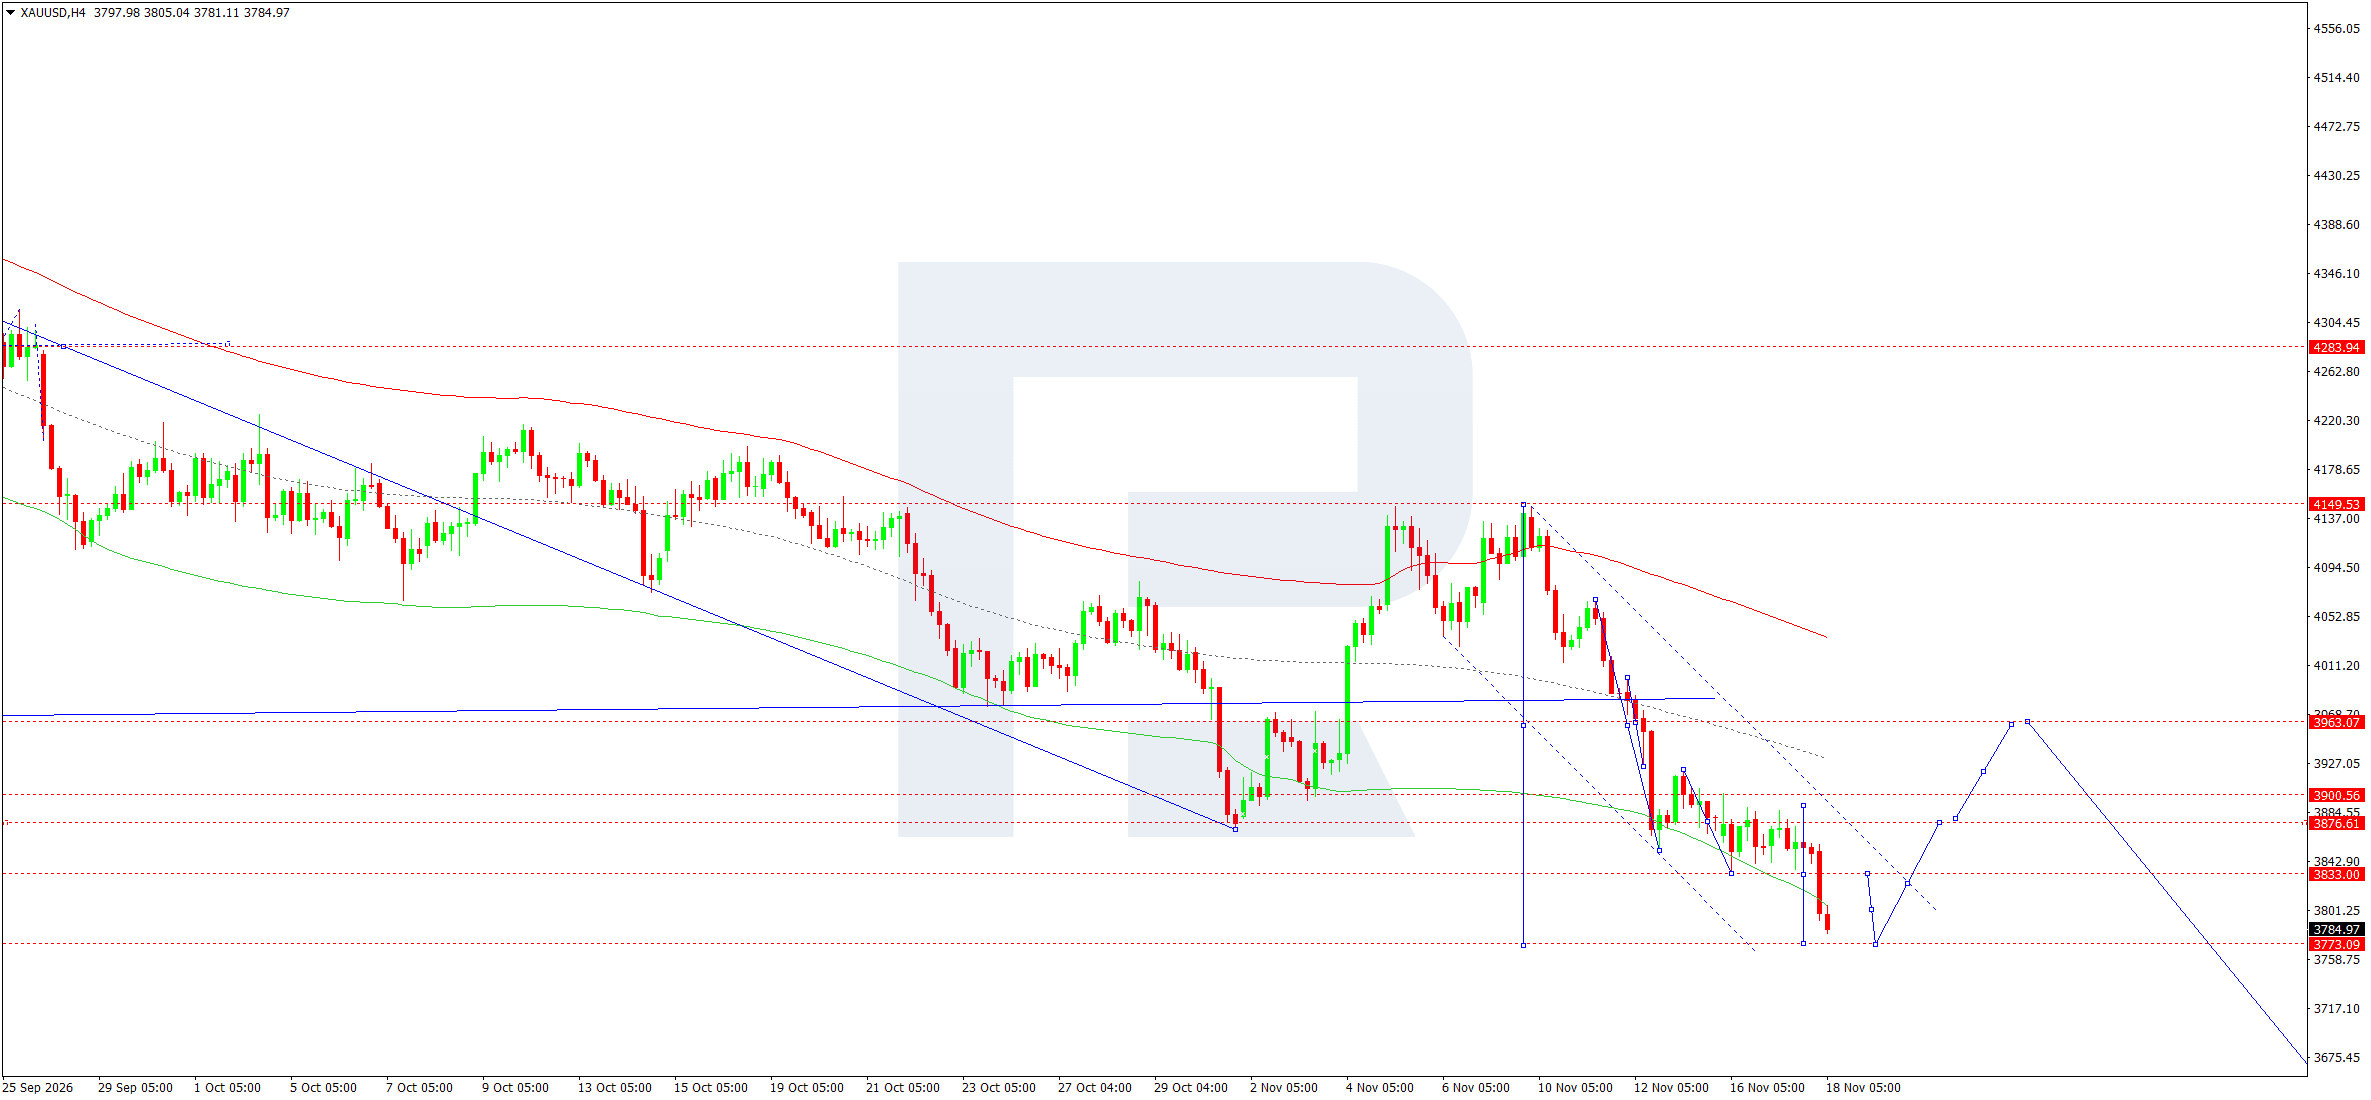
On the H4 chart, gold broke below 3,833 and fell into the 3,780 area, approaching the marked support at 3,773. The latest candlesticks remain near the lower end of the downward move, so a countertrend rebound towards 3,833 is possible during the day. The main scenario envisages that this rebound will fade below former support, followed by another test of the 3,773 level. If the price instead continues to fall directly from current levels, the planned entry on a correction will remain inactive.
In the Elliott Wave count, the decline from 4,150 retains a sequence of lower highs. The working wave matrix pivot is in the 3,960–3,963 area. The 3,773 level is the nearest target of the bearish projection. Conversely, a return above 3,833 with an H4 hold would increase the likelihood of a broader correction towards 3,877 and 3,901.
The 3,963 level would become relevant if both of these marks are breached. For the selling scenario, the stop loss is placed above the retest zone and the nearest candlestick highs around it. An opposing reaction is possible on an approach to 3,773, which is why the target is set at that support.
XAUUSD forecast scenario
US 500 forecast
US retail sales rose by 0.2% month-on-month in October, following a 0.8% increase in September. Sales excluding motor vehicles and petrol grew by 0.5%. The data indicates slower growth in overall turnover while sales continued to rise in some consumer categories. This has mixed implications for the broad index. Resilient demand supports corporate revenues, while persistent inflation pressures increase the likelihood of an extended period of expensive financing. The latter is particularly important for sectors whose valuations depend heavily on future profits.
The forthcoming Fed minutes could shift the balance between these factors. Two participants at the October meeting preferred a rate increase, and the minutes relate to discussions held before October's Consumer Price Index was released. If investors see broader willingness to tighten policy in the document, bond yields could rise and increase pressure on equities. A more subdued response from the rates market would allow the index to recover some of its losses. The breadth of demand matters for the durability of such a recovery: participation across several sectors would provide a stronger foundation than gains in a handful of large companies.
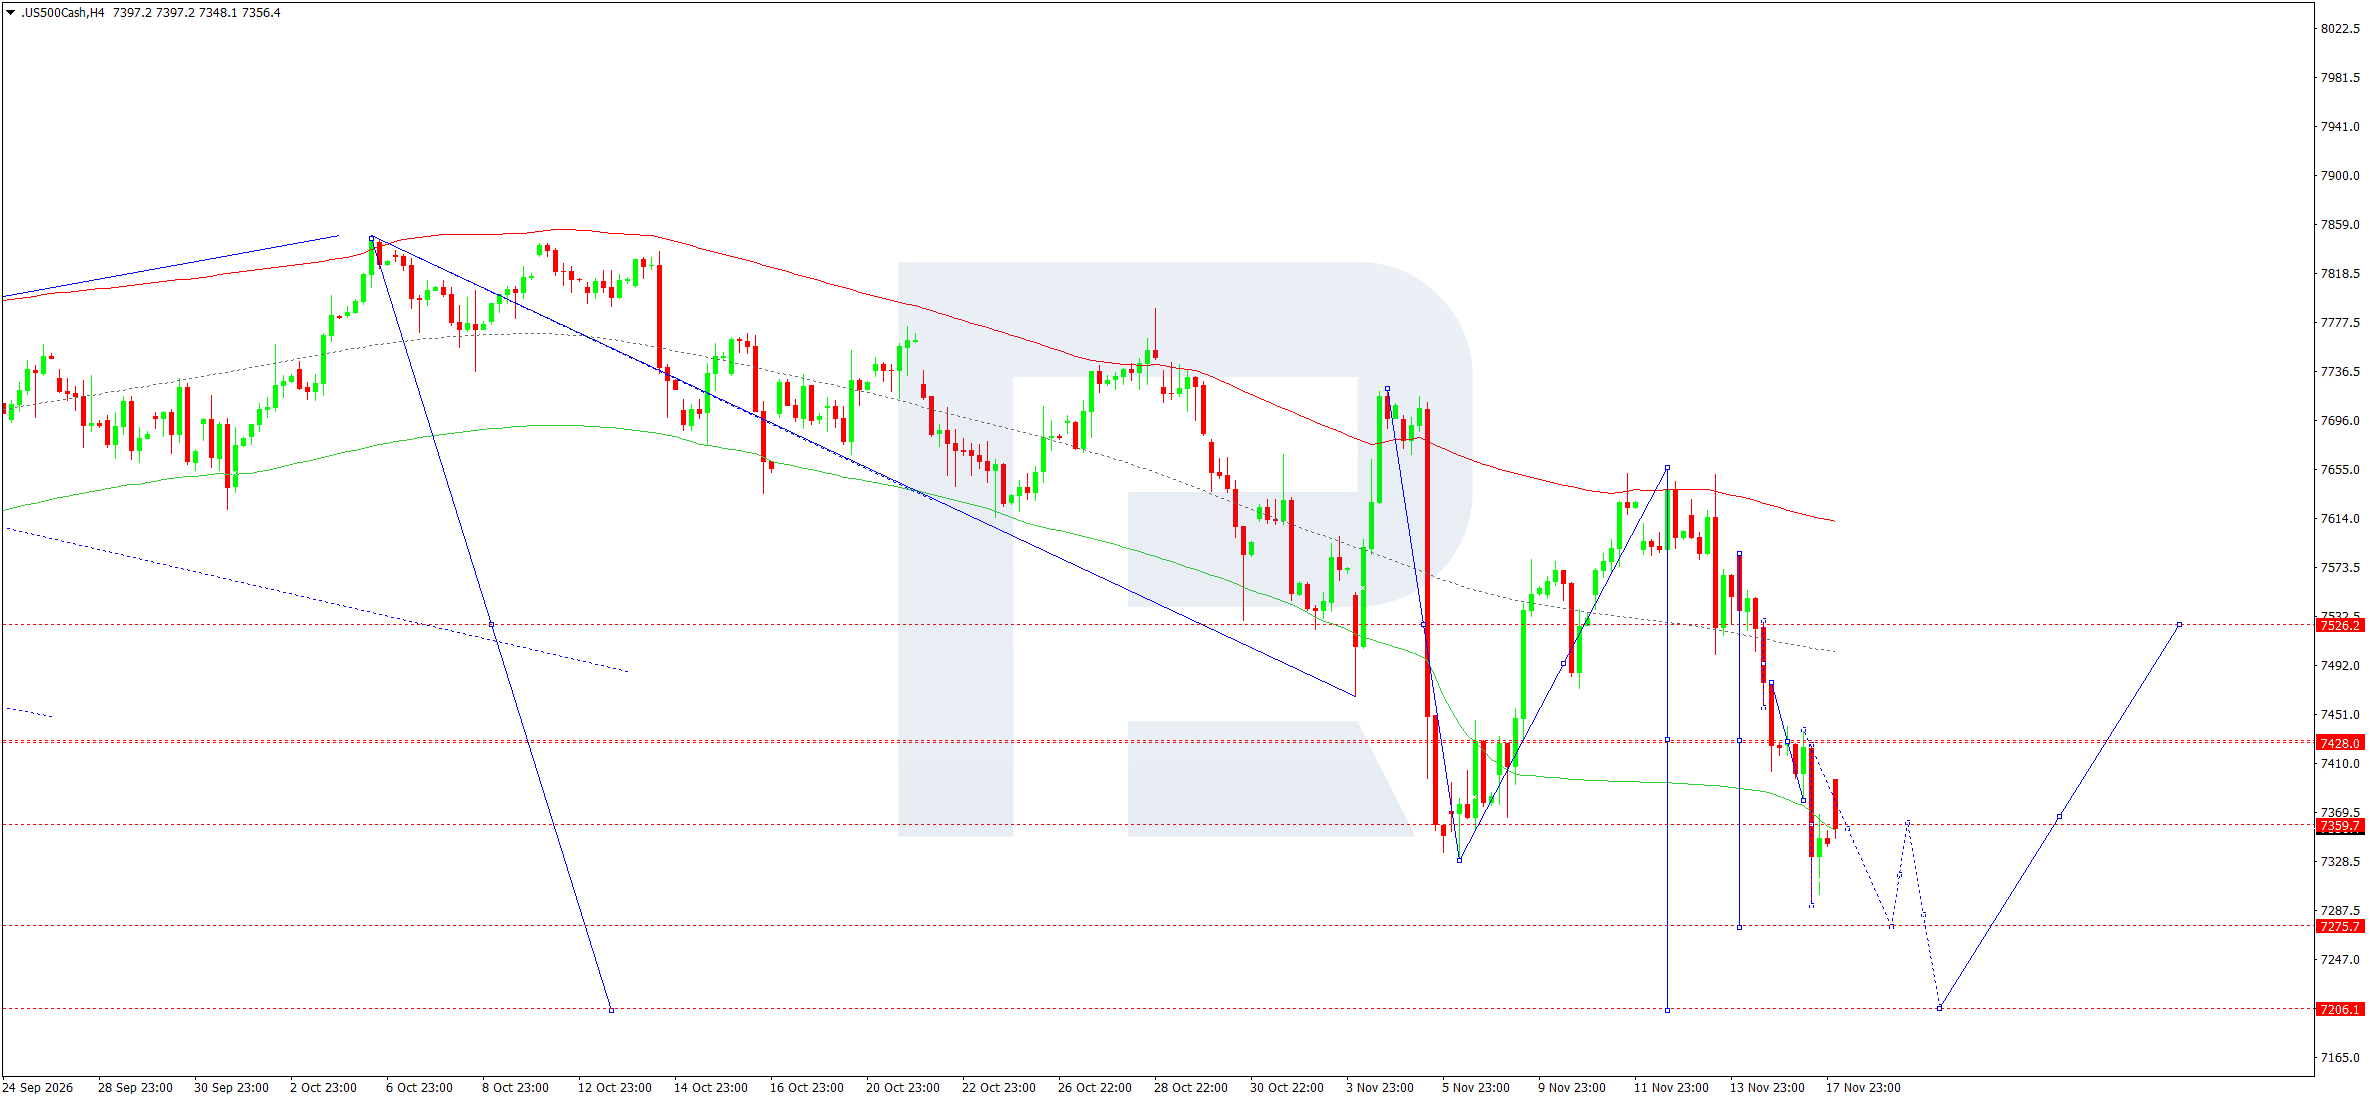
On the H4 chart, the US 500 declined after failing to consolidate above 7,526 and recorded a new local low near 7,292. The subsequent rebound did not bring the price back above 7,428, and the latest quote is just below 7,360. The baseline scenario for the session suggests a brief consolidation around 7,360, followed by a test of 7,292. If buyers fail to defend this area, the nearest marked support is at 7,276. A break below it would create conditions for a move towards 7,206.
In the Elliott Wave count, the structure remains bearish, with the working wave matrix pivot around 7,555. The 7,206 level corresponds to the distant boundary of the bearish projection. On the way there, an opposing reaction from 7,276 could bring the price back towards 7,360.
Consolidation above 7,428 would invalidate the selected scenario of a further decline during the session and increase the likelihood of a recovery towards 7,526. The entry is below 7,360. Reaching the full target would require a break through the two nearest support levels, so the reaction at 7,292 and 7,276 will show whether the downward momentum is being sustained.
US 500 forecast scenario
BTCUSD forecast
For Bitcoin, the session's key macroeconomic factor is linked to expectations for the Fed's policy rate. At the October meeting, the rate remained within the 3.75–4.00% range, although two voting participants preferred an increase. In addition, Federal Reserve Governor Christopher Waller said in November that he would be prepared to consider a 0.50-percentage-point increase in December if inflation developed unfavourably. Higher yields and a stronger dollar following the minutes could reduce demand for highly volatile assets, including Bitcoin. A calmer bond market response would increase the likelihood of a corrective rise.
US sales excluding motor vehicles and petrol rose by 0.5% in October. Resilience in this component of consumption gives the market reason to consider the risk of further tightening even if the headline figure slowed. The reactions of US equities and spot-market demand are important for assessing the resilience of a Bitcoin rebound. A rise accompanied by recovering equities and falling yields would have broader market support. If the price recovers while risk assets remain under pressure, the likelihood of another test of recent lows after the rebound ends would increase.
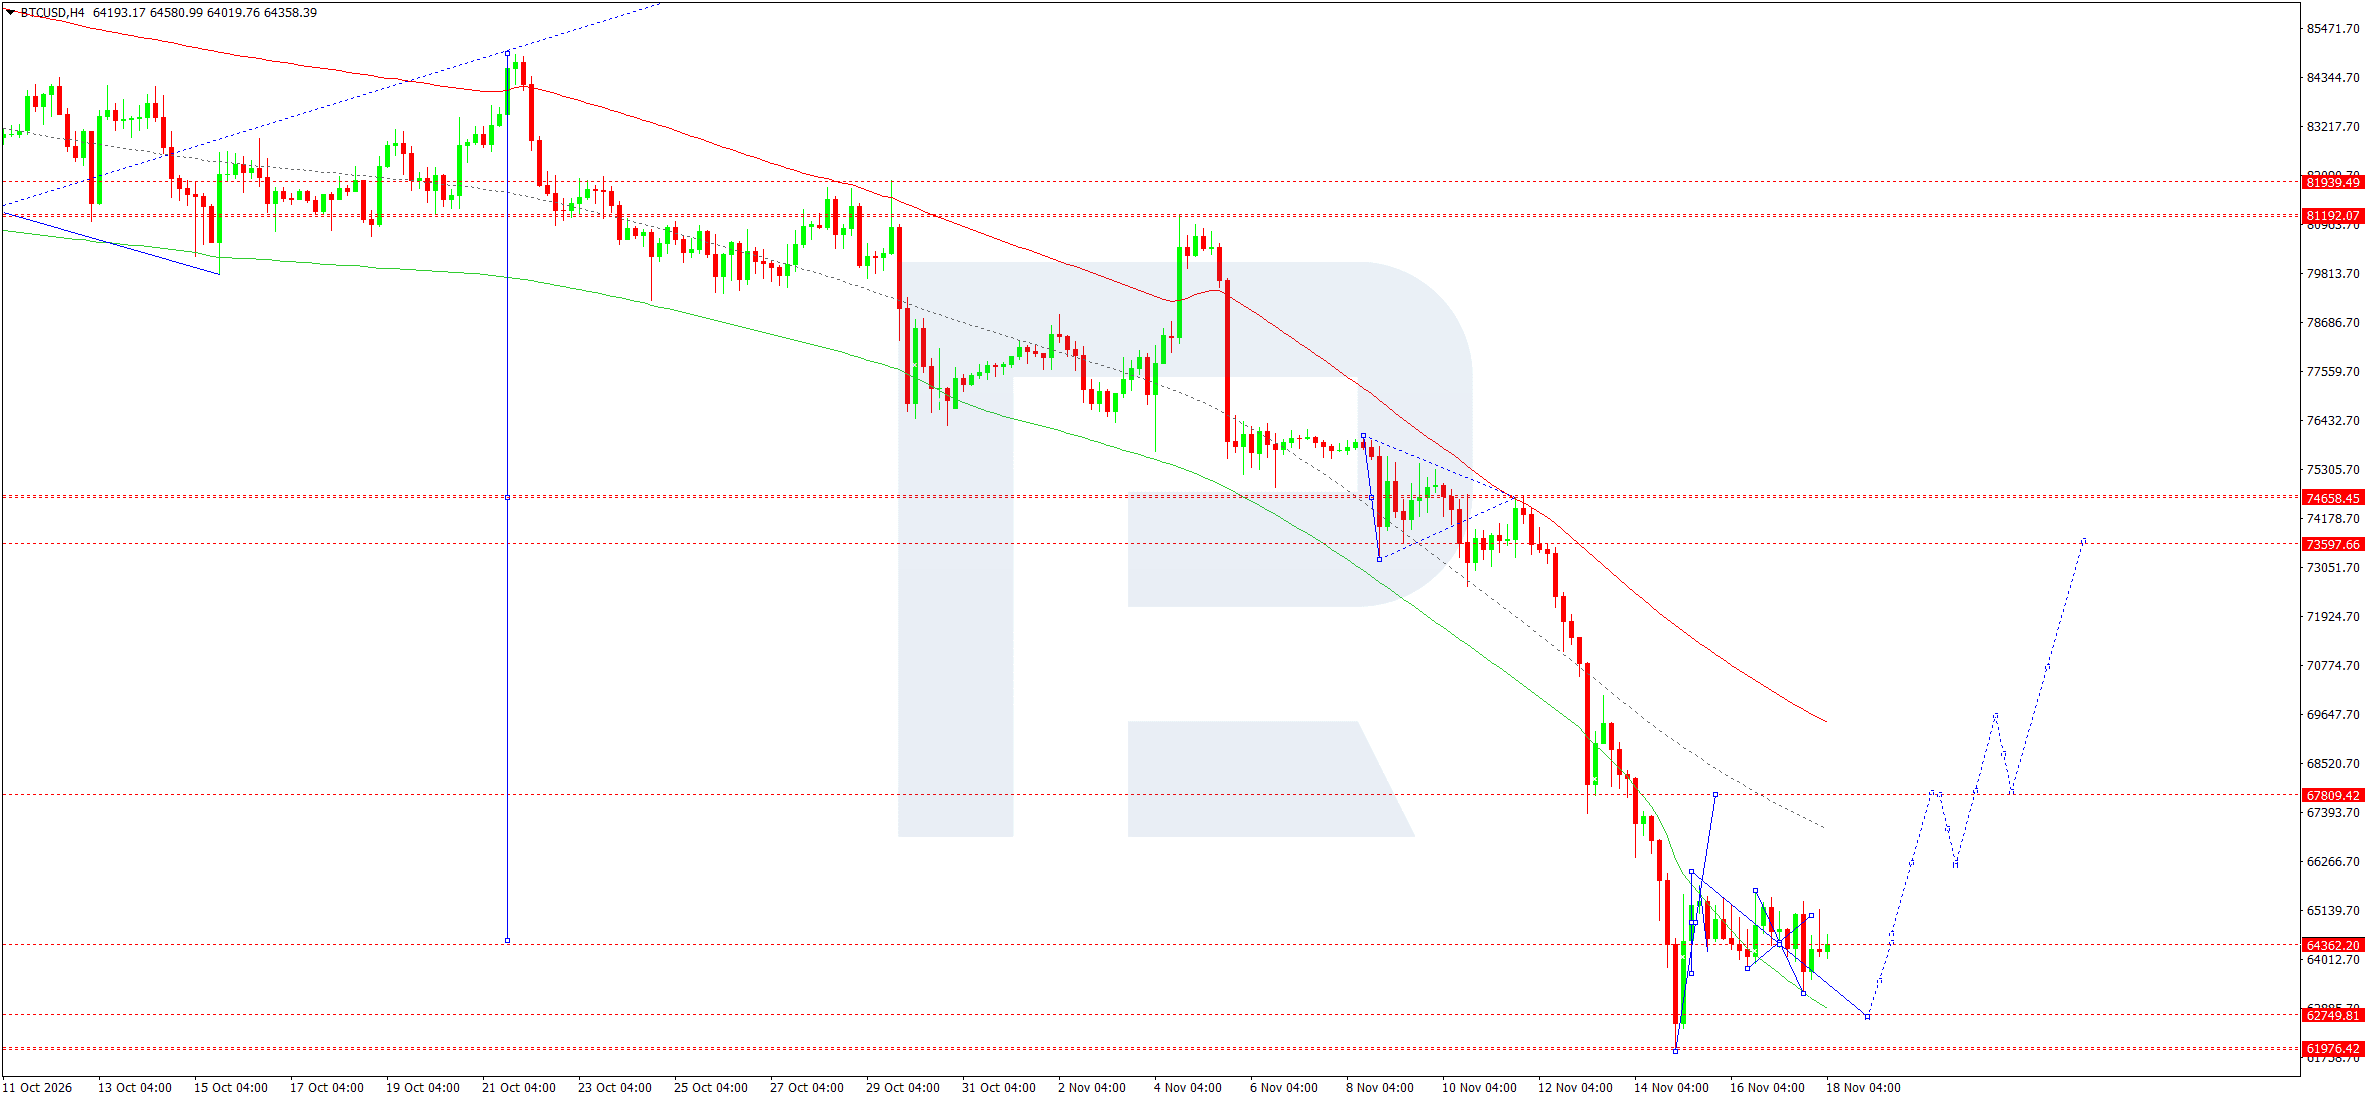
On the H4 chart, BTCUSD is consolidating after a sharp decline towards the 61,976 area and a subsequent recovery. Within the range, the quote is holding near 64,362, while the 63,225 area serves as local support for the latest candlesticks. The baseline scenario for 18 November suggests a rise towards 65,000. If the price encounters selling pressure when testing this area, a return towards 64,362 and then 63,225 is likely. A break below the latter level would open the way towards 62,750, the nearest marked target of the downward leg.
In the Elliott Wave count, the current consolidation fits into a correction following the downward impulse. The working wave matrix pivot is around 74,819. The reaction to 65,000 remains decisive for the session.
A sustained H4 close above 65,650 would invalidate the selling scenario and open the possibility of a recovery towards 67,809. If 62,750 is reached first, a correction from that support level would remain possible, and the planned entry around 65,000 would not be triggered. Consolidation below 62,750 would bring the more distant 61,976 level back into focus. The target is placed at the nearer of these two support levels.
BTCUSD forecast scenario
Editors’ picks


EURUSD forecast 2026–2027: technical analysis, price levels & predictions
The EURUSD outlook for 2026 and 2027: key levels on the daily chart, three trading scenarios and the policy gap between the Fed and the ECB that drives the pair.

Gold (XAUUSD) forecast 2026: technical analysis, price levels & predictions
Where gold could trade in 2026: key levels, three trading scenarios with entry triggers and the forecasts from J.P. Morgan, Deutsche Bank and Goldman Sachs.
Forecasts presented in this section only reflect the author’s private opinion and should not be considered as guidance for trading. RoboForex bears no responsibility for trading results based on trading recommendations described in these analytical reviews.