
Daily technical analysis and forecast for 19 November 2026
Daily technical analysis and forecast for EURUSD, USDJPY, GBPUSD, AUDUSD, USDCAD, XAUUSD, US 500, and BTCUSD for 19 November 2026.
Each scenario on this page reflects the market structure on the H4 chart as of 10:00 AM UTC+2 on 19 November 2026. The assessment considers the current H4 chart structure, key support and resistance levels, the direction of the medium-term movement, and the prevailing fundamental backdrop.
EURUSD forecast
The minutes published on 18 November showed that two participants at the US Federal Reserve meeting had favoured a rate increase as early as October. The majority kept the rate within the 3.75–4.00% range. The possibility of further tightening in December supports demand for the dollar. For EURUSD, the reaction of short-term US yields to new data is important. If they rise, the advantage of dollar-denominated instruments will strengthen. Falling yields, conversely, could give the euro an opportunity to recover some of its November losses.
On 29 October, the European Central Bank kept its deposit rate at 2.50%. According to Eurostat data released on 18 November, annual inflation in the eurozone accelerated from 3.8% to 4.0%. Energy contributed approximately 1.89 percentage points to the headline figure. Higher inflation provides grounds for expecting hawkish ECB rhetoric, but rising energy costs simultaneously worsen conditions for European businesses and households. Therefore, the resilience of a potential euro rebound will depend on whether this release leads to a significant convergence of interest rate expectations in the eurozone and the US.
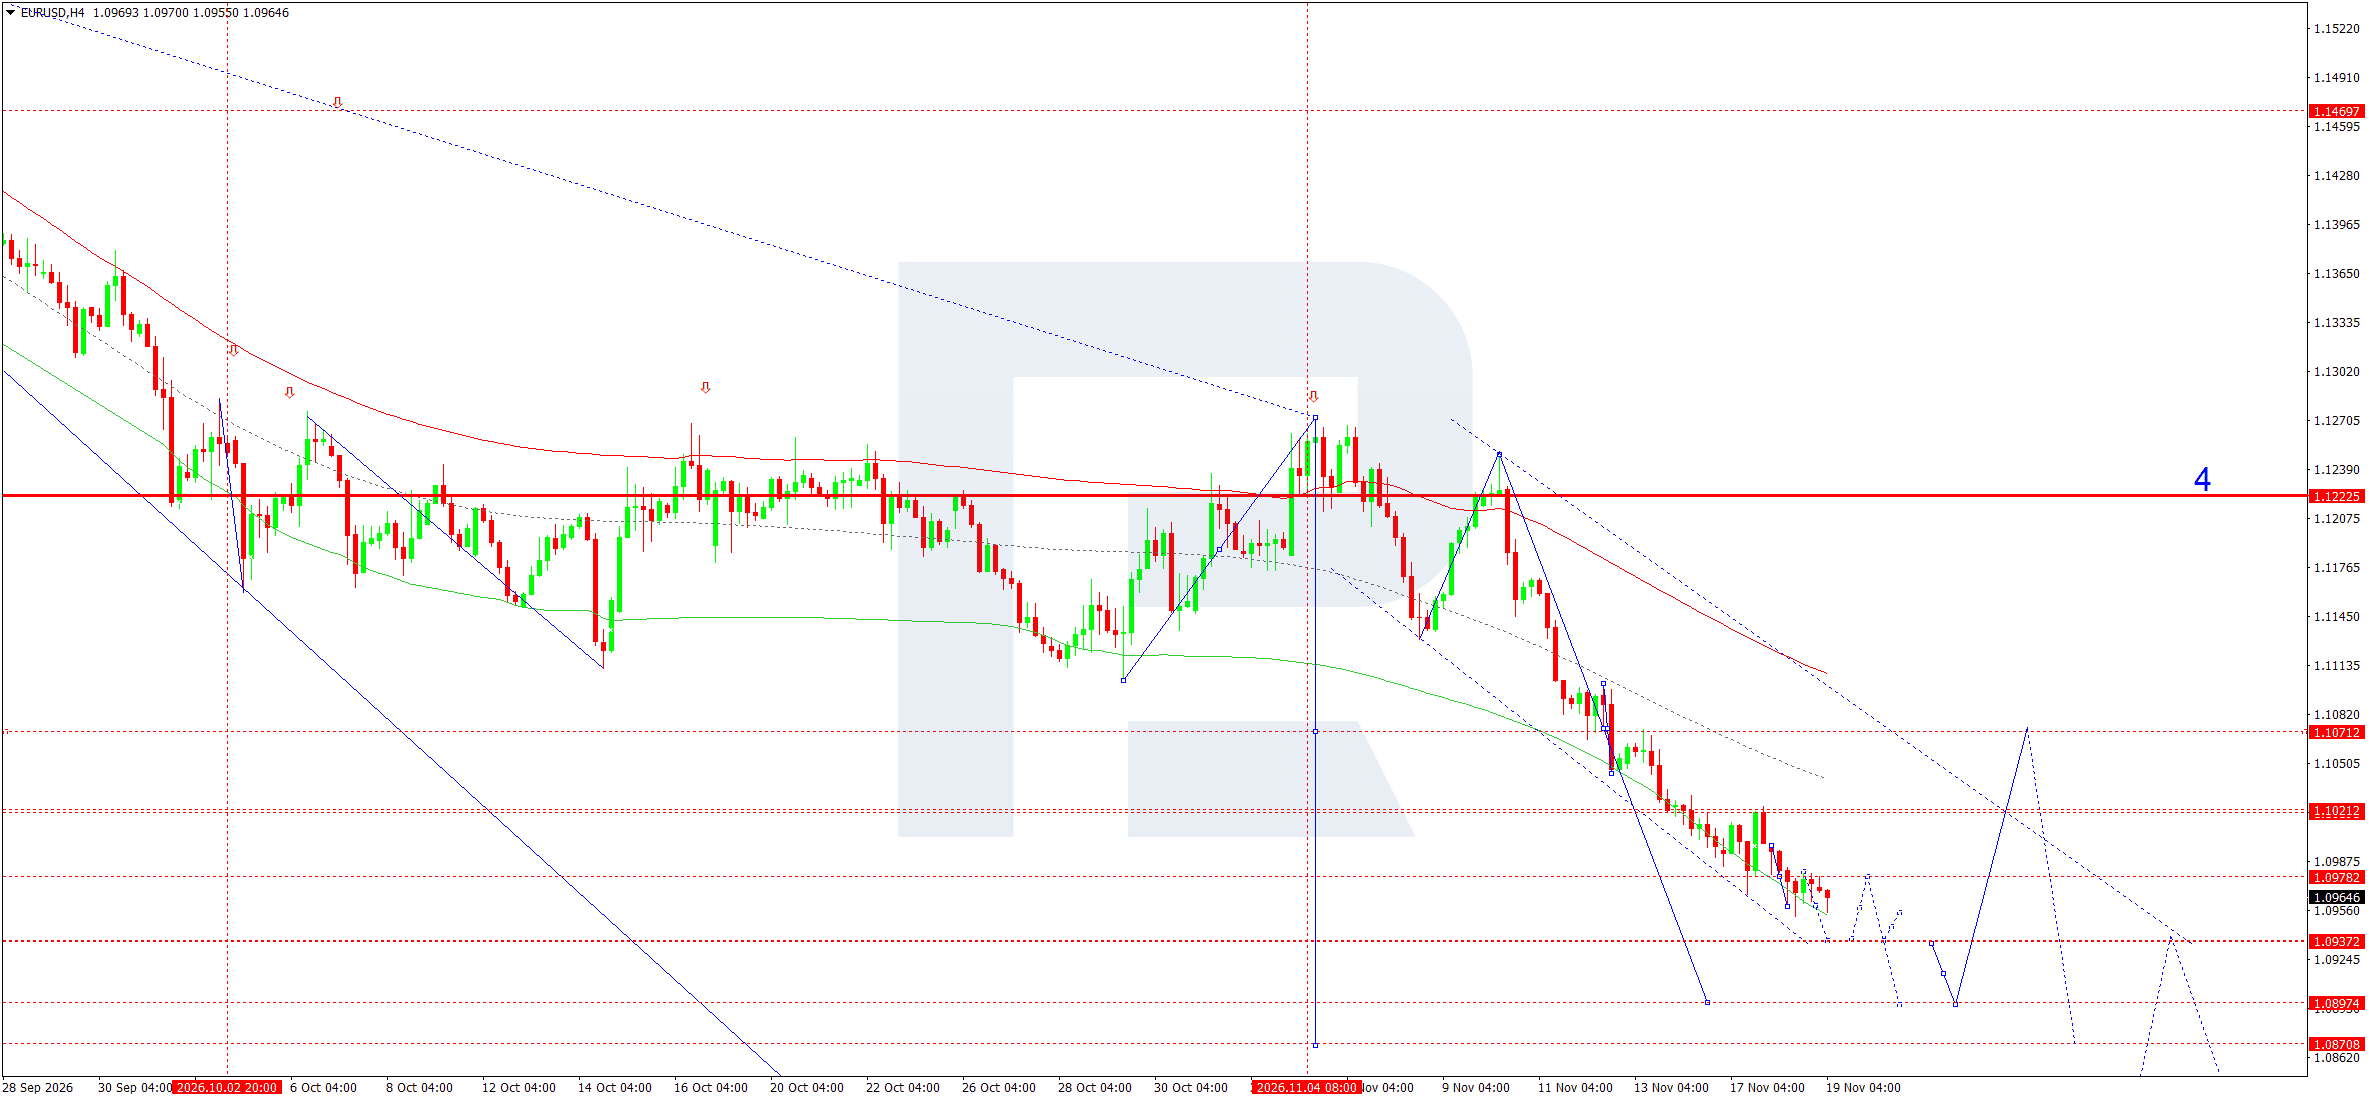
On the H4 chart, the sequence of lower highs remains intact. After declining to 1.0955, the price remains below 1.0978. For 19 November, the baseline scenario suggests a return to this resistance, followed by an attempt by sellers to break below 1.0960 and test the 1.0937 support level. If support holds, consolidation and a retest of 1.0978 could follow. An H4 close above this resistance would increase the likelihood of a deeper correction towards 1.1021.
In the Elliott wave count, the 1.1222 level serves as the pivot of the bearish wave matrix. The downward slope of the Price Envelope is consistent with the direction of the move, while the 1.0897 and 1.0871 levels belong to the next stage of the wave projection. They become relevant if the price consolidates below 1.0937 and subsequently retests this level weakly.
The trading scenario targets the nearest support, where buyers may already react. The entry breakout requires a move below the local range, while a return to 1.0973 after activation would indicate that the momentum is weakening.
EURUSD forecast scenario
USDJPY forecast
On 30 October, the Bank of Japan kept its overnight interest rate target at around 1.25%. One board member preferred to raise it to 1.50%. The difference between Japanese and US interest rates continues to favour the dollar. The Fed minutes published on 18 November increased attention to the possibility of another US rate increase, while the yield on two-year Treasury securities remained at 4.80%. As long as this differential persists, USDJPY pullbacks may attract buyers, especially if US data support expectations of further tightening.
Near 160.00, the pair becomes increasingly sensitive to statements by Japanese authorities about the pace of yen depreciation. A sharp acceleration in the exchange rate could prompt position reductions even without changes in interest rates. A reassessment of the timing of the BoJ's next move remains another source of price movements. If the market brings forward the expected date of a Japanese rate increase, the yen will receive support. In periods of rising risk aversion, the unwinding of yen-funded positions could also cause the pair to decline. Therefore, the price reaction in the 159.90–160.00 area is important for assessing the resilience of bullish momentum.
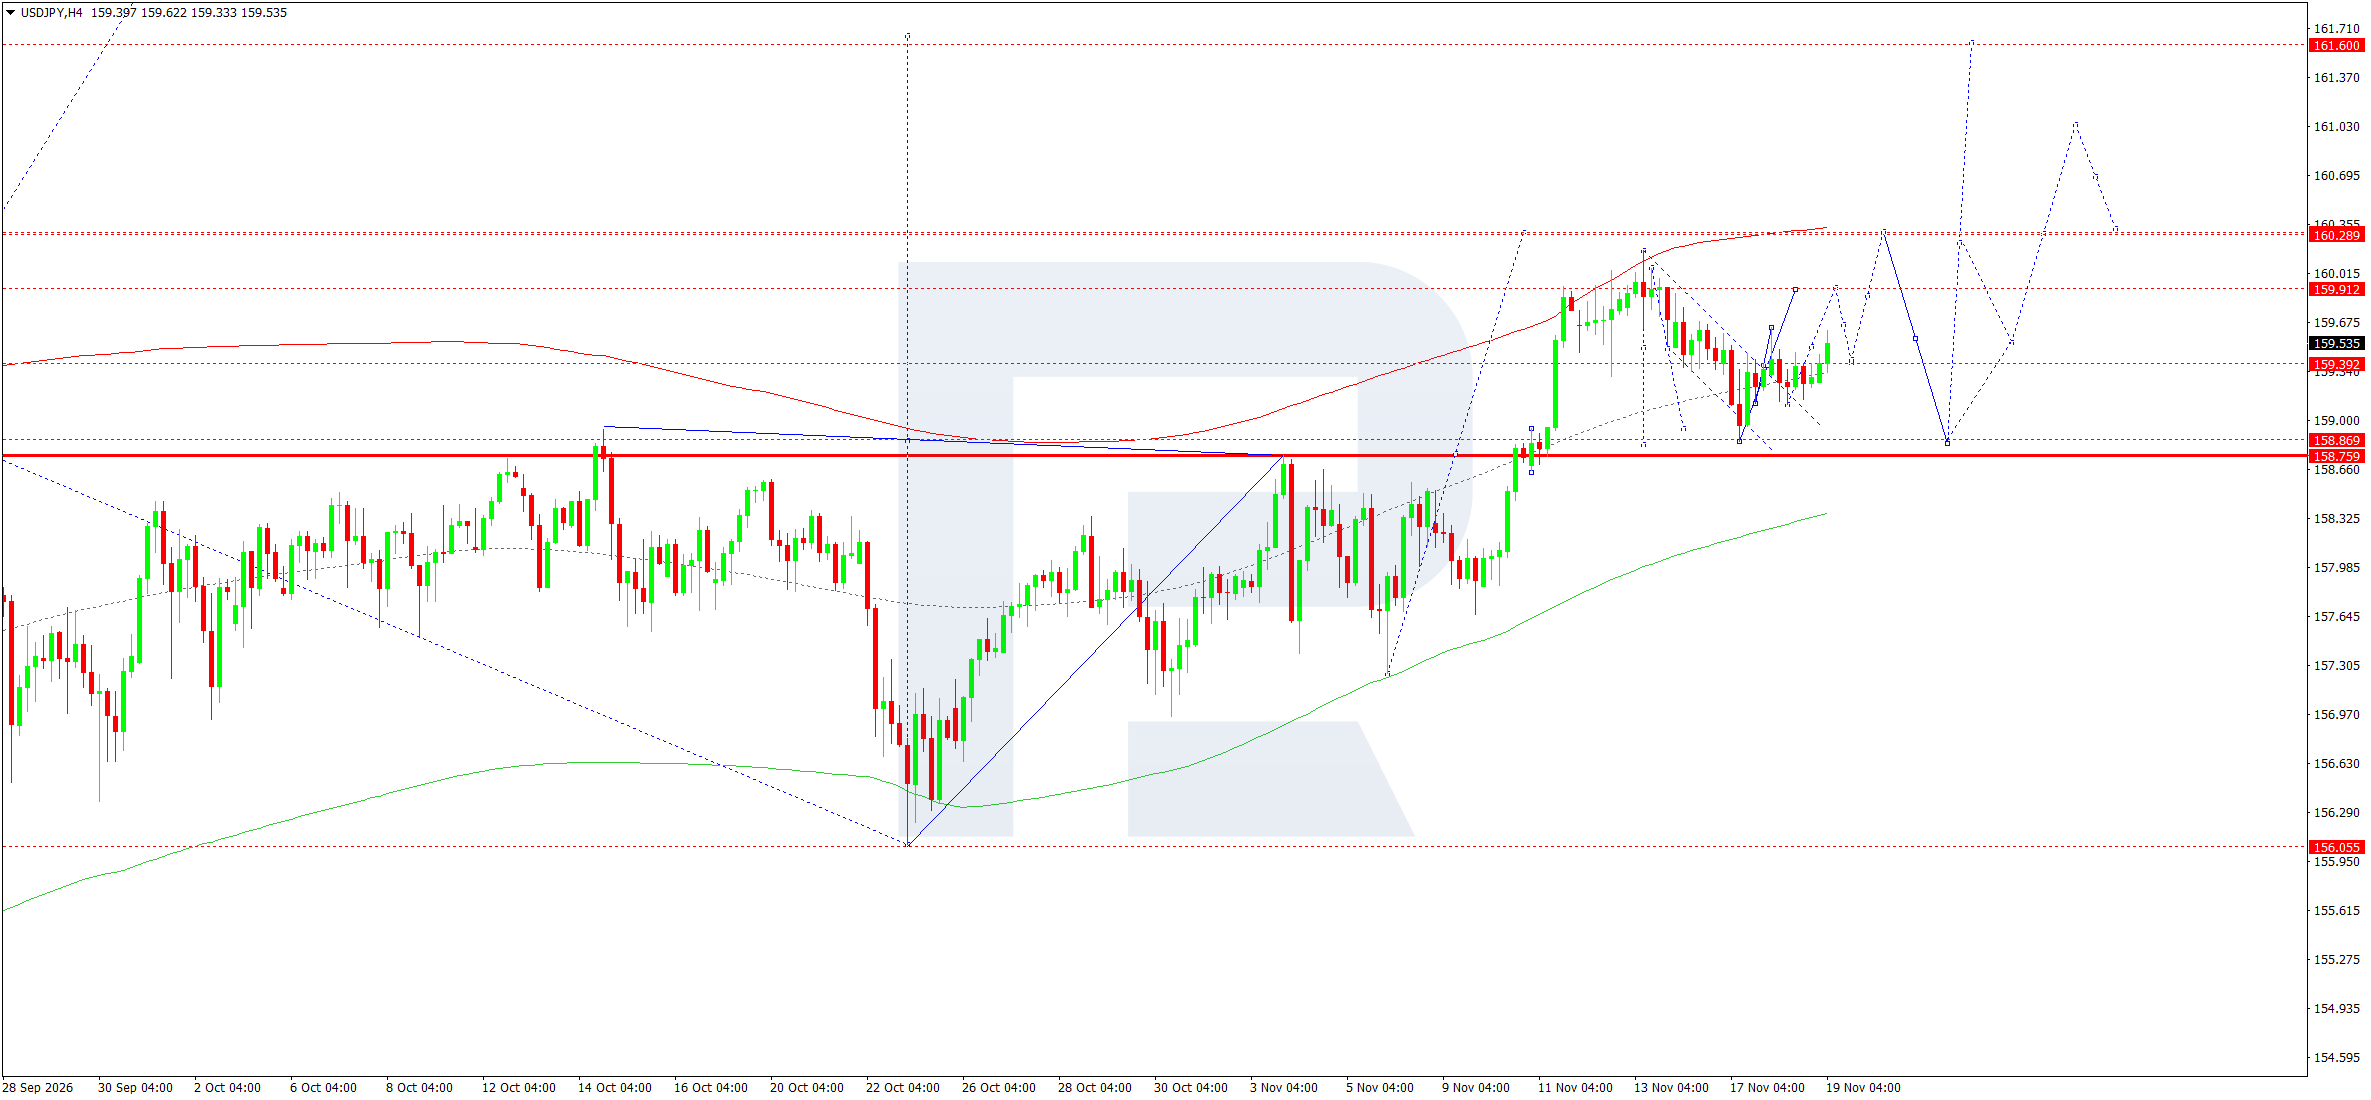
On the H4 chart, following the decline towards 158.87 and a recovery above 159.39, an attempt to resume growth is forming. The quote at 159.54 lies between the nearest support and resistance at 159.91. The main scenario for 19 November envisages a test of 159.91 after a breakout from the local consolidation. On the first approach, a pullback towards 159.39–159.30 is possible. If buyers defend this area or the price consolidates above 159.91, the next target will be 160.29.
The level around 158.80 in the bullish wave matrix lies within the 158.76–158.87 zone marked on the chart. In the Elliott wave interpretation, a return to 159.39 would be consistent with a correction following the rise towards 159.61. The upper boundary of the Price Envelope on the chart runs near 160.29, providing an additional target for further growth.
The trade entry is designed for a break above the local high, with the stop loss placed below 159.39. The 160.29 target depends on a break above intermediate resistance. If an early reversal occurs at 159.91, another test of the 159.39 level will assess buyers' strength.
USDJPY forecast scenario
GBPUSD forecast
Annual consumer inflation in the UK rose from 3.5% to 3.6% in October, while prices increased by 0.5% over the month. According to data released on 18 November, transport, particularly motor fuel, made the largest contribution to the acceleration in the annual figure. The Bank of England had previously raised its policy rate by 25 basis points to 4.00%. Persistent inflation leaves open the possibility of another hike in December, although higher energy and transport costs restrict households' purchasing power.
The key factor for the pound is the extent to which UK interest rate expectations shift relative to those in the US. The Fed minutes showed that some policymakers had already favoured a hike in October. If US yields continue to reflect the likelihood of tightening, it will be harder for the UK inflation surprise to produce a sustained appreciation in GBPUSD. During the day, an increase in UK bond yields relative to US yields could support sterling. If interest rates rise on both sides of the Atlantic, pressure from a strong dollar may persist, especially when demand for cyclical assets is weak.
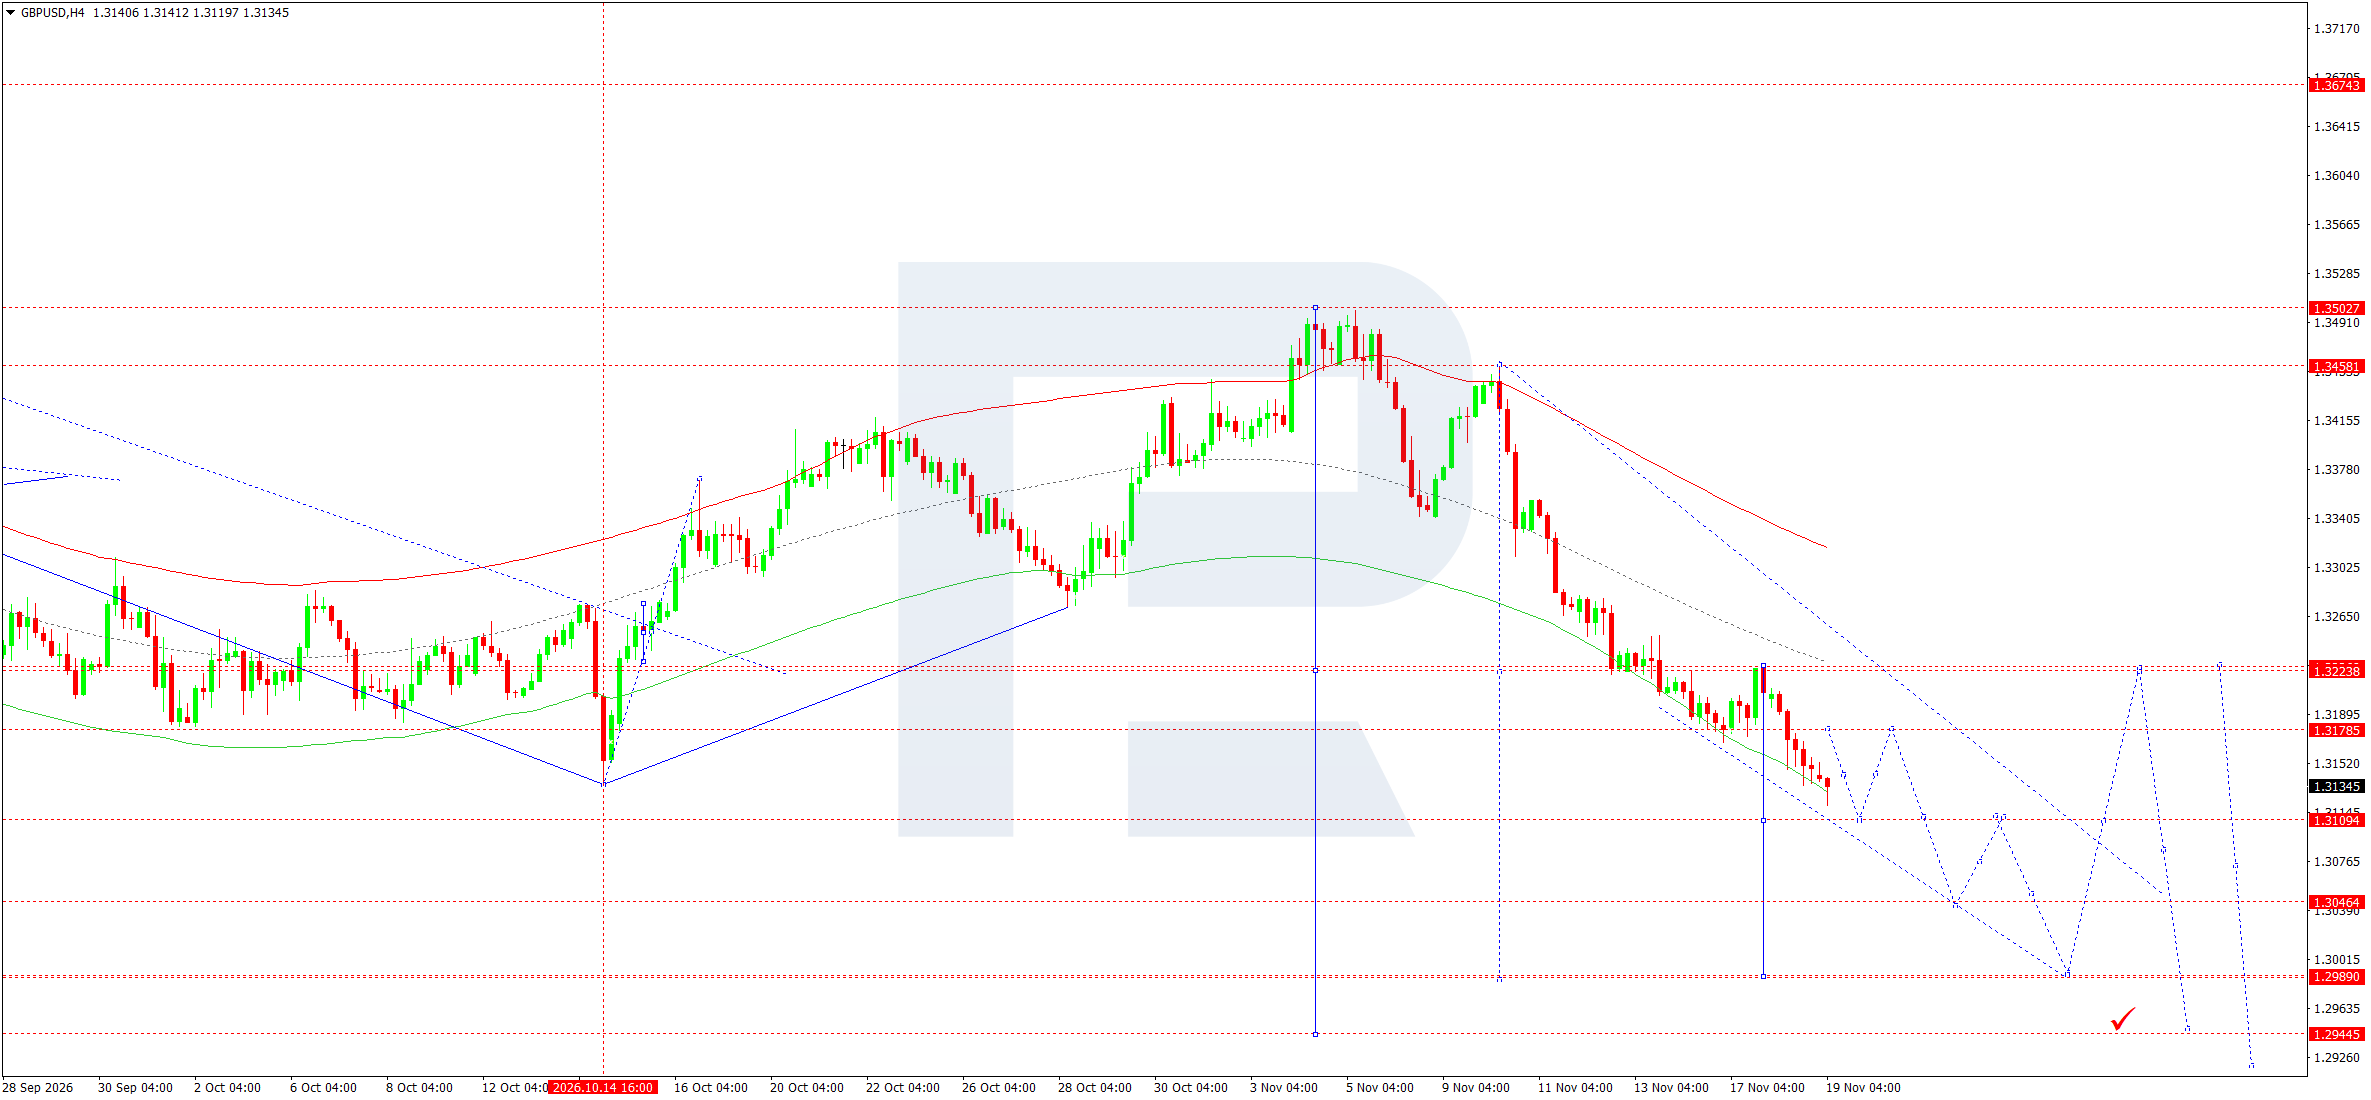
On the H4 chart, the downward wave from 1.3458 maintains a sequence of lower highs. The latest local low is marked at 1.3120. A brief rebound towards 1.3144 is possible on 19 November; if it fades, the baseline scenario envisages a test of the 1.3109 level. Consolidation below this support would open the way towards 1.3046. A pause is possible between these levels, as the initial breakout could trigger short-covering and a return towards the lower boundary of the previous range.
In the Elliott wave count, the pivot of the bearish wave matrix is around 1.3250. The descending Price Envelope and the price's position near its lower boundary suggest a corrective rise within the bearish structure. A return above 1.3179 would weaken the case for an immediate decline and increase the likelihood of a test of 1.3224.
The 1.2989 area represents a deeper projection following a break below 1.3046. In the trading scenario, the stop loss is above the nearest corrective target, so an early rebound could prevent entry or stop out the position before support is tested. The take profit assumes that 1.3109 will be breached during the session.
GBPUSD forecast scenario
AUDUSD forecast
Employment in Australia fell by approximately 43,500 in October on a seasonally adjusted basis, while the unemployment rate reached 4.9%. The labour force participation rate declined to 66.6%. These figures reinforce signs of a cooling labour market after the Reserve Bank of Australia raised its policy rate to 4.85% on 3 November. Six board members voted for the increase, while three preferred to keep the rate unchanged. Weak employment data give the market grounds to assess the likelihood of another increase more cautiously.
However, the RBA points to broad-based inflationary pressures and rising costs, so one labour market report may not be sufficient to revise the entire interest rate path. For AUDUSD, the reaction of Australian yields relative to US yields following the Fed minutes matters. If Australian bonds continue to rise in price on expectations of less restrictive policy, the resulting decline in their yields could increase pressure on the exchange rate. An improvement in demand for cyclical assets would soften the impact of weak employment figures, but a sustained recovery in the Australian dollar would require confirmation from interest rates or commodity markets.
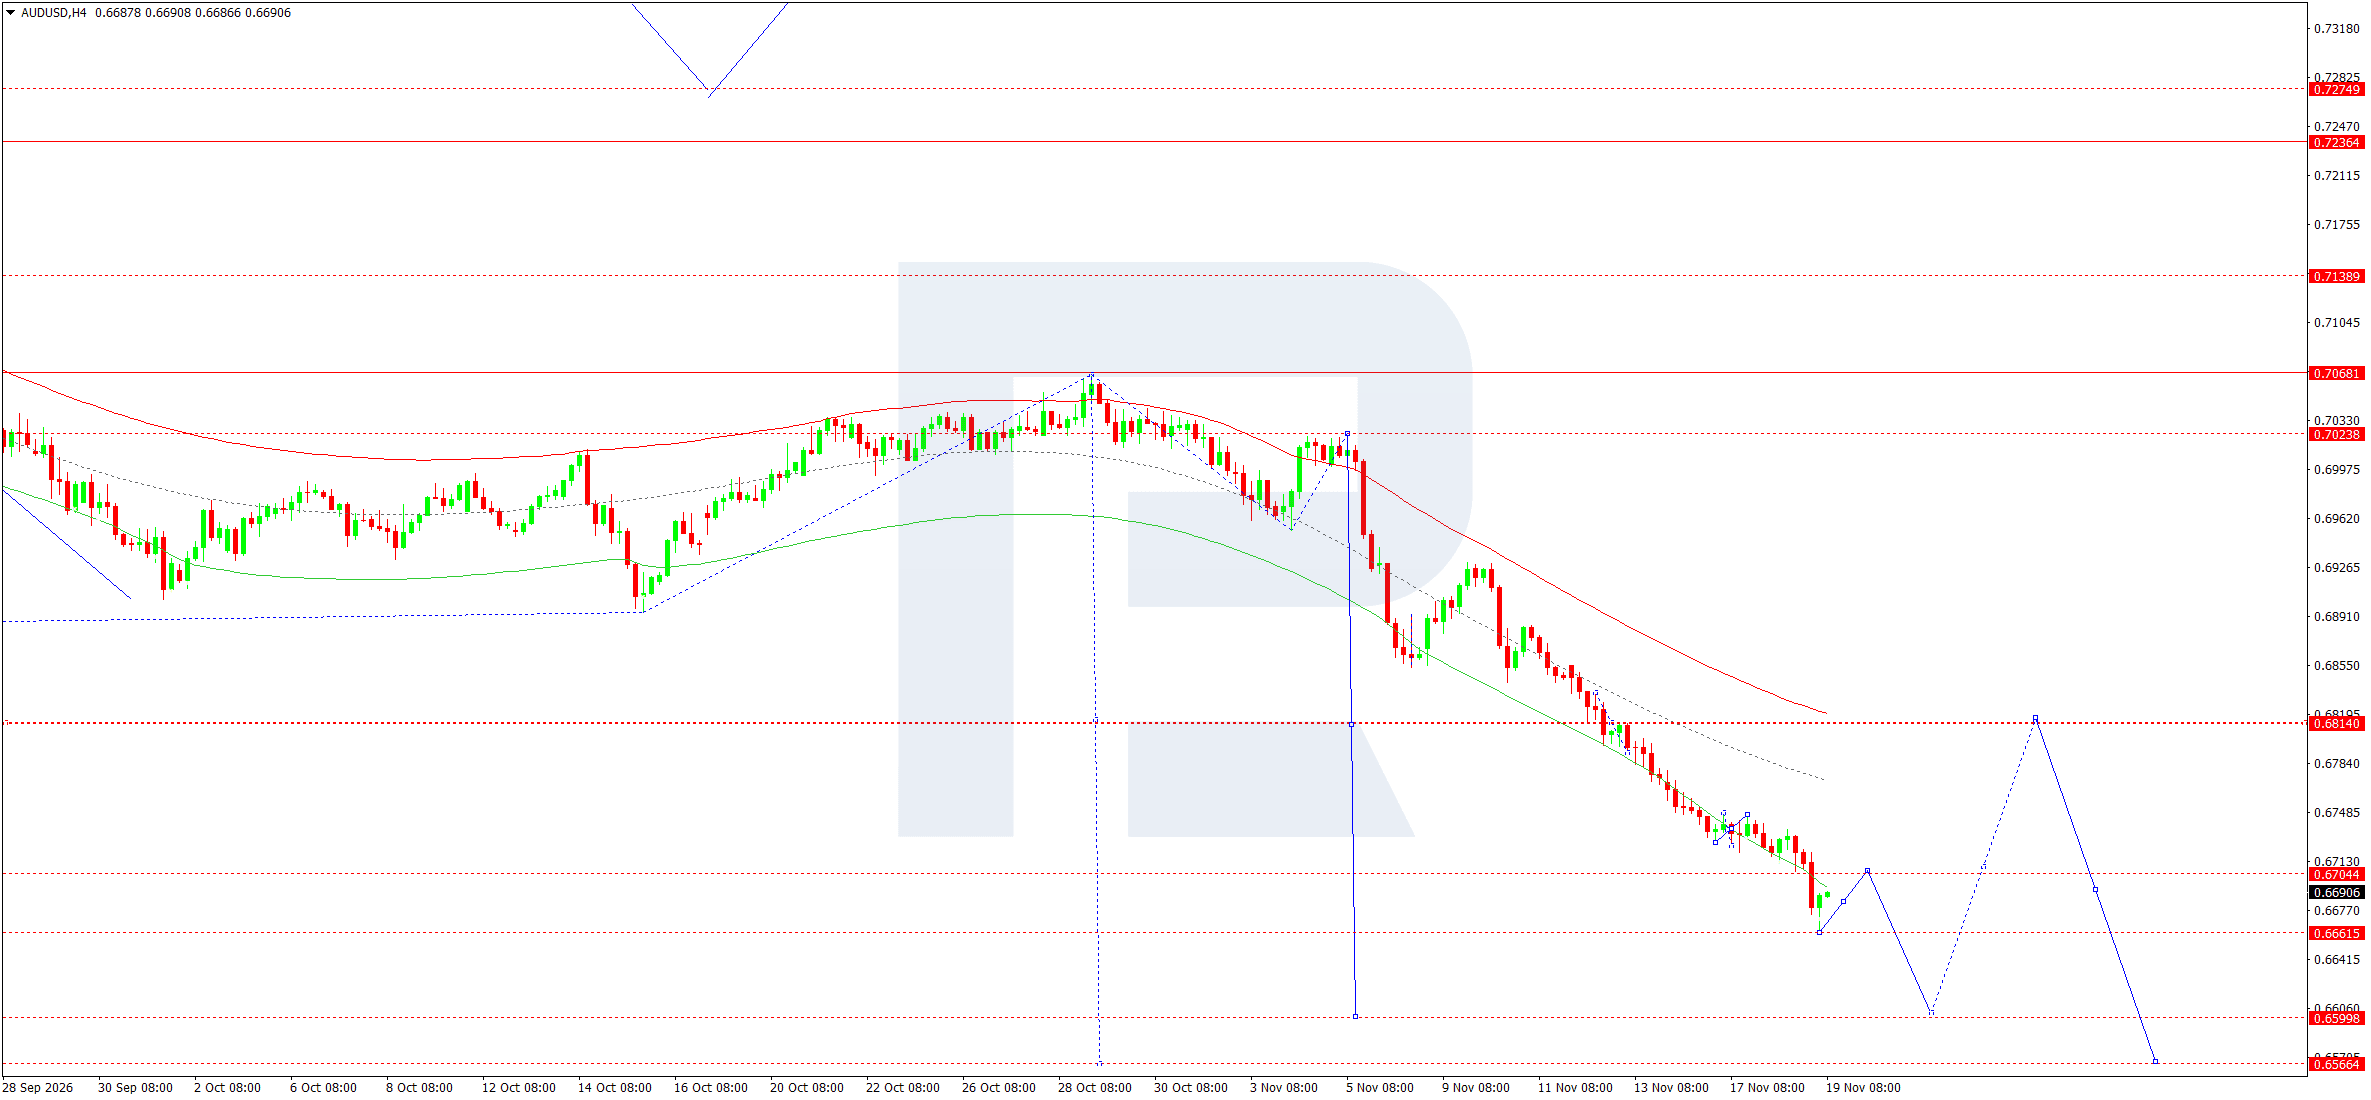
On the H4 chart, the price rebounded from the 0.6662 area after breaking down from local consolidation near 0.6734. The baseline scenario for 19 November envisages a test of the 0.6704 level from below. If sellers defend this resistance, another move towards 0.6662 is likely. An H4 close below support would open the way towards 0.6600. The more distant 0.6566 level would become relevant if the subsequent rebound is weak and the price maintains its sequence of lower highs.
In the Elliott wave count, the 0.6814 level is the pivot of the bearish wave matrix. The price is near the lower part of the descending Price Envelope, so the depth of the nearest pullback depends on the reaction to 0.6704. A sustained return above this level would increase the likelihood of a move towards 0.6734. In the trading scenario, activation assumes a renewed decline, while the stop loss is positioned beyond resistance at 0.6704.
The 0.6600 target depends on a break below 0.6662. If the first test of support ends in rapid buying, the move towards the more distant target could extend beyond the session. Such a development would preserve the range between support and the nearest resistance.
AUDUSD forecast scenario
USDCAD forecast
On 28 October, the Bank of Canada raised its policy rate by 25 basis points to 2.50%. According to data released on 16 November, headline inflation in October remained at 3.1%, while the measure excluding energy slowed from 2.1% to 2.0%. For the Canadian dollar, the first figure supports expectations of restrictive policy, while the second points to more moderate pressure outside the energy sector. Both measures are important for assessing how quickly the BoC may continue raising rates.
The US policy rate remains higher than Canada's, and the Fed minutes kept the market focused on the possibility of an increase in December. This differential supports USDCAD as long as US interest rate expectations rise faster than Canadian expectations. Oil remains an additional factor. Falling commodity prices could weaken the support for Canada's export revenues and amplify the pair's upward move. A recovery in oil prices, in turn, could accelerate a USDCAD correction. To assess this influence, it is important to see whether oil's move is confirmed by changes in the Canadian dollar against other currencies.
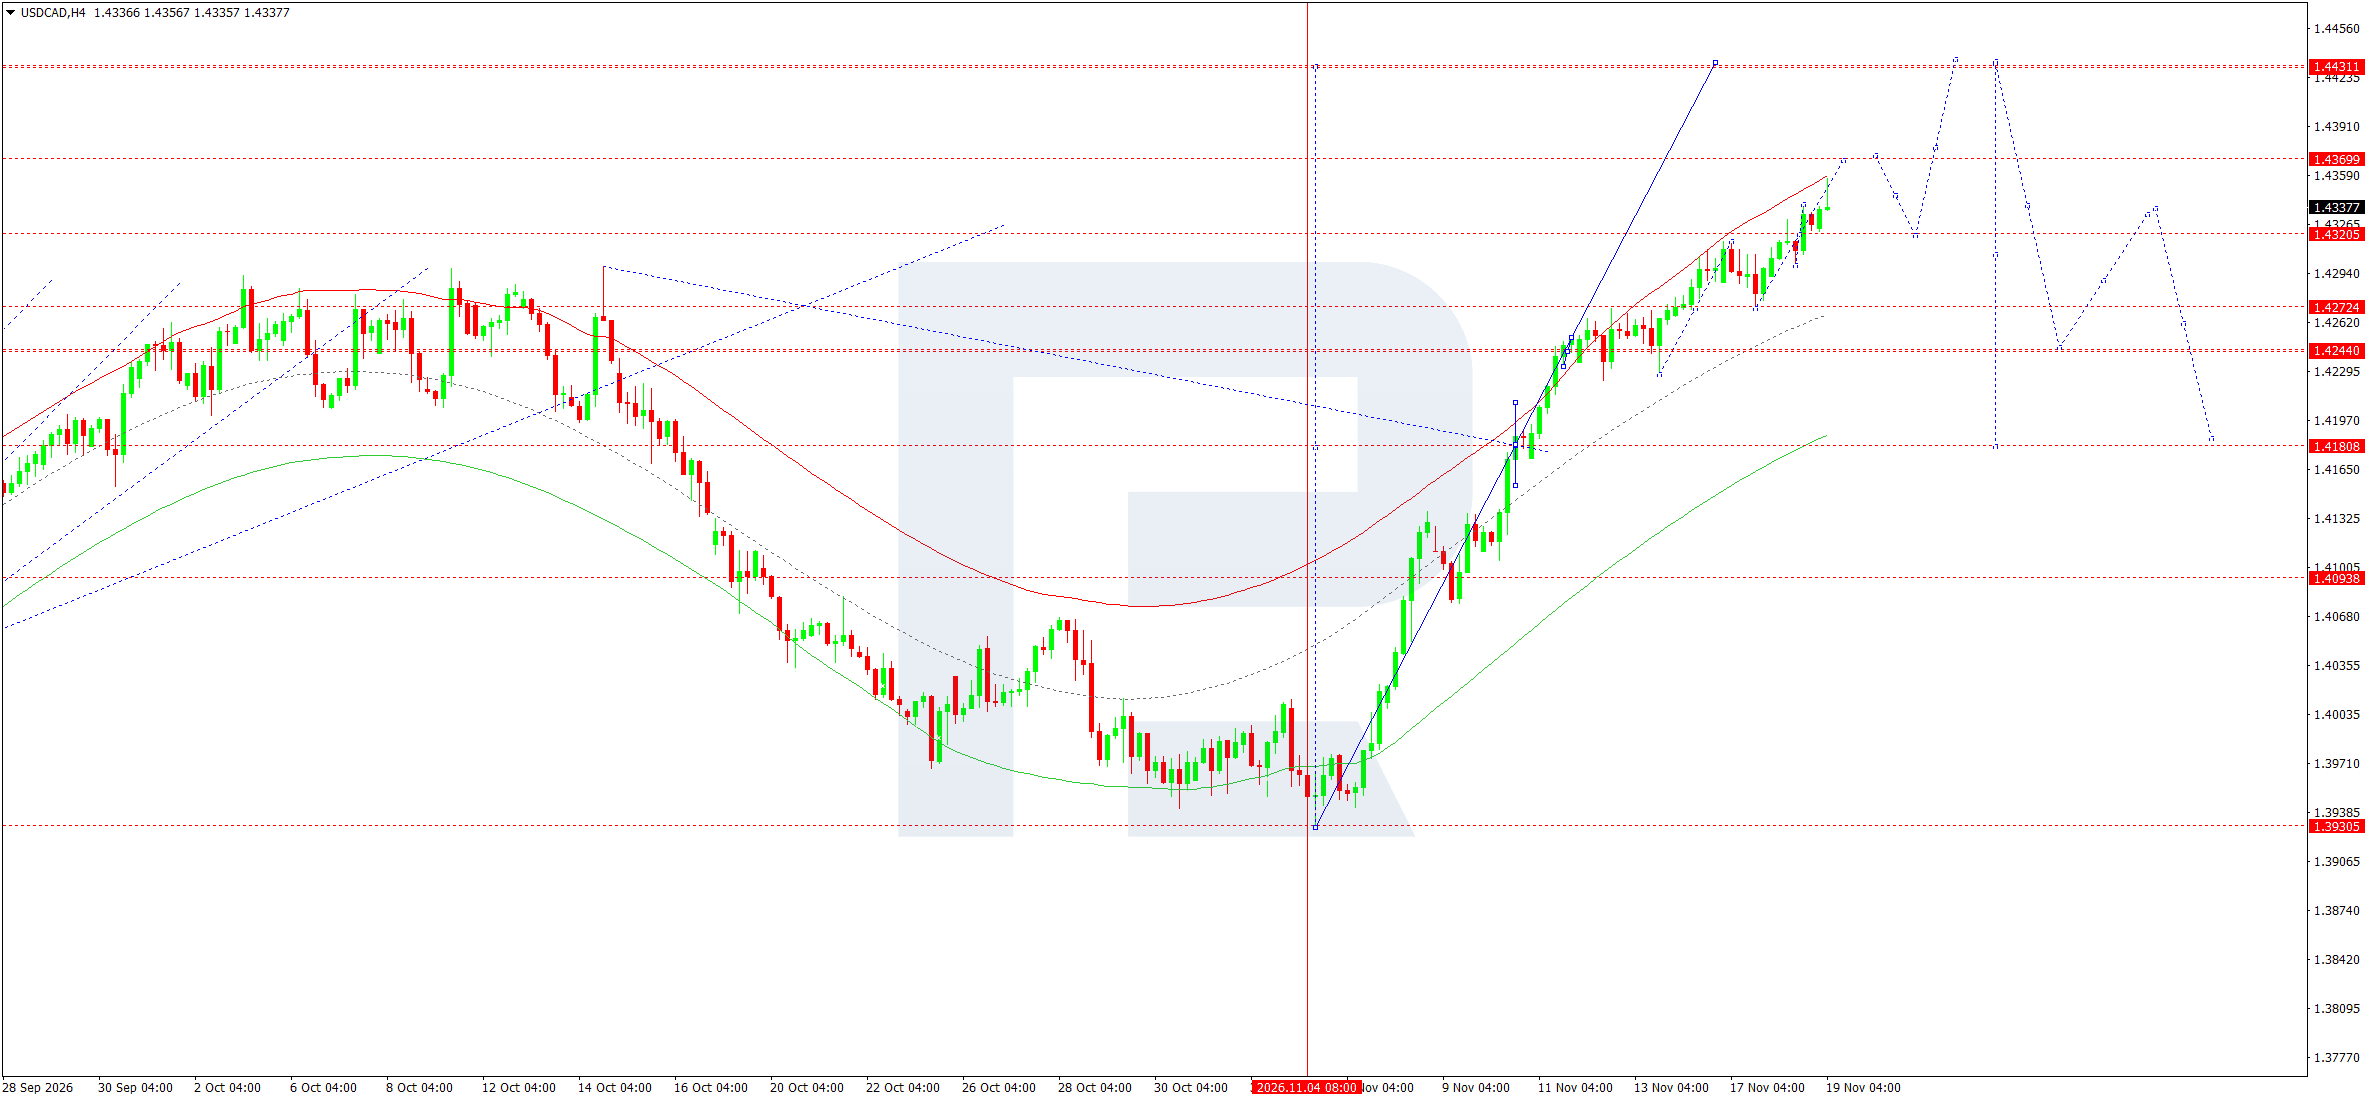
On the H4 chart, the bullish structure remains intact following the rise from 1.3931. The latest candlestick reached 1.4357 before returning to 1.4338. For 19 November, the baseline scenario suggests consolidation below the high and a test of the 1.4321 level. If support holds, conditions will favour another rise towards 1.4357 and 1.4370. After consolidation above 1.4370, the next target will be 1.4431. An H4 close below 1.4321 would increase the likelihood of a correction towards 1.4272.
In the Elliott wave interpretation, the current move continues the bullish wave, while the 1.4160–1.4181 area serves as support for its larger wave matrix. The upper boundary of the Price Envelope runs near the closest resistance, so a pullback is possible before the range expands again. The entry at 1.4343 is intended to capture renewed growth within the local range.
The stop loss is placed below 1.4321, where the pattern of short-term higher lows would be broken. Both intermediate resistance levels must be overcome to reach the target. If the price reverses again at 1.4357, continued consolidation is more likely. By the session close, the main sign of buyers' strength will be the price holding above 1.4370 after a breakout.
USDCAD forecast scenario
XAUUSD forecast
The Fed minutes published on 18 November kept the market focused on the risk of another interest rate hike. With US bond yields high, holding gold carries a greater opportunity cost in terms of forgone interest income. By the end of 18 November, the yield on 10-year Treasury securities had declined from 5.10% to 5.07%, remaining above 5%. For gold, the future direction of real yields matters more than an isolated change in the nominal rate. If yields continue to decline without a comparable fall in inflation expectations, pressure on the metal could ease.
A strong dollar makes gold more expensive for buyers using other currencies. Geopolitical tensions can support safe-haven demand, but rising energy prices could also prolong the period of high interest rates. The metal's reaction to this combination of factors matters during the day. If gold continues to recover as the dollar weakens and yields decline, the likelihood of a deeper correction will rise. If the dollar remains strong and yields stabilise near recent levels, the rebound could end at the first major resistance level.
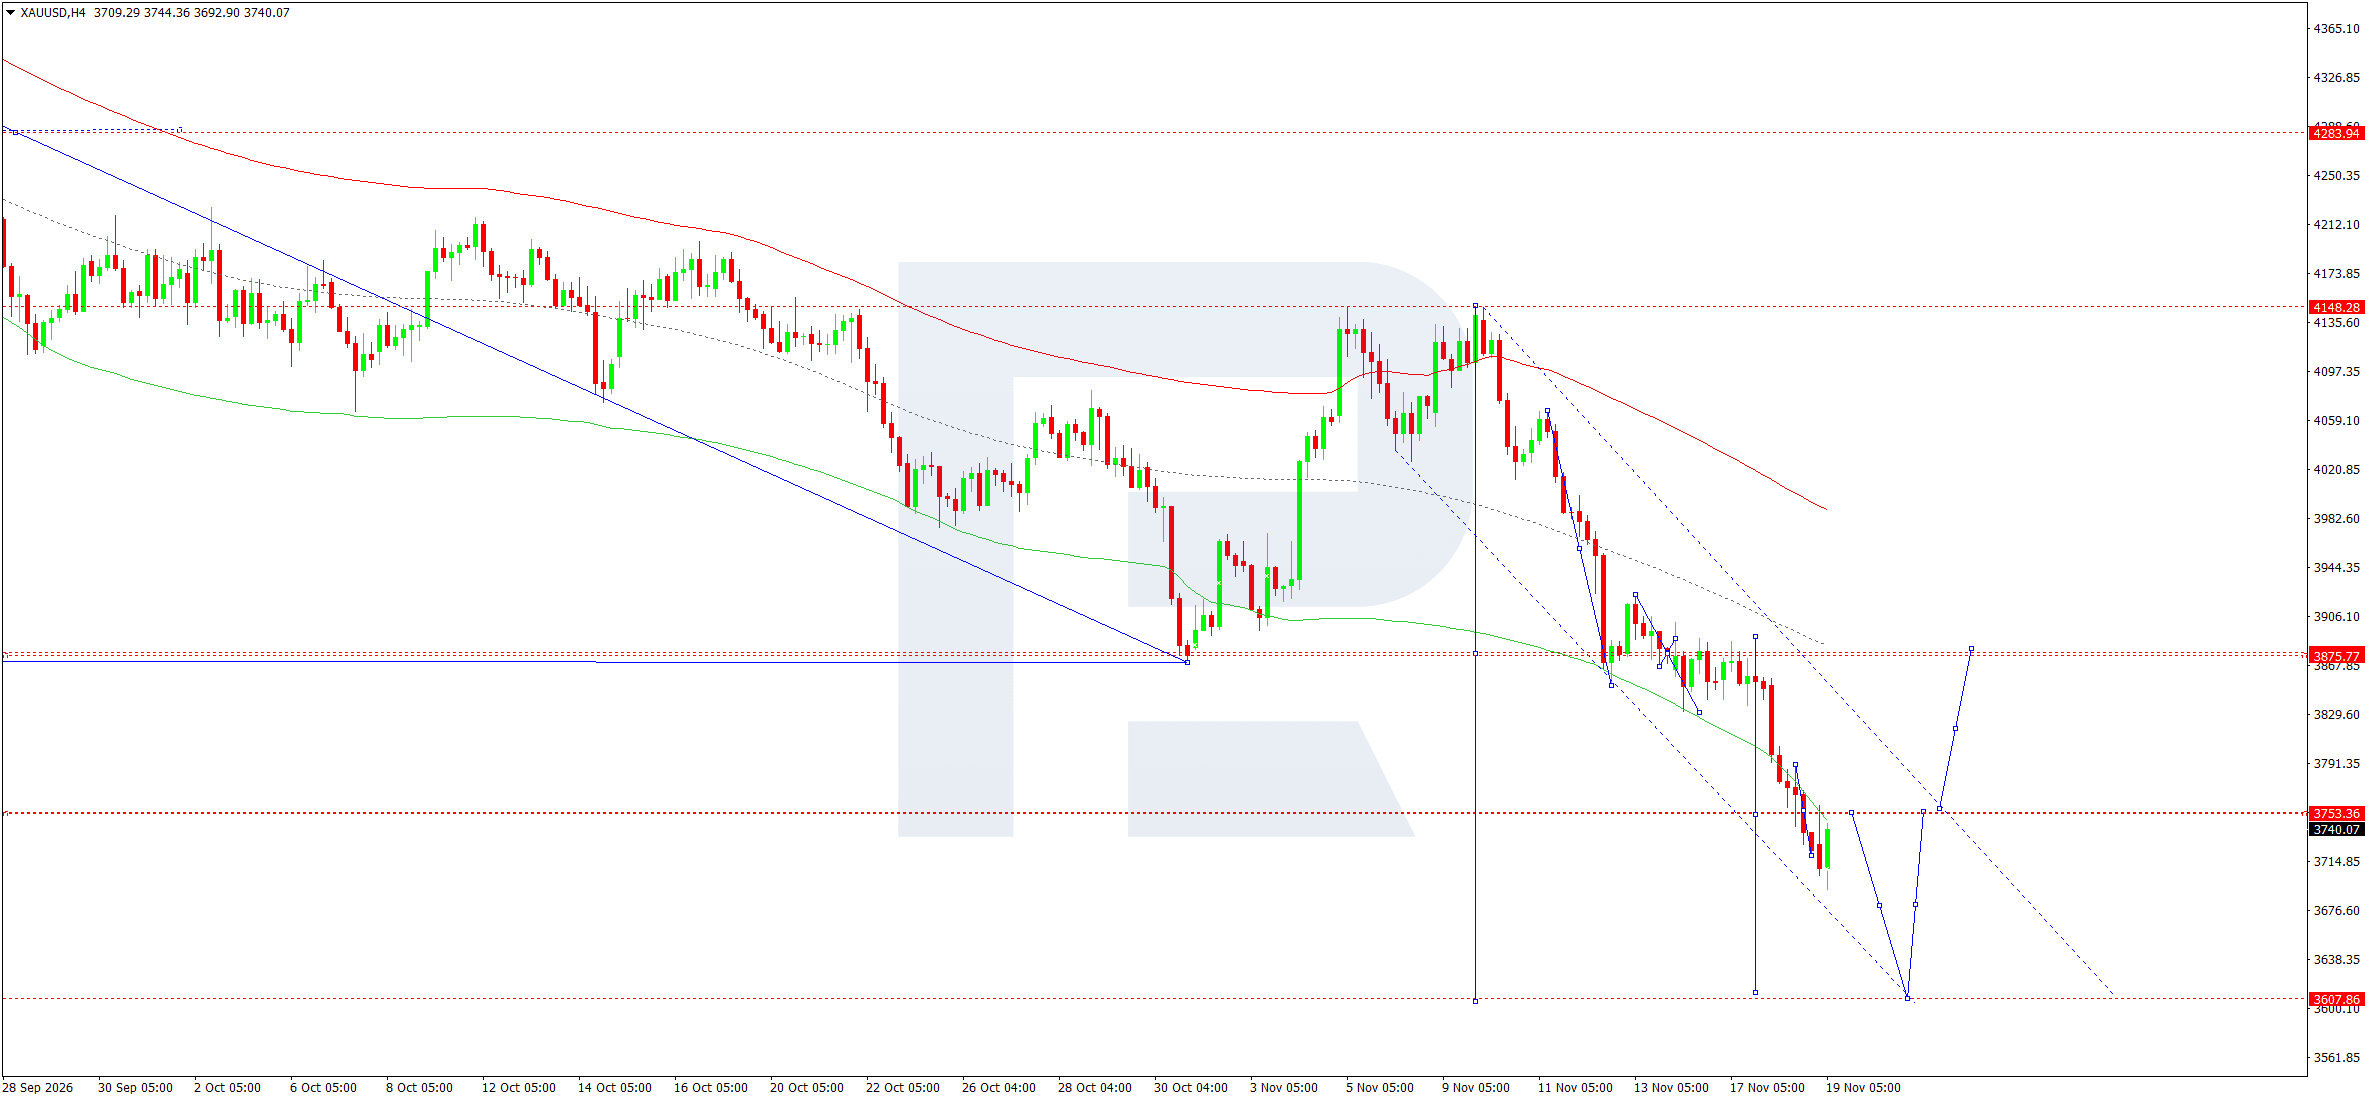
On the H4 chart, gold broke below 3,753 and fell towards 3,693 before returning to 3,740. The main scenario for 19 November envisages a test of 3,753 from below. If the rebound loses momentum, the nearest target will again be 3,693. Consolidation below the low would open the way towards 3,608. A return above 3,753, followed by the level holding on a retest, would create conditions for a correction towards 3,791 and then the 3,876 area.
The Elliott wave count and the wave matrix, with its pivot around 3,960, describe the bearish wave from the November high. The Price Envelope retains its downward slope, while 3,608 corresponds to the extended projection after the low is broken. The take profit is set at 3,693, where buyers have already reacted.
The entry assumes a renewed downward move below 3,735, with the stop loss above 3,753. If the price first consolidates above resistance, the initial basis for selling will disappear. A significant confirmation of selling pressure during the session would be the formation of a lower high on another approach to 3,753, after which the price could extend its move towards the low of the previous impulse.
XAUUSD forecast scenario
US 500 forecast
The Fed minutes revealed disagreements in October and keep the possibility of another interest rate hike in play. The yield on 10-year US Treasury securities stood at 5.07% on 18 November. At this level, investors may demand higher expected returns from equities. This is particularly important for companies whose valuations rely on cash flows from future growth. A further decline in yields would facilitate an index recovery, while stronger expectations of tightening could limit demand for equities even with favourable corporate news.
On the corporate side, NVIDIA reported quarterly revenue of 115.8 billion USD on 17 November, up 103% year-on-year. Data centre revenue reached 107.6 billion USD. The report confirms strong demand for computing infrastructure, but the reaction of other sectors matters for the broader index. Gains concentrated in a few large stocks can lift the index rapidly and fade just as quickly. Participation from cyclical and defensive sectors would help distinguish a sustained recovery from a short-term reaction to a single company's results.
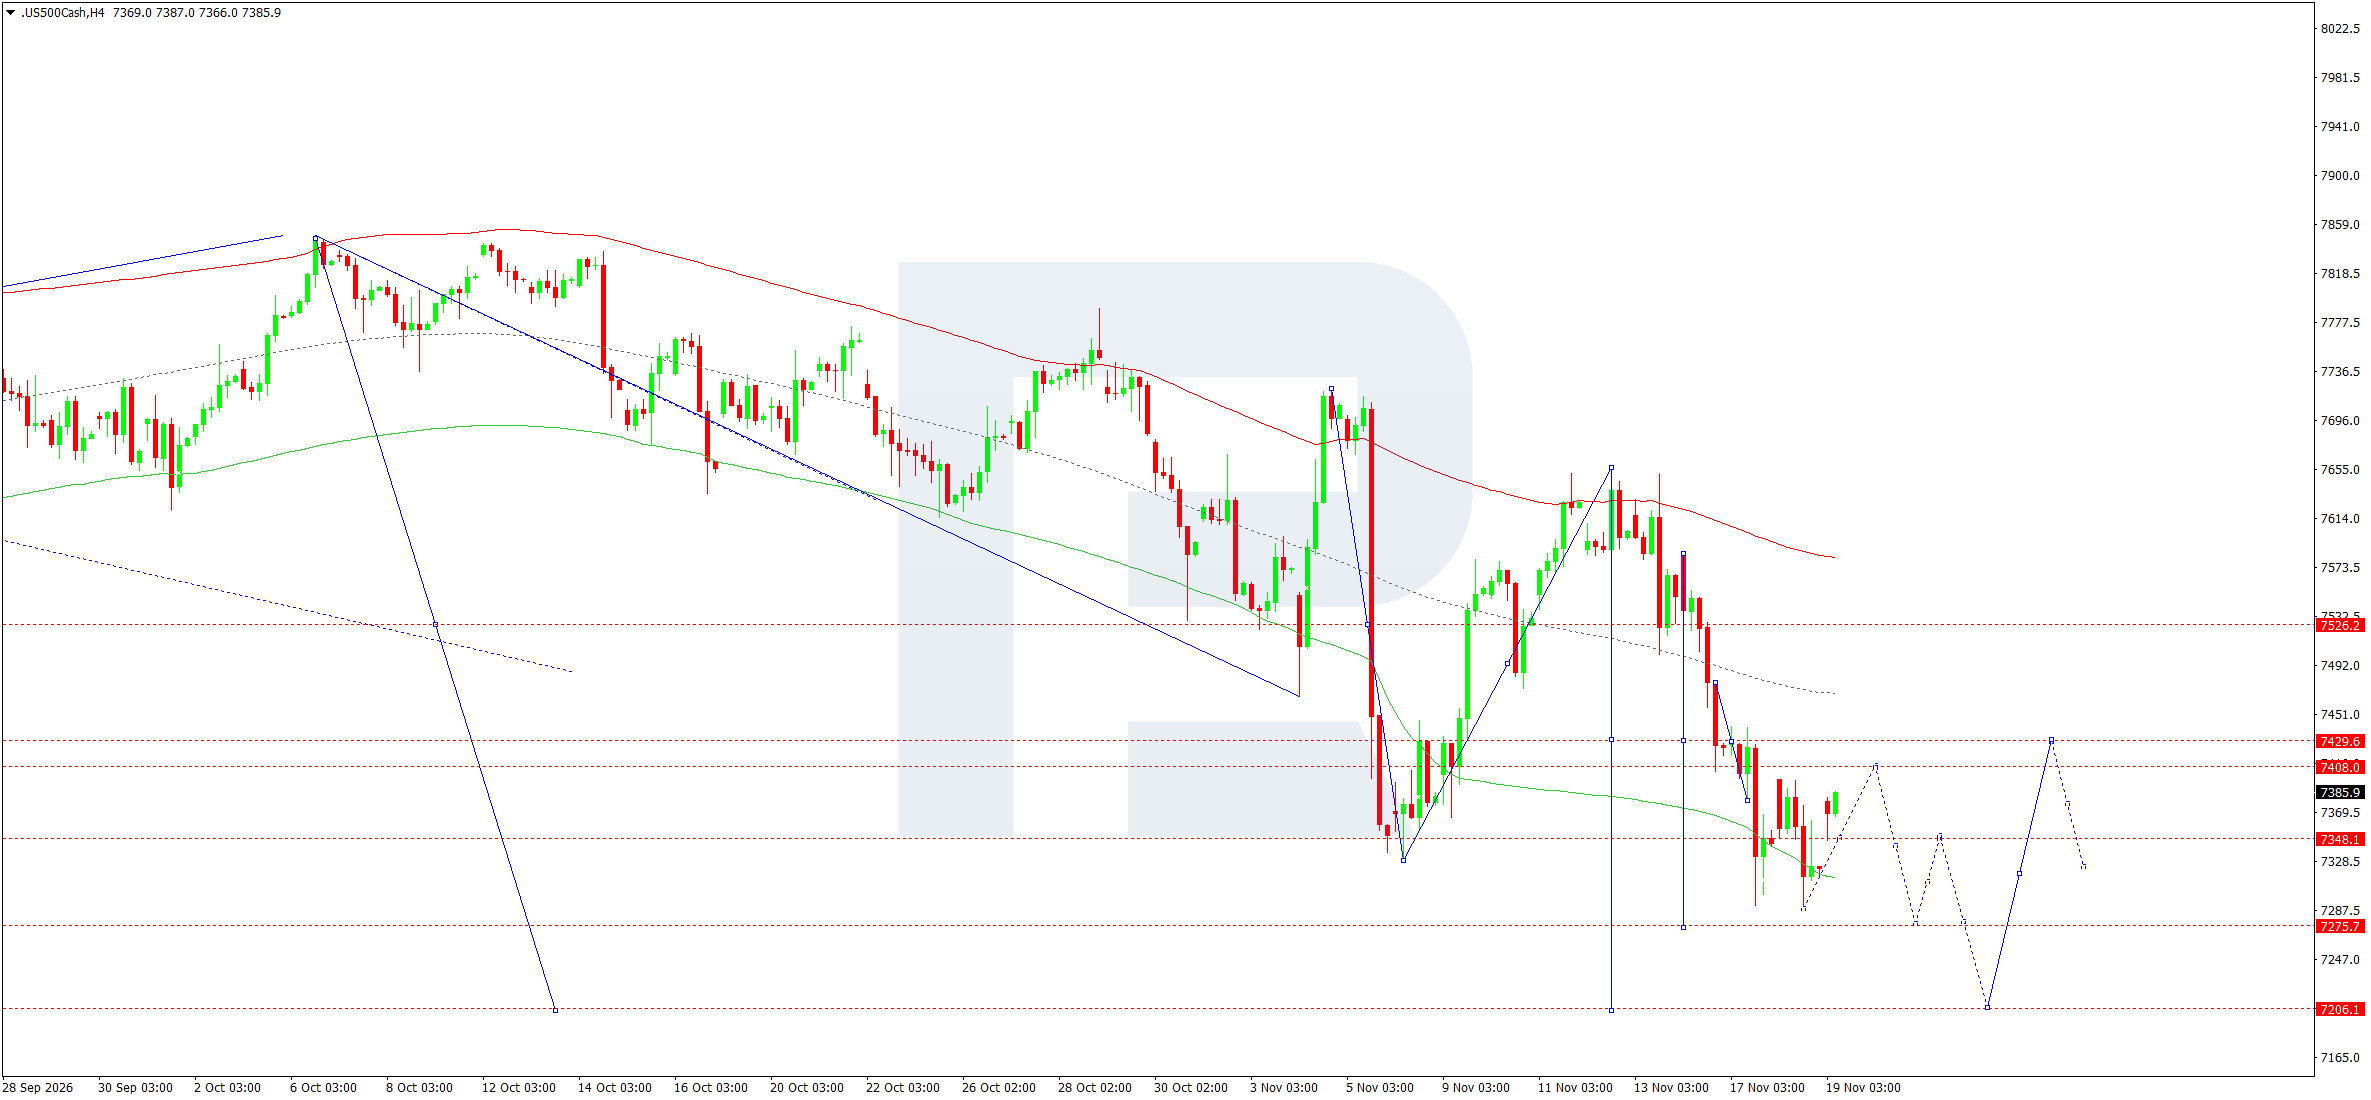
On the H4 chart, after falling towards 7,289, the index recovered above 7,348. The nearest resistance levels are at 7,408 and 7,430. The price could approach the 7,408 level during the 19 November session. If the rebound loses momentum, a return below 7,348 would put 7,289 and the next support at 7,276 under pressure again. Only consolidation below 7,276 would provide technical confirmation of the more distant 7,206 target. Conversely, an H4 close above 7,430 would increase the likelihood of a correction towards 7,526.
In the Elliott wave count, the rise from the low still fits within a correction of the bearish wave, with the wave matrix pivot around 7,555. The Price Envelope remains downward-sloping, and the price is trading below its midline. Holding 7,348 could prolong the recovery, so the scenario entry assumes renewed pressure on a move below 7,381.
The stop loss is above the first resistance, while the take profit is set at the next support following a retest of the low. The depth of the intraday decline will depend on whether sellers keep the price below 7,348 after the breakout. A swift return above this level would increase the likelihood of sideways trading.
US 500 forecast scenario
BTCUSD forecast
Sustained pressure on Bitcoin has coincided with a reassessment of US interest rates. The Fed minutes released on 18 November showed that two participants had already favoured a quarter-percentage-point increase in October. The yield on two-year Treasury securities remains around 4.80%. At this level, liquid dollar-denominated instruments compete for capital with assets that do not generate interest income. A weaker dollar could make it easier for Bitcoin to recover, particularly if accompanied by a broader improvement in demand for technology stocks.
A separate factor for BTCUSD is demand through US spot exchange-traded funds. Estimates released for 18 November indicate net outflows, although the final amount differs between summaries. In this context, a rapid price rise could reflect short-covering after a series of declines. A more sustained recovery would require the market to hold the levels reached during the next pullback. As long as US yields remain high and inflows through the funds have not resumed, the risk of renewed pressure near the closest resistance persists.
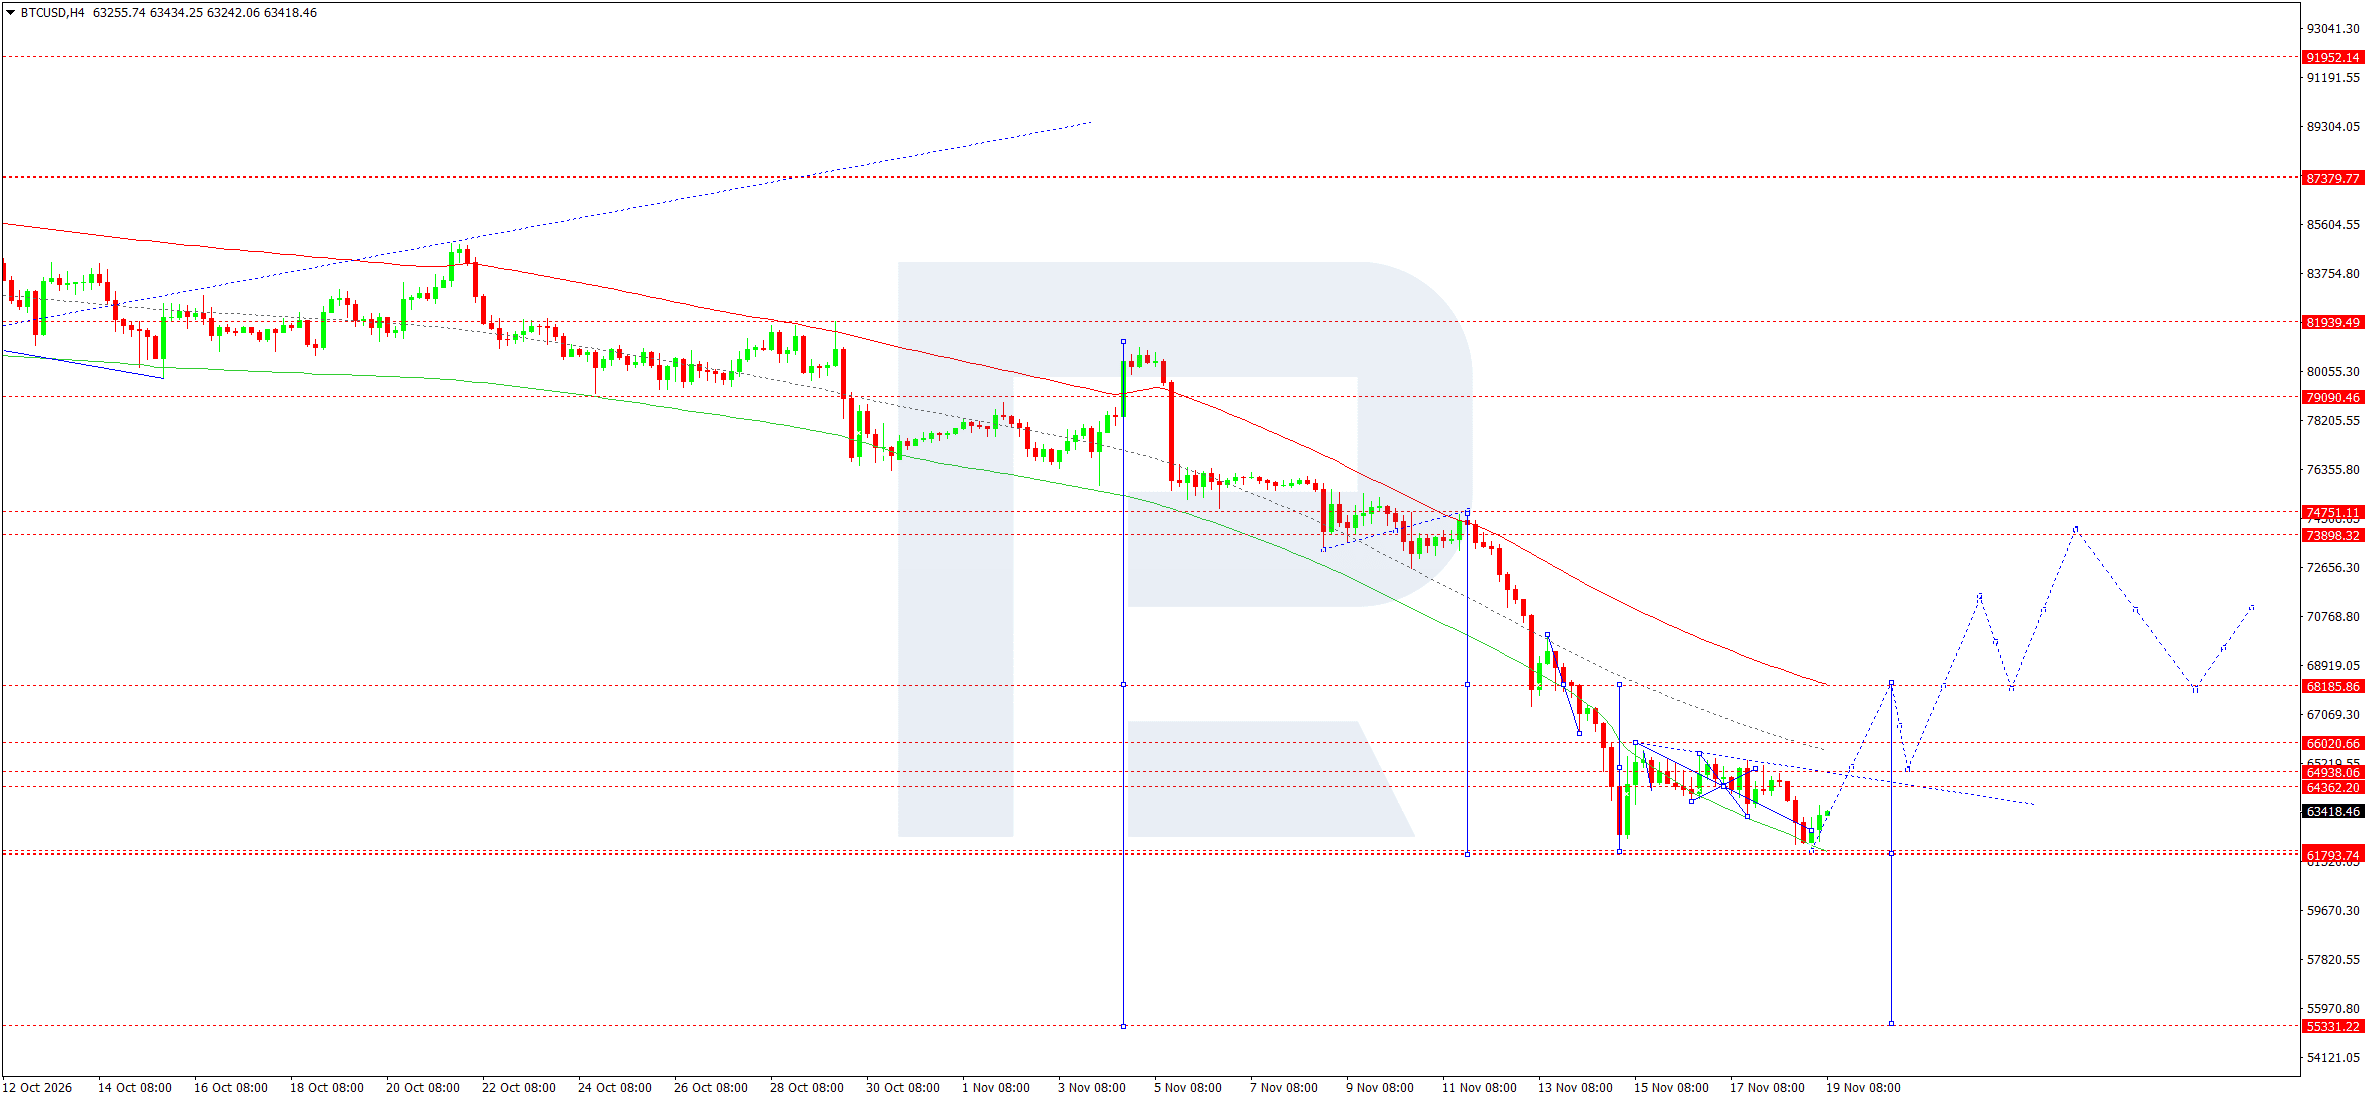
On the H4 chart, Bitcoin recovered towards 63,418 after another test of the 61,794 area. On 19 November, buyers' immediate task is to break above 64,362. A test of 64,938 is possible beyond this level. A failure to consolidate at the upper boundary could bring the price back towards 63,555, while an H4 close above 64,938 would increase the likelihood of a move towards 66,021 and then 68,186. If the low at 61,794 is broken, the bearish wave could resume, with 55,331 becoming a more distant target in the wave count.
In the Elliott wave structure, the rise is viewed as a correction within the bearish wave, whose wave matrix pivot is in the 74,751 area. The upper boundary of the Price Envelope runs near 68,186, while its downward slope maintains pressure over the broader horizon. The BUY trading scenario targets the move from the current consolidation towards 64,938.
The 64,362 level provides an intermediate test of demand, while a decline towards 62,980 after entry would invalidate this local scenario. If upward momentum weakens before 64,362 is reached, support could be retested without the target being achieved during the session. A reversal of the broader trend would require consolidation above the nearest resistance levels and the formation of a higher low.
BTCUSD forecast scenario
Editors’ picks


EURUSD forecast 2026–2027: technical analysis, price levels & predictions
The EURUSD outlook for 2026 and 2027: key levels on the daily chart, three trading scenarios and the policy gap between the Fed and the ECB that drives the pair.

Gold (XAUUSD) forecast 2026: technical analysis, price levels & predictions
Where gold could trade in 2026: key levels, three trading scenarios with entry triggers and the forecasts from J.P. Morgan, Deutsche Bank and Goldman Sachs.
Forecasts presented in this section only reflect the author’s private opinion and should not be considered as guidance for trading. RoboForex bears no responsibility for trading results based on trading recommendations described in these analytical reviews.