
Daily technical analysis and forecast for 20 November 2026
Daily technical analysis and forecast for EURUSD, USDJPY, GBPUSD, AUDUSD, USDCAD, XAUUSD, US 500, and BTCUSD for 20 November 2026.
Each scenario on this page reflects the market structure on the H4 chart as of 10:00 AM UTC+2 on 20 November 2026. The assessment considers the current H4 chart structure, key support and resistance levels, the direction of the medium-term movement, and the prevailing fundamental backdrop.
EURUSD forecast
Annual inflation in the eurozone rose to 4.0% in October from 3.8% in September. According to Eurostat, energy made the largest contribution, while services inflation increased to 3.3%. At its October meeting, the European Central Bank kept its deposit rate at 2.50%. Faster growth in services prices limits the scope for policy easing, while expensive energy raises business costs and reduces households' purchasing power.
In October, the US Federal Reserve maintained its policy rate range at 3.75–4.00%. The minutes published on 18 November showed that participants discussed the possibility of further tightening in response to persistent price pressures. High European inflation therefore provides only limited support for the euro. The pair's reaction depends on how much interest rate expectations change in the eurozone and the US. Today, the final University of Michigan consumer survey could influence this assessment. Inflation expectations are particularly important, as a rise could support US bond yields and demand for the dollar.
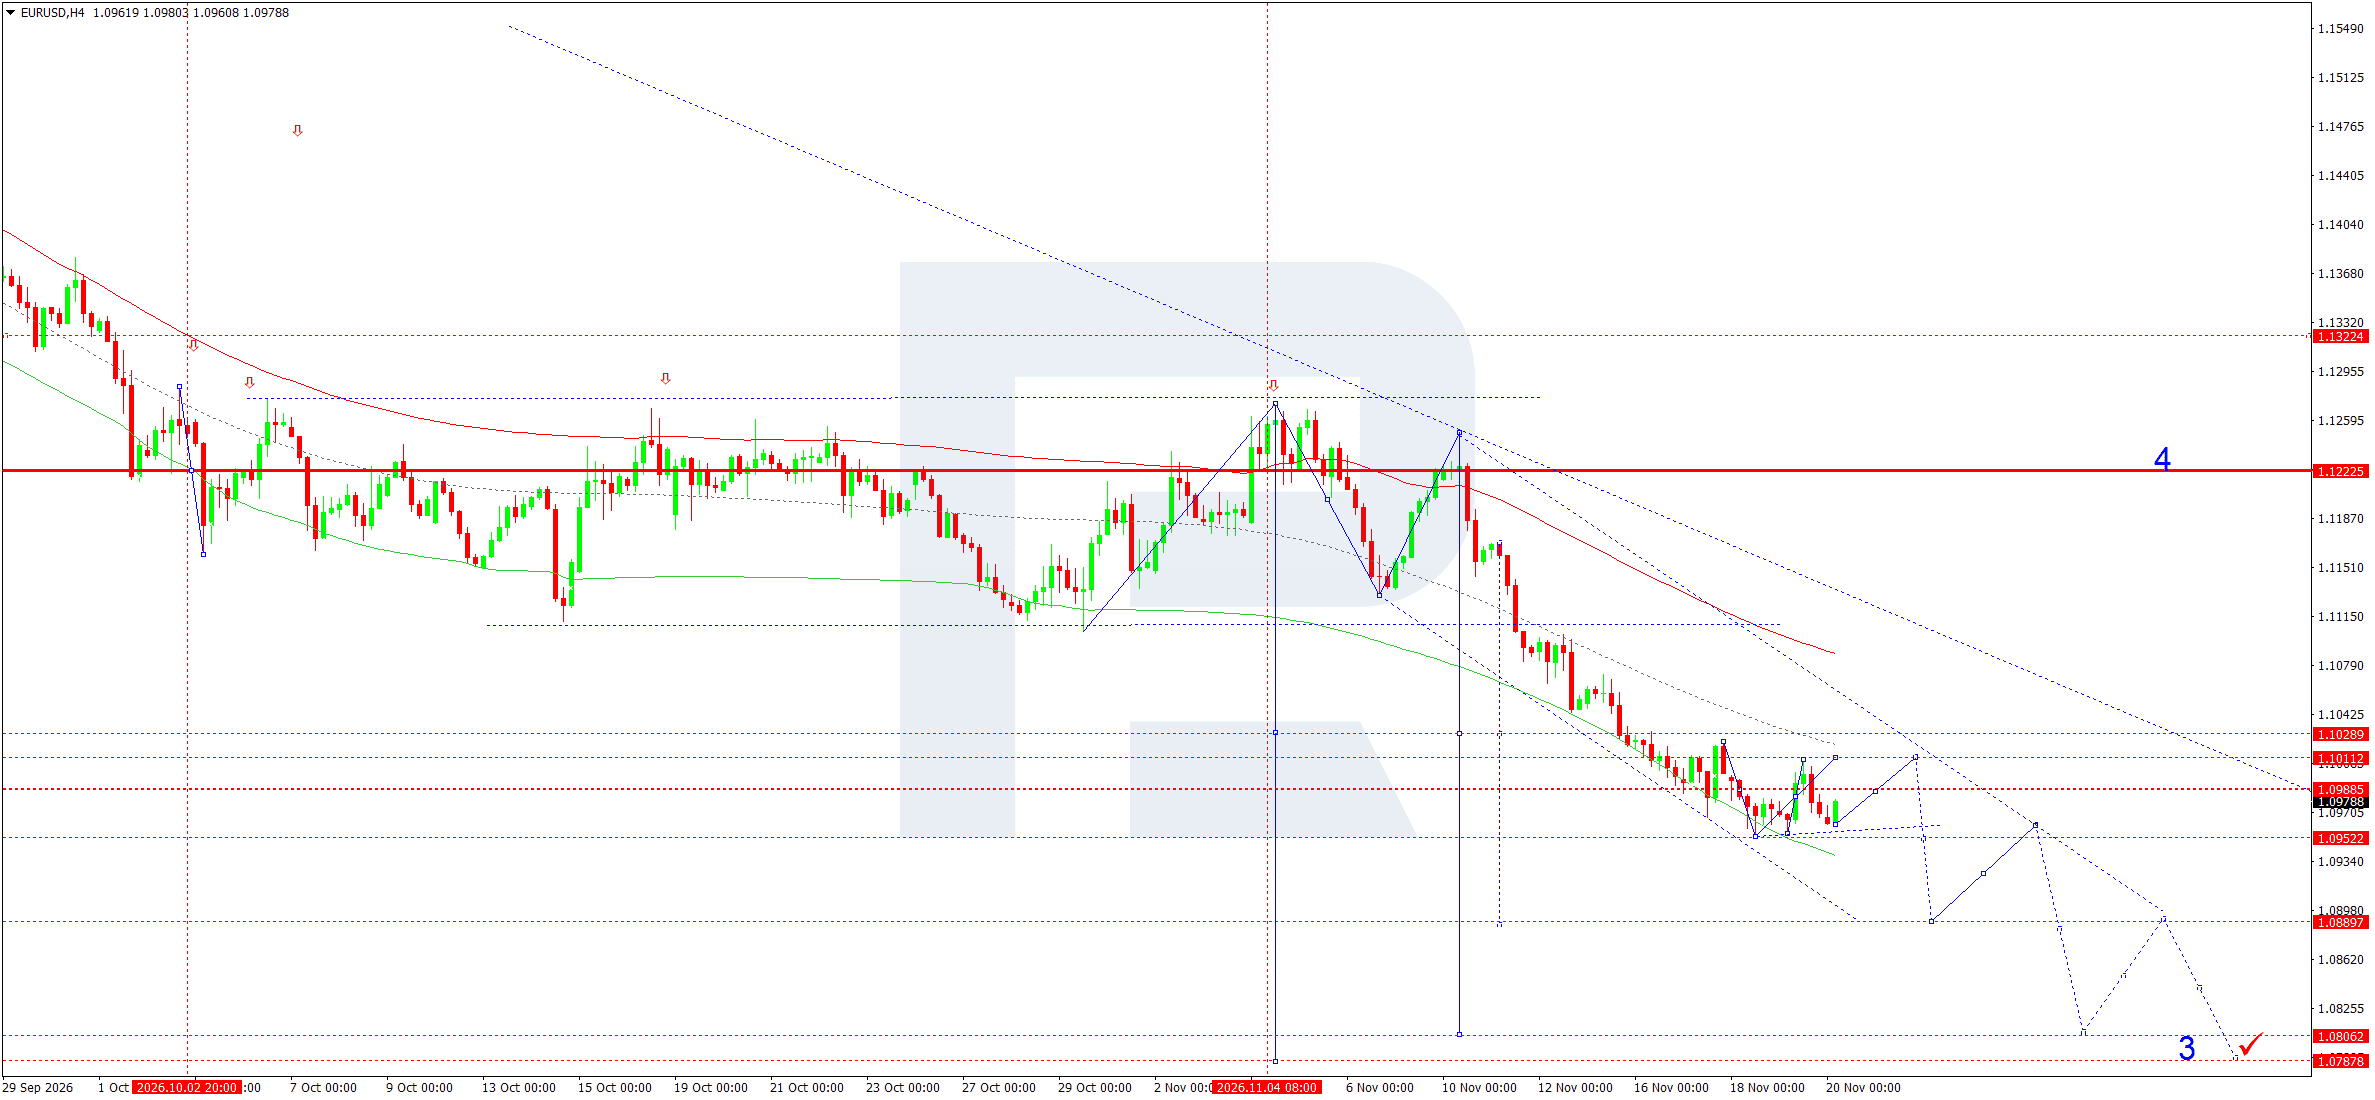
On the H4 chart, the sequence of lower highs and lower lows remains intact following the reversal from the 1.1222 area. The pair tested 1.0952 and rebounded to 1.0979. Initial resistance lies at 1.0989. A break above it would allow a correction towards 1.1011, where the previous recovery attempt met selling pressure. The next barrier is at 1.1029. As long as the price remains below it, the rebound fits within the downward wave structure.
For 20 November, the baseline scenario envisages a renewed decline after a correction or another failure to consolidate above 1.0989. A break below 1.0952 would open the way towards 1.0890. Consolidation and a return towards 1.0950 are possible near this level. If another selling impulse develops, the 1.0870 level will become an intermediate reference, while the more distant projection extends through 1.0806 and 1.0788.
In the wave matrix, 1.1222 serves as the pivot. The Elliott wave count suggests a continued decline, while the Price Envelope's midline slopes downwards.
Consolidation above 1.1029 would cast doubt on the immediate bearish projection. The entry condition is for the price to cross the activation level downwards again following a rebound.
EURUSD forecast scenario
USDJPY forecast
In Japan, October inflation stood at 2.3% year on year, while the index excluding fresh food rose by 2.2%. The index excluding fresh food and energy also gained 2.2%. These figures provide grounds for discussing a further rate hike by the Bank of Japan. The currency's reaction depends on how much of the increase the market has already priced in. If global equity markets remain weak, the yen could receive additional support from the unwinding of positions financed in the Japanese currency.
On the US side, the dollar benefits from relatively high interest rates. On Thursday, the yield on 10-year Treasury bonds fell from 5.07% to 5.04%, somewhat weakening this factor. If US yields continue to decline amid equity selling, the yield spread could narrow and strengthen demand for the yen. For USDJPY, the reaction to the US consumer survey is important. Rising inflation expectations could support the dollar through yields, while a decline could prolong the pair's correction and bring the nearest support area on the four-hour chart into focus.
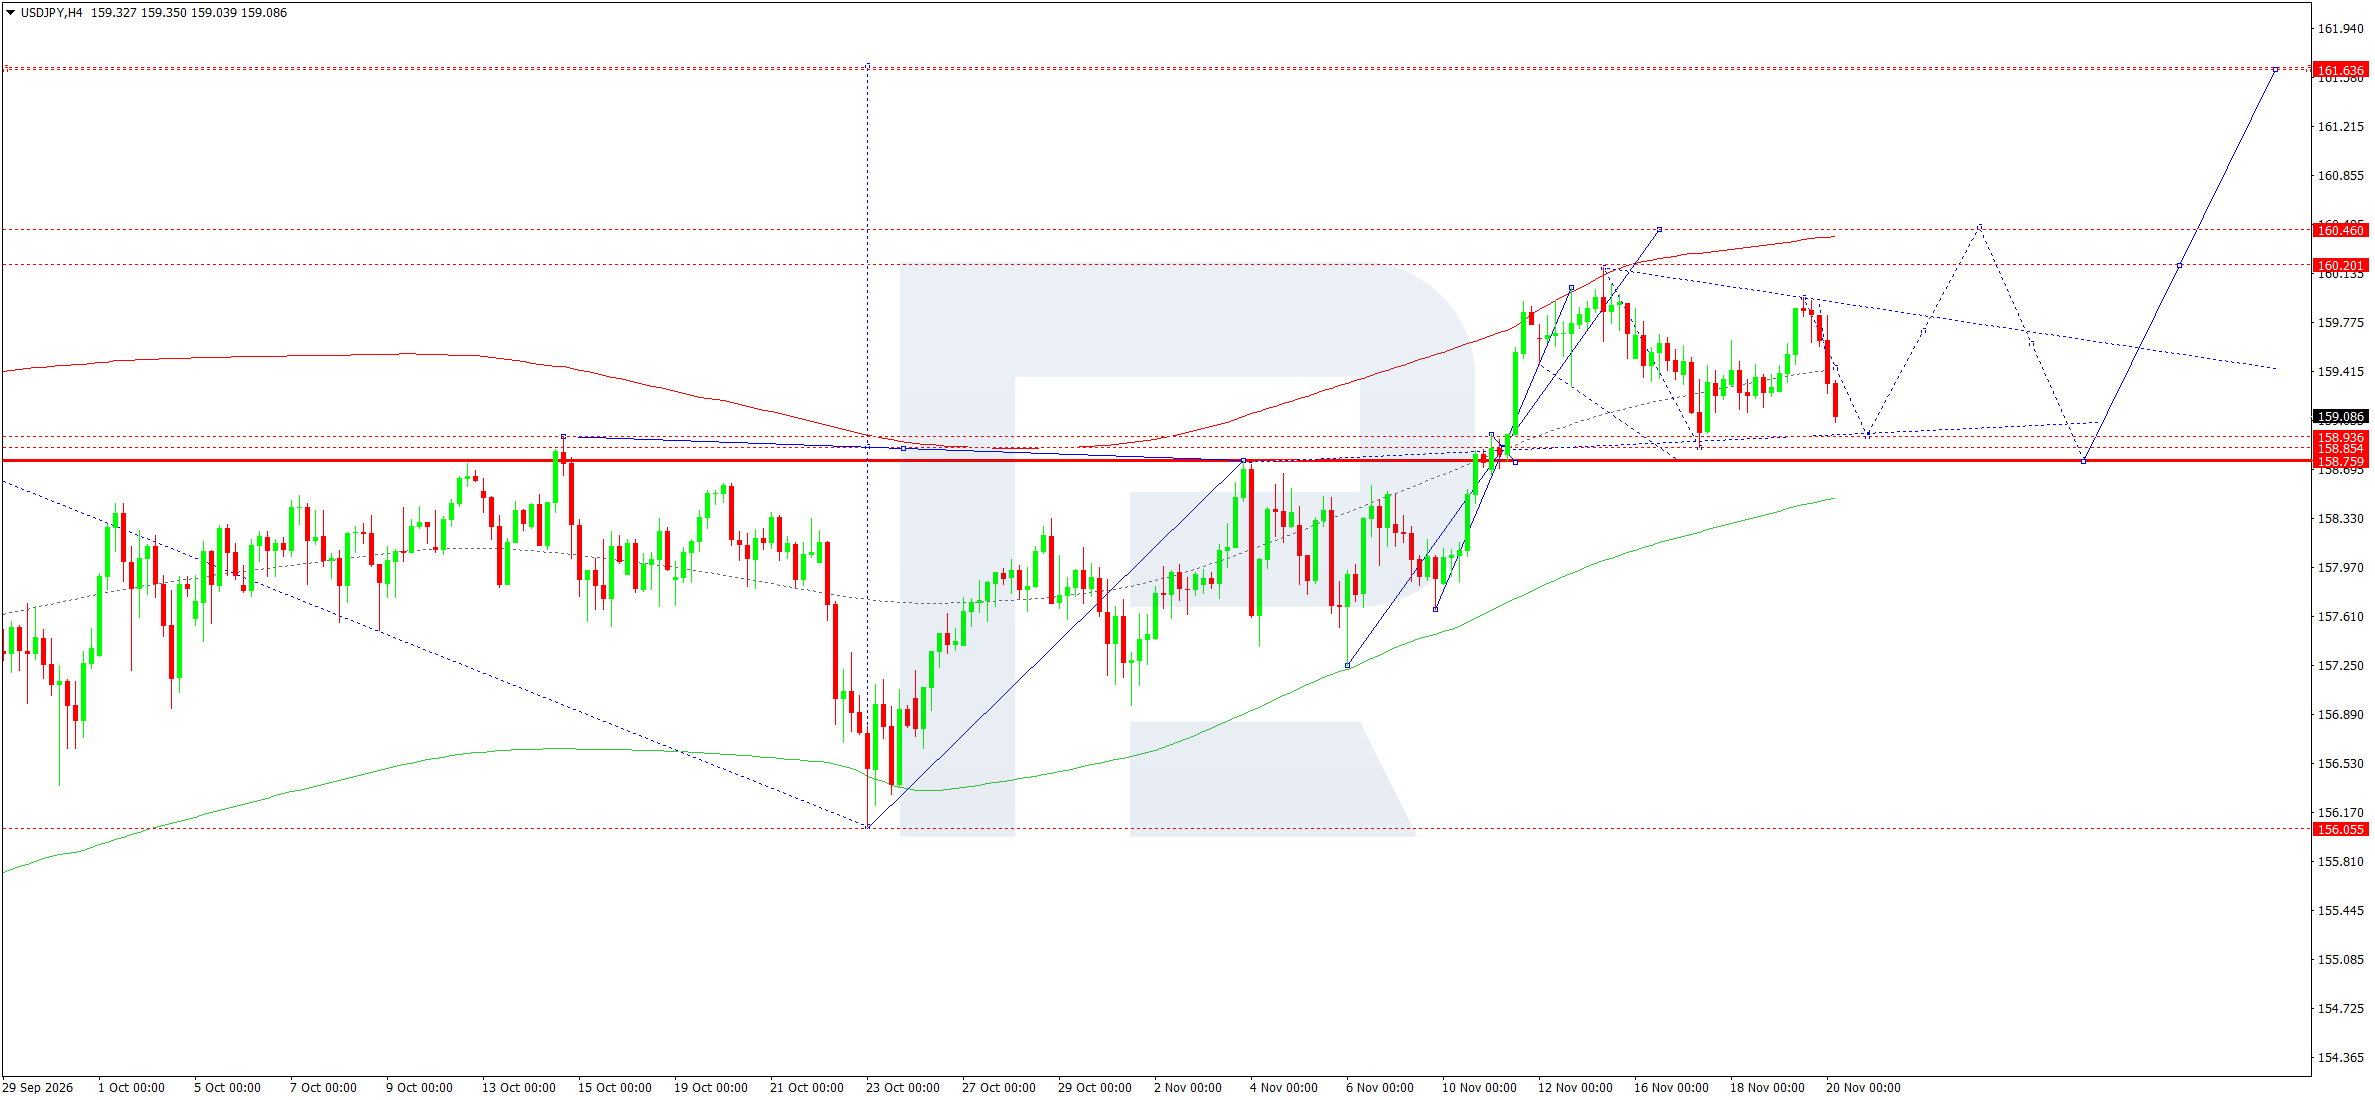
On the H4 chart, the pair retreated after failing to return to 160.00. The low of the latest candlestick was 159.04, while the nearest demand zone lies between 158.76 and 158.94. Horizontal levels and the base of the previous upward impulse converge here. The Elliott wave count suggests that the decline from the November high may be interpreted as a correction of the preceding advance. In the wave matrix, the pivot lies around 158.80, within this area.
For 20 November, the baseline scenario envisages consolidation above 159.04 or a brief test of support around 158.94. A return above 159.14 would provide an early signal of recovery. The first obstacle is the 159.39–159.42 area near the Price Envelope's midline. A break above it would open the way towards 160.20 and then the upper target at 160.46.
After a test of the 160.46 level, a downward wave towards 159.39–159.30 is possible. The further target at 161.64 will become relevant if the price consolidates above 160.46. A four-hour candlestick closing below 158.76 would weaken the bullish scenario, confirming the loss of the area from which the previous impulse developed. The buying scenario assumes that the price crosses the entry level from below after testing the nearest low.
USDJPY forecast scenario
GBPUSD forecast
Annual inflation in the UK accelerated from 3.5% to 3.6% in October. Transport costs, particularly motor fuel, were among the main drivers of the acceleration. Core inflation stood at 2.8%, while services inflation reached 3.7%. Following its November meeting, the Bank of England raised the rate by 25 basis points to 4.00%. Persistently high price growth supports expectations of tight policy, while rising fuel costs restrict consumers' real spending and increase business costs.
The UK's October retail sales figures are due today. In September, sales volumes fell by 0.4% over the month. A weak October reading would deepen doubts about the resilience of consumption amid rising borrowing costs and could renew pressure on sterling. A stronger report could extend the pair's recovery, particularly if US bond yields fall at the same time. On the dollar side, market participants remain cautious following declines in US equity indices. Sterling's response to the UK release will therefore depend on whether changing expectations for the BoE's policy rate are accompanied by an improvement in broader risk appetite.
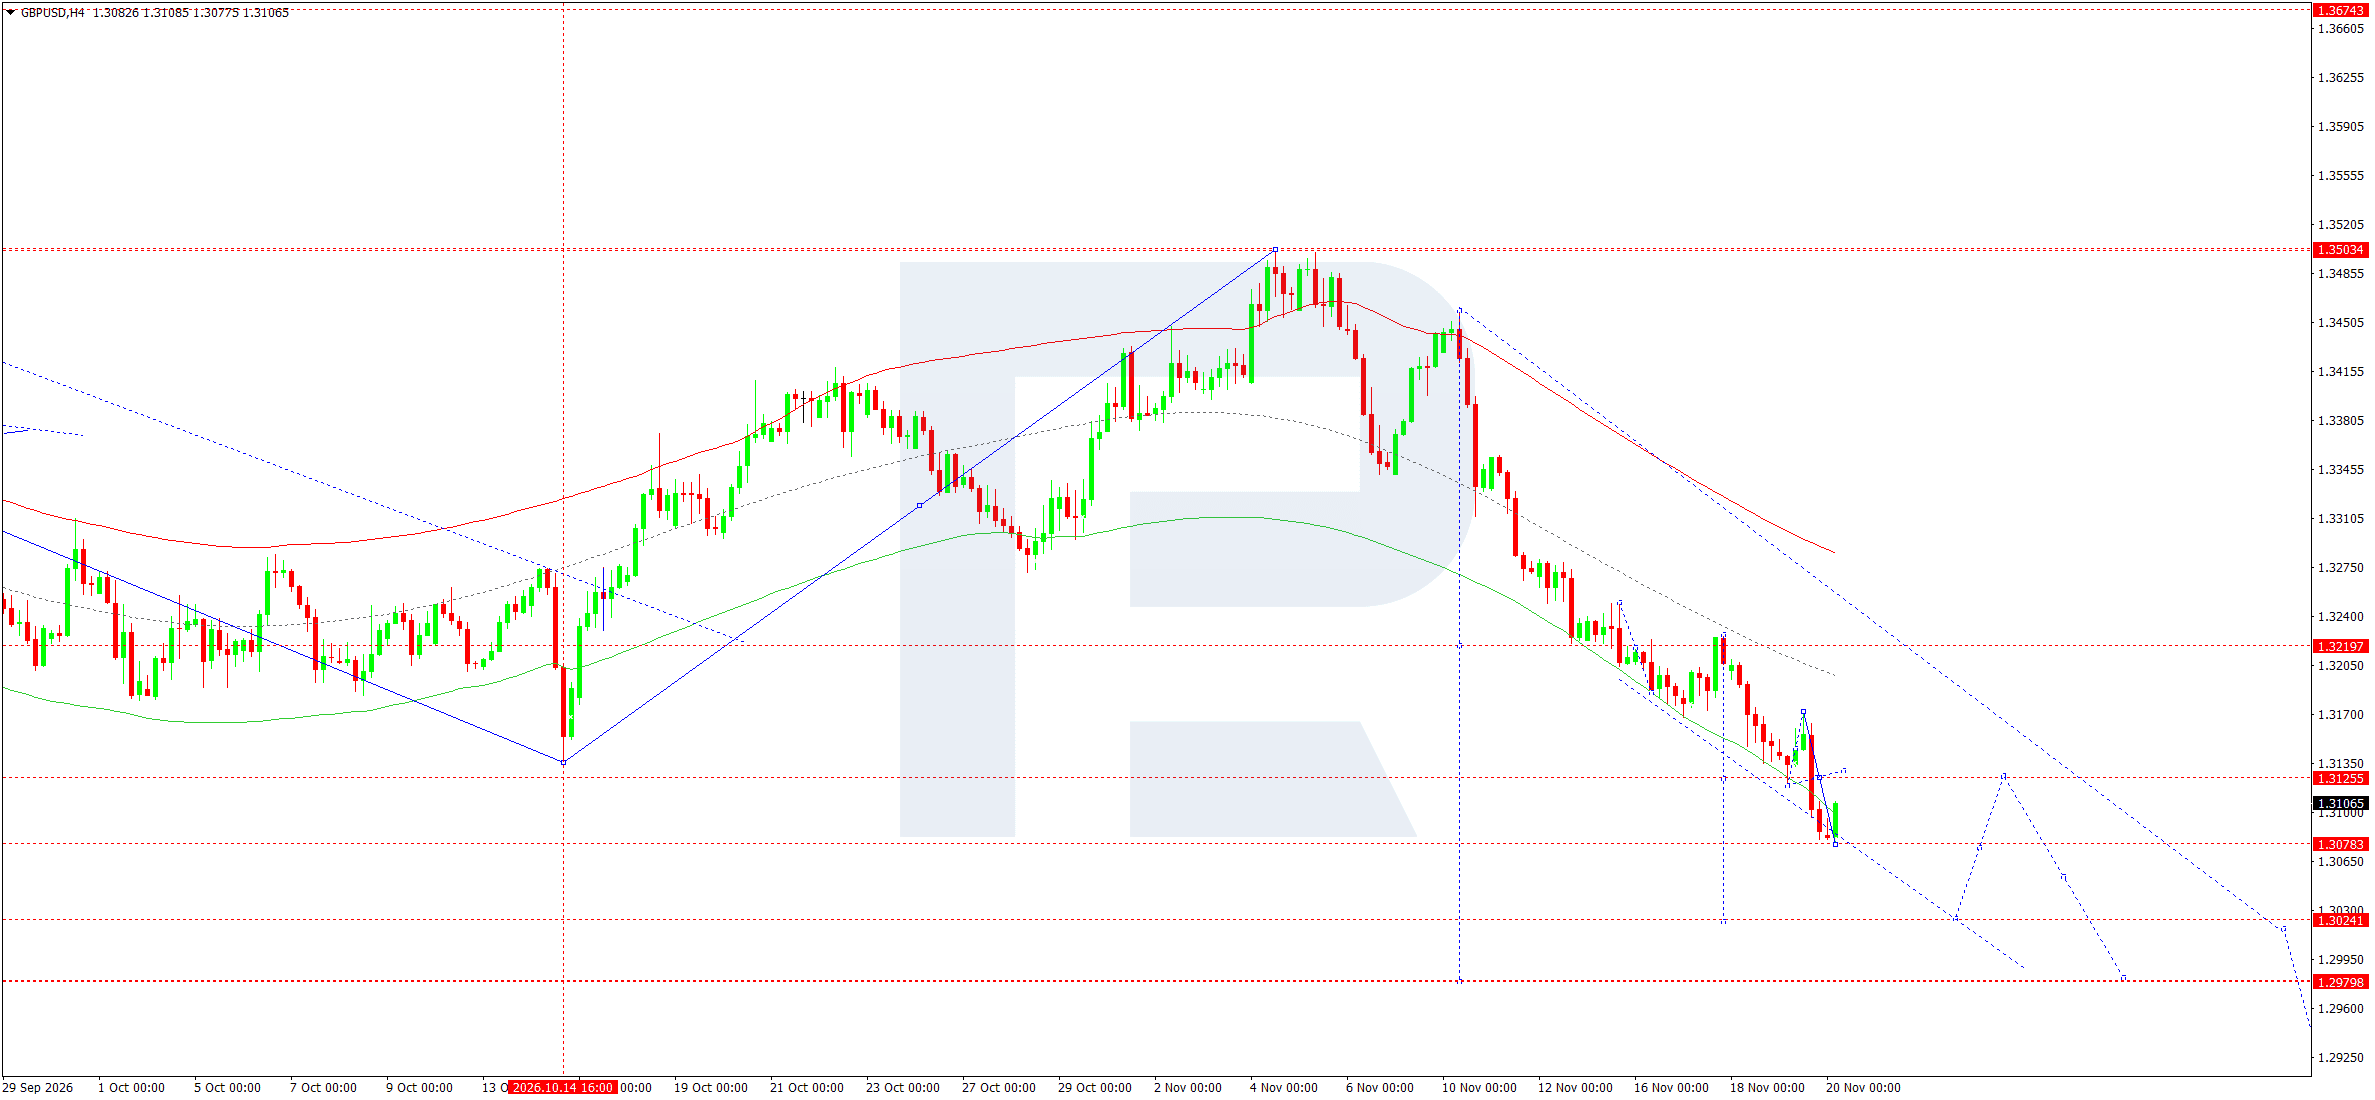
On the H4 chart, sterling continues its downward move from the November high at 1.3503. After the break below 1.3220, sellers steadily pushed local highs lower. The latest candlestick recorded a low near 1.3078 and a recovery towards 1.3107. The nearest resistance lies around 1.3125–1.3126, where the price was previously held before the decline accelerated. This area serves as a reference for assessing the strength of the current rebound.
For 20 November, a rise towards this resistance is possible. If buyers lose the initiative in this area, another downward crossing of the entry level would confirm renewed pressure. A break below 1.3078 would open the way towards 1.3024. After this target is tested, a return towards 1.3120 is possible. If a fresh downward impulse develops, the next reference level will be 1.2980.
The Elliott wave count allows for another downward leg, while the wave matrix pivot is around 1.3250. The Price Envelope boundaries continue to slope downwards. Consolidation above 1.3130 would weaken the immediate bearish scenario and increase the likelihood of a more prolonged recovery. If the low is broken directly, 1.3024 will also remain the nearest marked target.
GBPUSD forecast scenario
AUDUSD forecast
In early November, the Reserve Bank of Australia raised its rate by 25 basis points to 4.85%. Six board members voted for the increase, while three favoured keeping the rate unchanged. In the minutes, the regulator linked the deterioration in the inflation outlook to fuel prices and domestic supply constraints. The Australian Bureau of Statistics reported that the wage price index rose by 1.1% in the September quarter. These figures support expectations that borrowing costs will remain high in Australia and may ease pressure on the national currency.
The external backdrop for AUDUSD remains challenging. The fall in US technology stocks and subsequent weakness in Asian markets point to reduced demand for risk positions. This is important for the Australian dollar even with the RBA's high interest rate, as the currency is sensitive to expectations for industrial demand and export commodity prices. If caution persists in equity markets, any local appreciation of the Australian currency may be short-lived. Stabilisation in Asian equities alongside falling US yields would create more favourable conditions for a corrective rise in the pair.
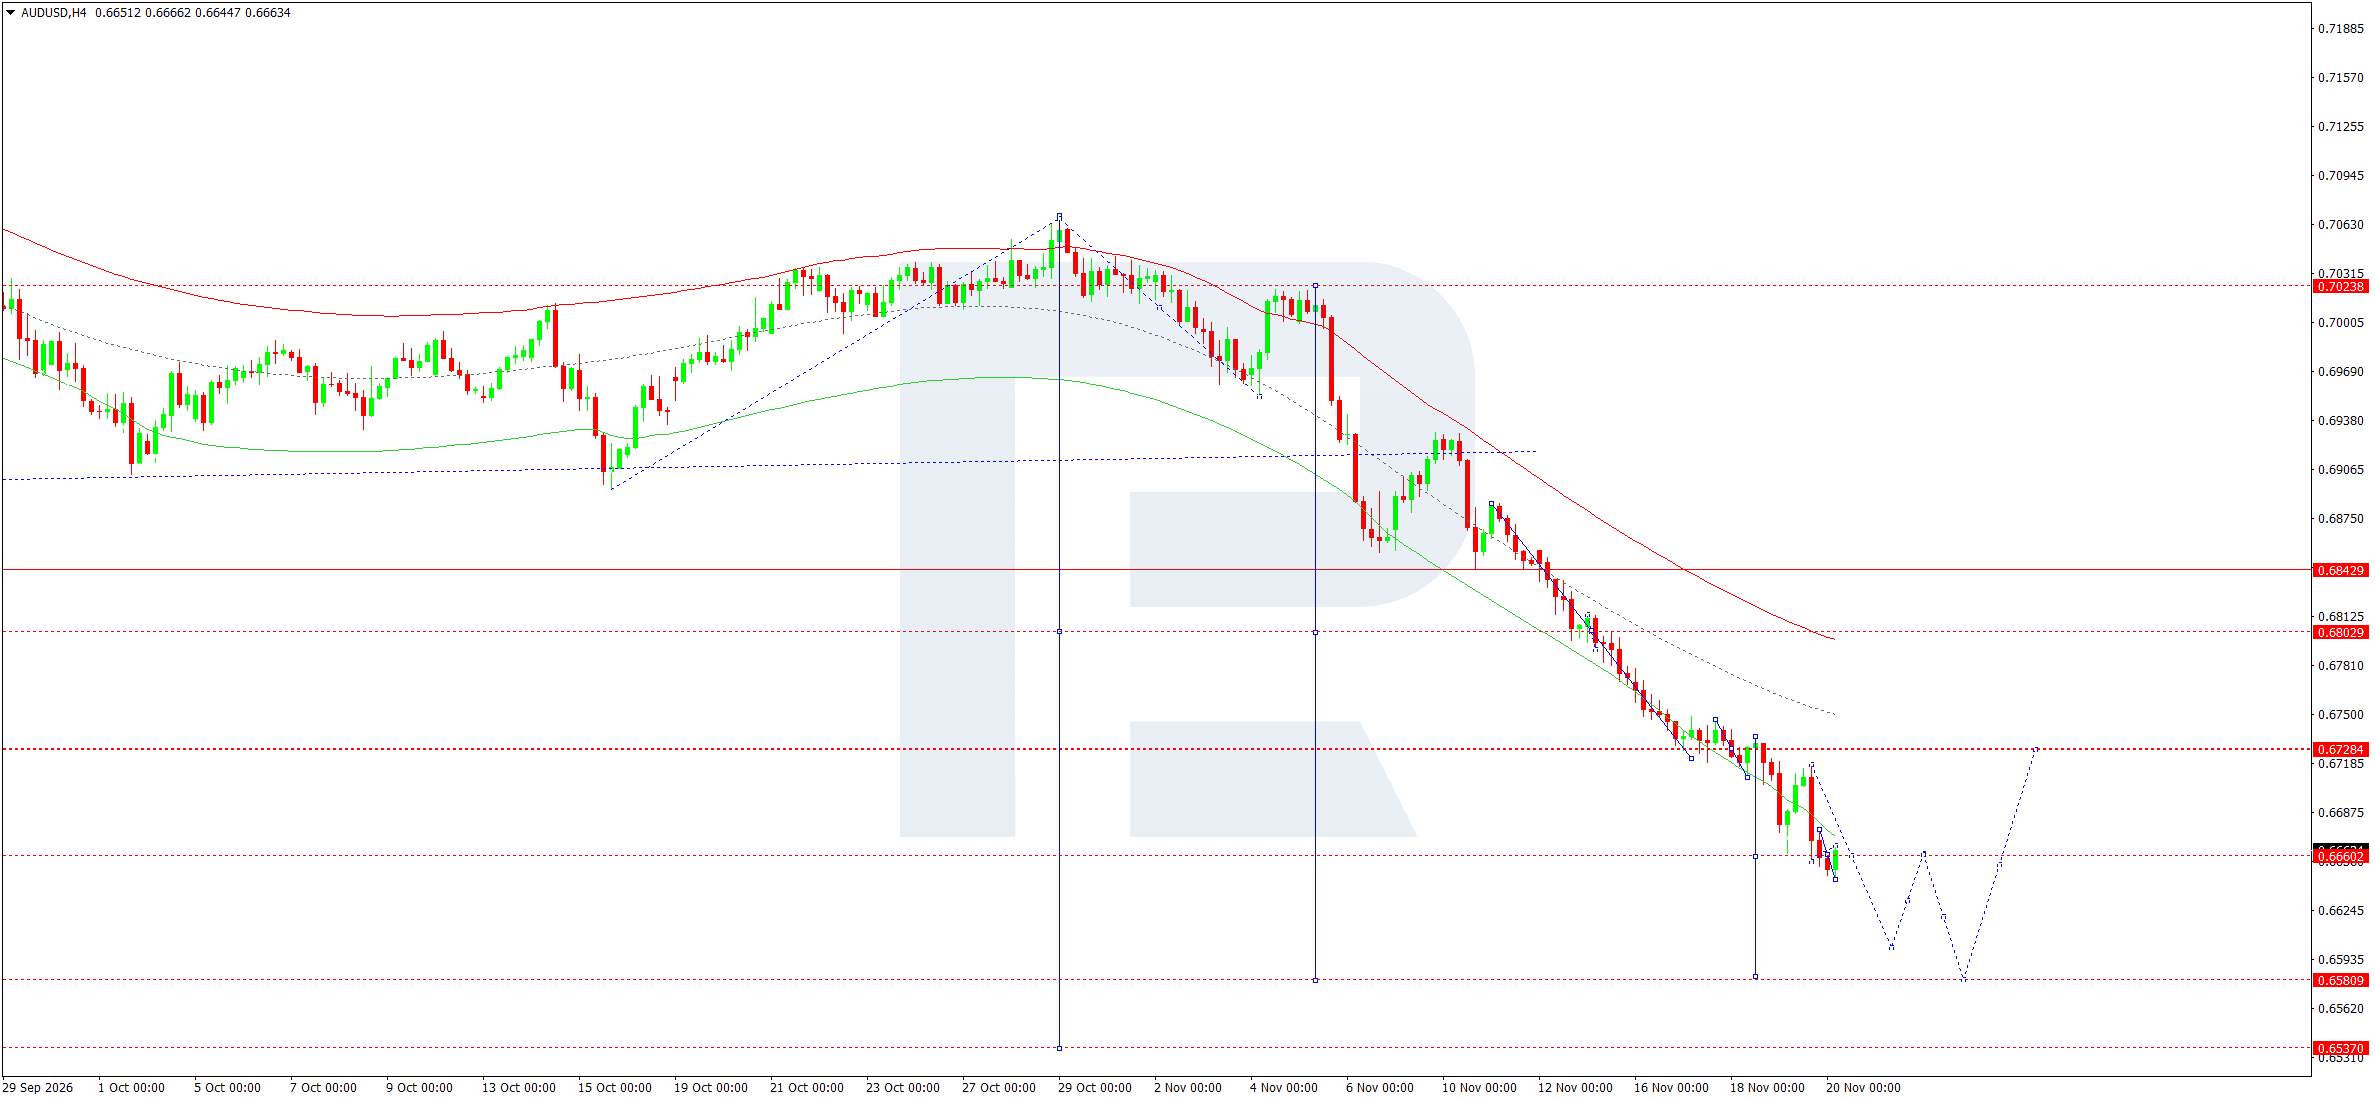
On the H4 chart, the decline extended to 0.6645 after the break below 0.6728. From this low, the price recovered to 0.6663, approaching the consolidation area around 0.6660. The downward slope of the Price Envelope's midline and the series of lower peaks maintain pressure. In the Elliott wave count, the rebound fits within a corrective leg, while the wave matrix pivot around 0.6813 remains significantly above the current price.
For 20 November, a test of the 0.6660–0.6680 zone is likely. A return below 0.6660 after such a test would increase the probability of another decline towards 0.6645. If this low is broken, the nearest marked target lies at 0.6581. The 0.6565 level from the wave projection will become relevant if the impulse continues beyond the first target. With a deeper decline, the next chart support lies around 0.6537.
A sustained break above 0.6680 would increase the likelihood of the rebound extending towards 0.6728. The reference level for the immediate bearish scenario is 0.6685. As long as the price remains below it, the reaction at 0.6680 will indicate whether sellers are ready to continue the move after a local pause. A return below the entry price will provide the selling signal.
AUDUSD forecast scenario
USDCAD forecast
In late October, the Bank of Canada raised its key rate by 25 basis points to 2.50%. Annual consumer inflation remained at 3.1% in October, while the index excluding energy rose by 2.0% year on year. The divergence shows how strongly energy prices influence the headline figure. Expensive oil affects the Canadian dollar through two channels. Support for export revenues benefits the currency, whereas rising fuel prices restrict households' real spending and complicate the assessment of domestic demand.
Canada is due to publish its September retail sales data today. A strong report could strengthen the Canadian dollar if it raises expectations of further tightening by the BoC. Weaker figures could increase upward pressure on USDCAD, particularly if US yields remain high. The nature of oil price movements also matters for the pair. A rise driven by stable demand is generally more favourable for the Canadian currency than a spike caused by supply disruption concerns, which simultaneously reduces global risk appetite and increases demand for the US dollar.
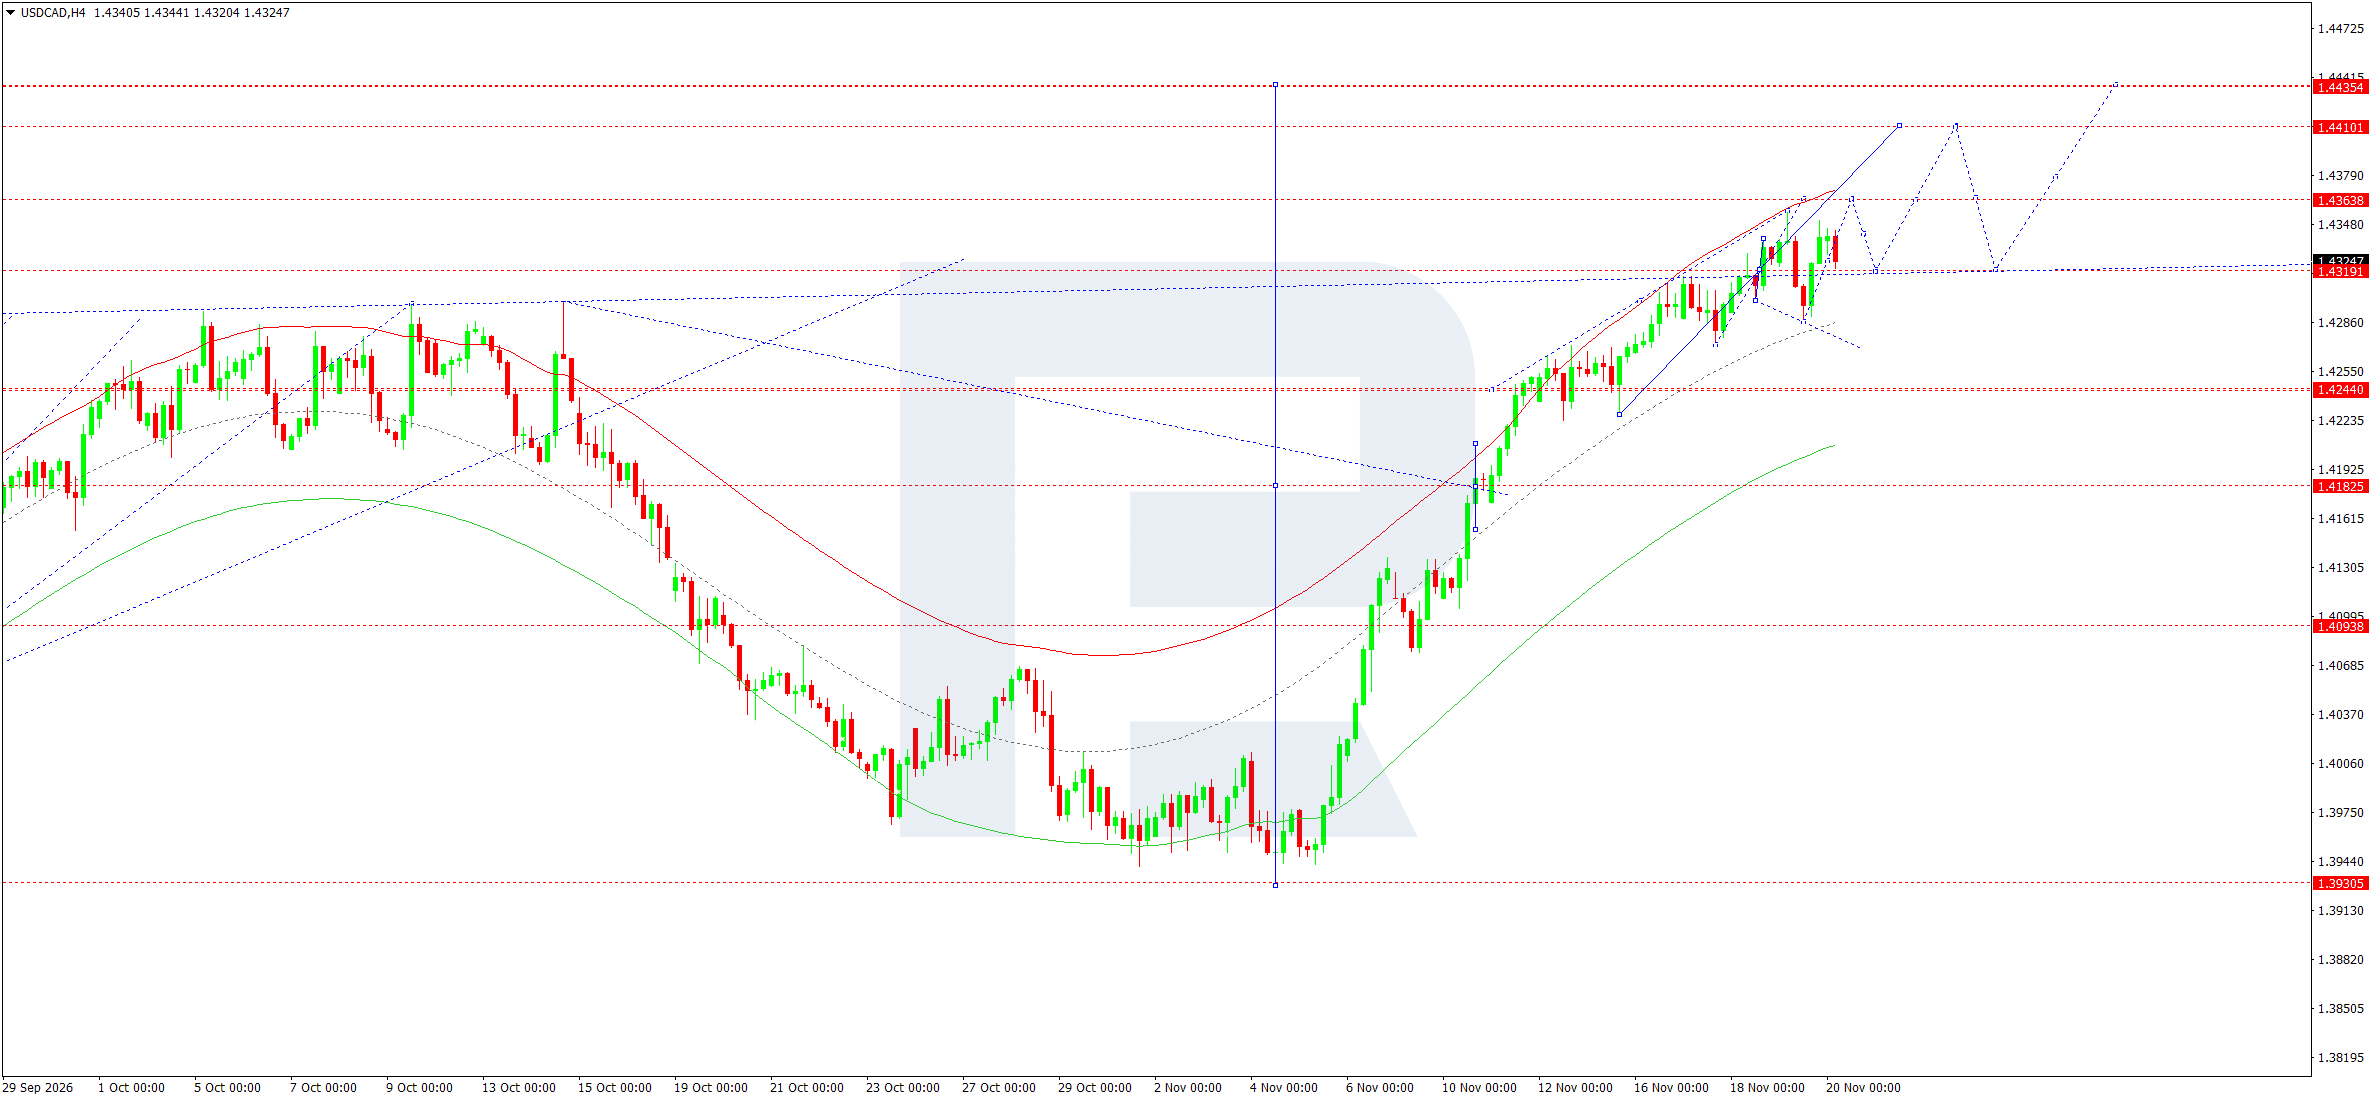
On the H4 chart, the pair maintains the bullish structure formed after the reversal from the 1.3931 area. Another rise encountered selling near 1.4350, after which the price returned to 1.4325. The nearest support is at 1.4319, close to the former resistance zone. A retest of this level will help assess whether buyers can retain the gains from the previous breakout.
For 20 November, the baseline scenario envisages consolidation below 1.4350, with a possible decline towards 1.4319. A return above 1.4330 after testing support would confirm a recovery within the range. A break above 1.4350 would open the way towards 1.4364, where the nearest horizontal resistance lies. If the price consolidates above this level, the next targets will be 1.4410 and then the 1.4430–1.4435 area.
The Elliott wave count allows for a continuation of the November advance, while the calculated wave matrix pivot is around 1.4160. The Price Envelope's midline points upwards, and its upper line runs close to 1.4370. A decline below 1.4315 would invalidate the immediate buying scenario and increase the likelihood of a return to 1.4286. Losing this support would allow consideration of a deeper correction towards the previously breached level at 1.4244.
USDCAD forecast scenario
XAUUSD forecast
For gold, the key factors remain US bond yields, the dollar exchange rate, and news from the Middle East. The Fed minutes published on 18 November showed that a further rate increase was discussed as a possible response to persistent inflation. According to the US Bureau of Labor Statistics' October report, consumer prices rose by 0.4% over the month, while the index excluding food and energy gained 0.3%. This supports expectations that borrowing costs will remain high, increasing the opportunity cost of holding gold.
The decline in ten-year US Treasury yields to 5.04% on Thursday creates conditions for a short-term rebound in the metal. For a more sustained recovery, the direction of real yields matters, as their decline makes an asset that pays no interest relatively more attractive. Geopolitical tensions could support demand for gold as a safe-haven asset. If they also raise energy costs and interest rate expectations, the effect on the metal becomes less clear-cut. Today, the final University of Michigan figures will help assess whether US consumers' inflation expectations are changing and whether there is another reason for the dollar and bond markets to move.
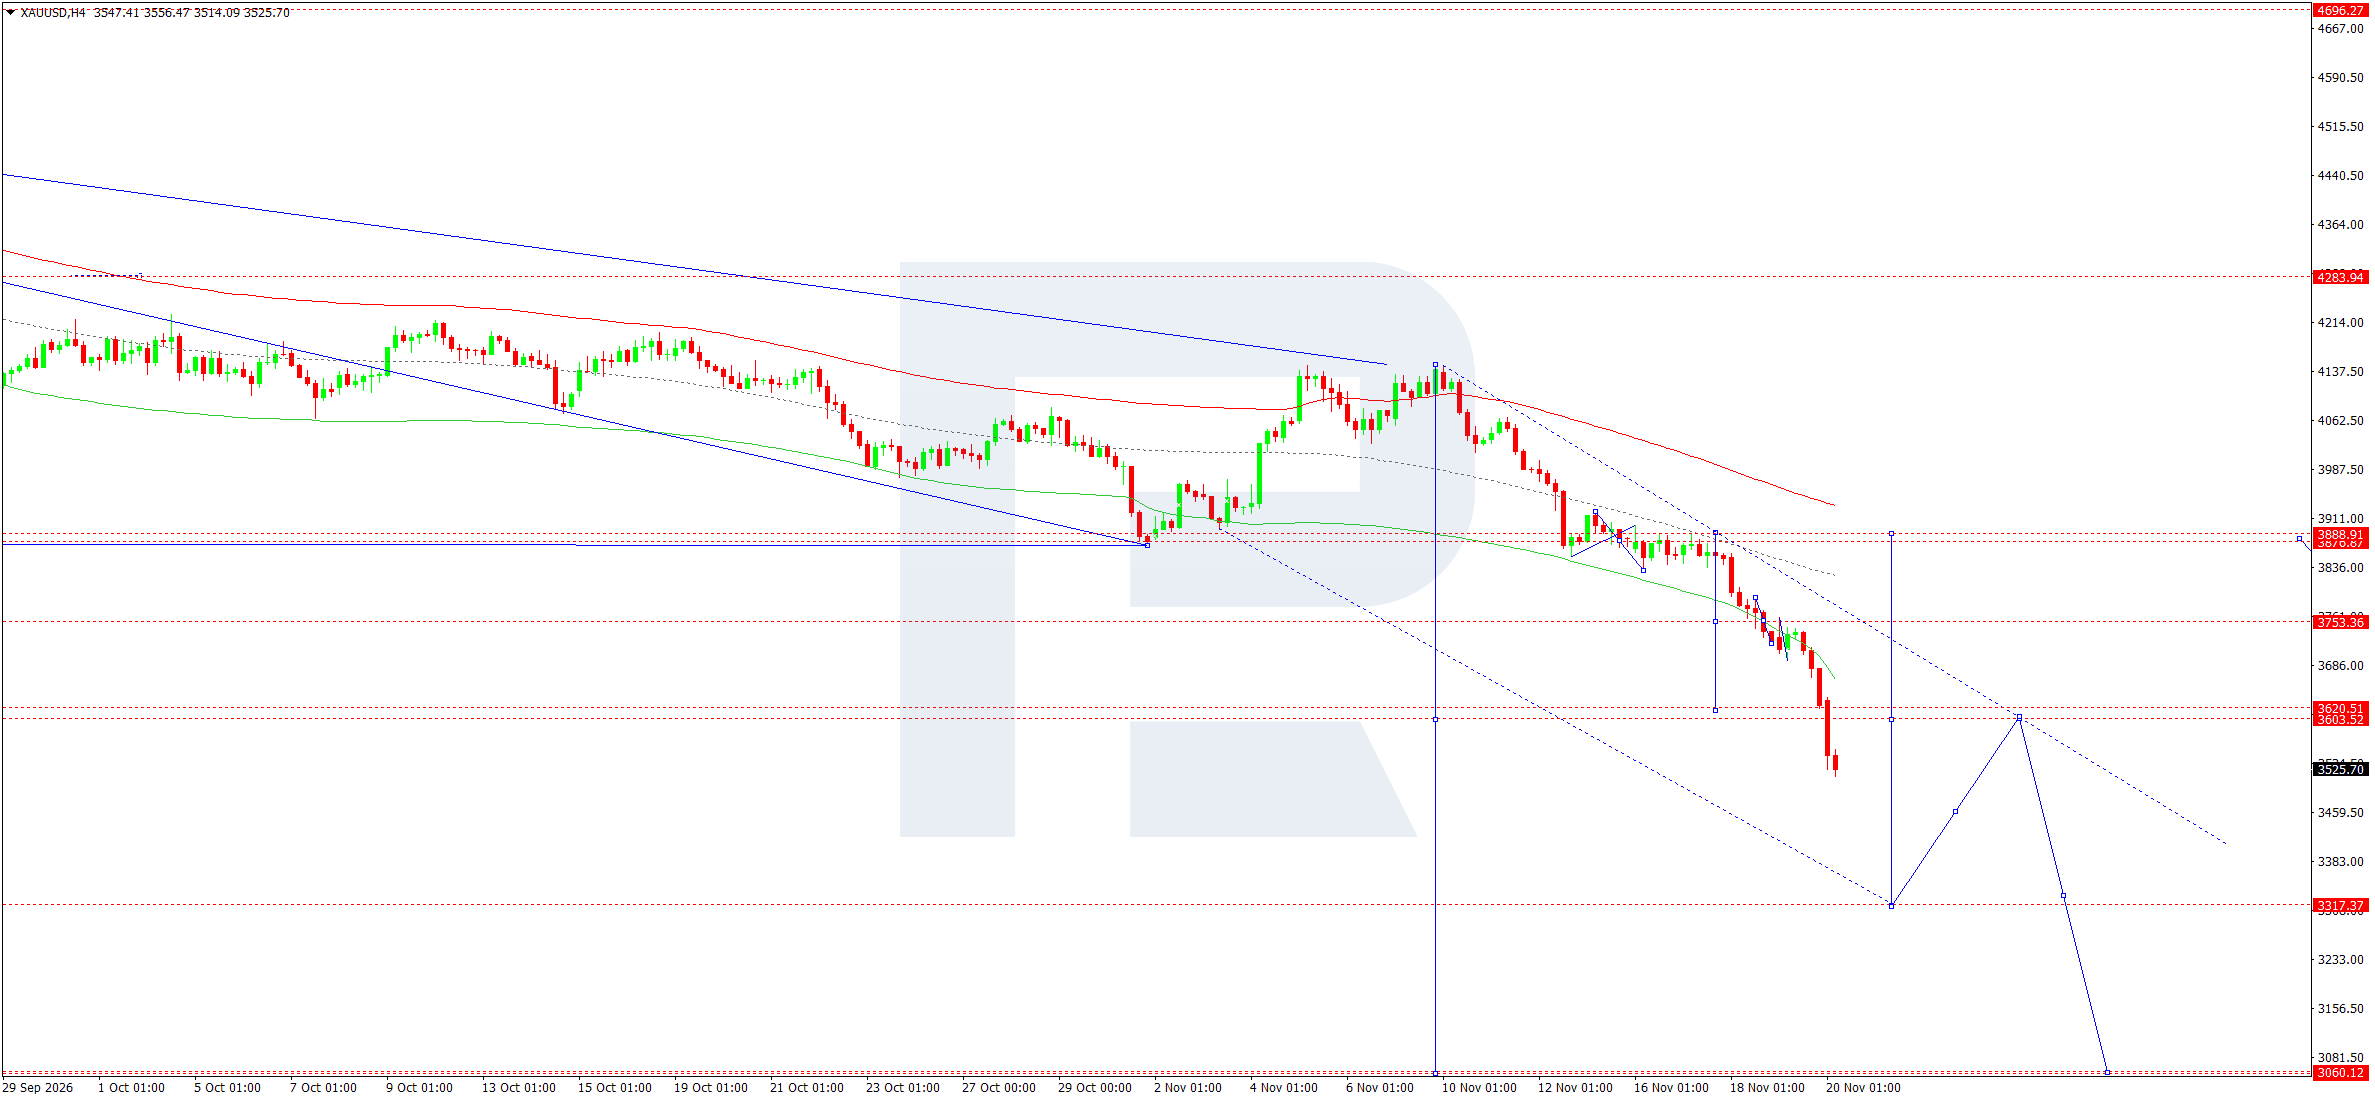
On the H4 chart, gold broke below the 3,604–3,621 area and reached a low of 3,514. The latest price in the snapshot is 3,526. Large bearish candlesticks after the support breakout point to persistent pressure. The price is below the lower boundary of the current Price Envelope. At such a distance from its midline, a sharp technical rebound is possible, particularly if sellers begin taking profits near the local low.
For 20 November, a return towards 3,604 is possible. If buyers encounter supply in the 3,604–3,621 zone, another decline towards 3,521 would increase the likelihood of a test of the 3,514 low. The next marked target after a break below this level is at 3,317, near the lower boundary of the descending channel in the calculated projection. Another rebound towards the breakout area is possible after this target is tested.
The Elliott wave count maintains a downward sequence, while the wave matrix pivot lies around 3,960. Consolidation above 3,621 would delay the lower target and increase the likelihood of a correction towards 3,753. The distant 3,060 target would become relevant if another impulse develops following a decisive break below support at 3,317.
XAUUSD forecast scenario
US 500 forecast
On Thursday, US stock indices declined amid selling in the technology sector. The Nasdaq Composite lost around 2.3%. The initial positive reaction to Anthropic's stock market debut gave way to a broader market decline. In NVIDIA's report published this week, quarterly revenue reached USD 115.8 billion, up 103% year on year. The combination of strong earnings and a falling market shows that valuations of future profits and investors' willingness to pay high multiples also matter for the index.
The yield on ten-year US Treasury bonds fell to 5.04% on Thursday. This level still raises the expected return investors demand from equities, particularly companies whose valuations depend on future growth. Today, the market will receive the final University of Michigan consumer sentiment reading. Rising inflation expectations could add pressure through higher yields. Improving sentiment accompanied by stable price expectations could help equities recover if demand extends across the broader market. If weakness persists in the technology sector, an index rebound will depend on buyers returning to other major segments.
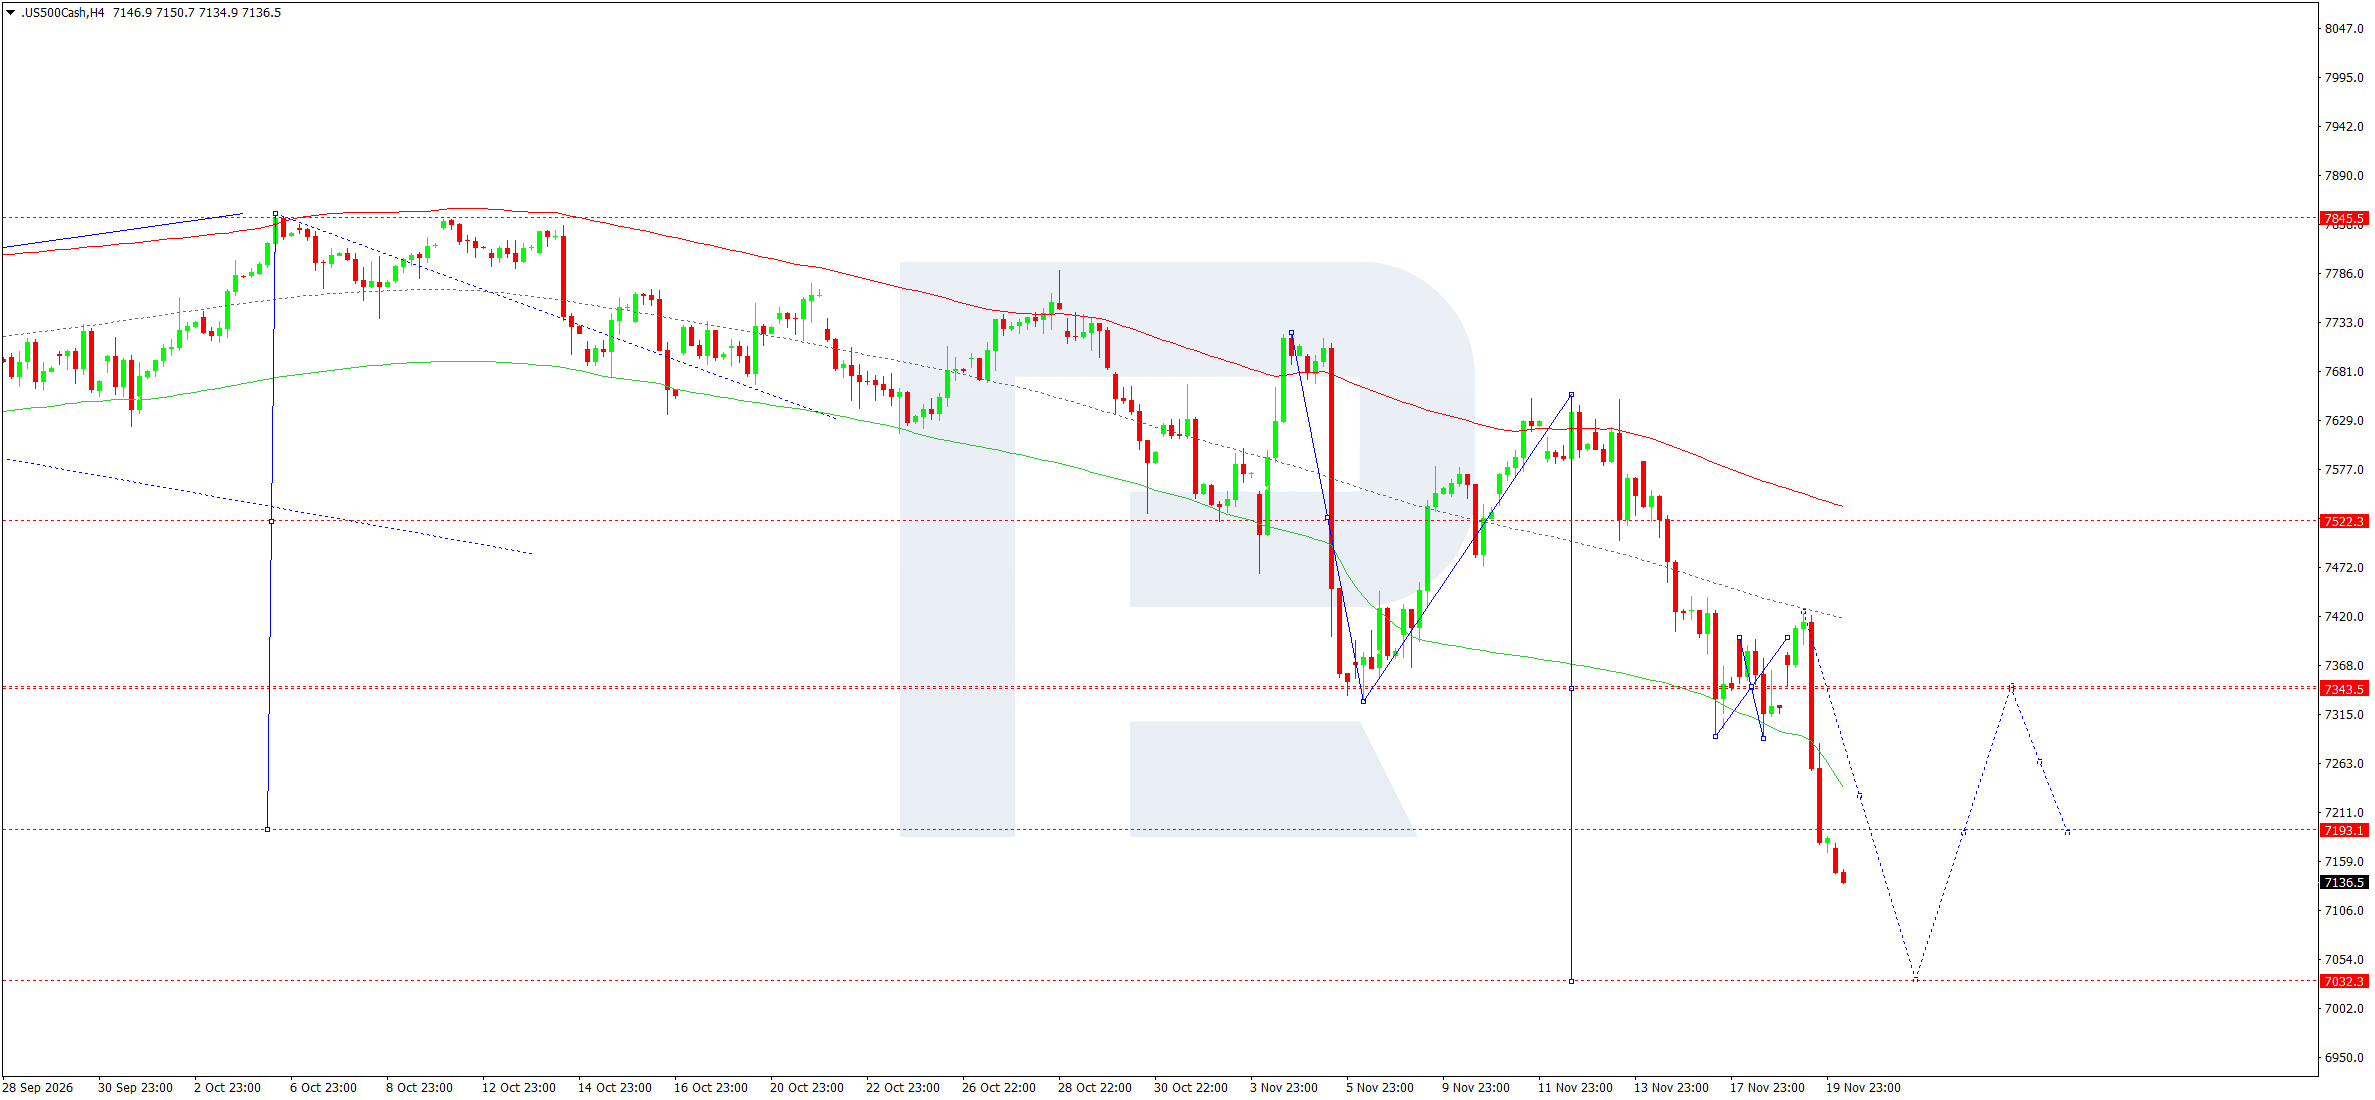
On the H4 chart, the US 500 quote fell below 7,193 and reached the 7,135 area. The latest value in the snapshot rounds to 7,137. Following a failure to recover towards 7,420, sellers formed several consecutive bearish candles. The Price Envelope's midline continues to slope downwards, and the quote is below its lower boundary. This indicates strong momentum while also allowing for a technical recovery after the accelerated decline.
For 20 November, consolidation around 7,130–7,150 and a corrective rise towards 7,193 are possible. A weak buying response at this level would preserve the conditions for a move towards 7,032. If support holds, the next rebound could return the quote to 7,193. A deeper correction towards 7,344 and then 7,408 would require consolidation above the first resistance zone.
In the Elliott wave count, the current structure belongs to a downward wave with a wave matrix pivot around 7,555. The 6,835 level is a more distant calculated target if 7,032 is broken and another impulse develops. A sustained return above 7,193 would delay the immediate bearish scenario and increase the likelihood of a recovery.
US 500 forecast scenario
BTCUSD forecast
Bitcoin begins the day against a backdrop of deteriorating risk appetite following the decline in US equities. Weakness in the technology sector matters for BTCUSD because, when leverage is reduced, participants may simultaneously cut positions across several volatile asset classes. High US interest rates make cash instruments more attractive and may restrain inflows into assets whose returns depend on price appreciation. In this environment, Bitcoin's short-term recovery attempts are sensitive to whether equities and the dollar stabilise.
The Fed minutes published this week gave the market reasons to consider the possibility of further tightening if inflation remains persistent. Today, attention will focus on the final reading of US consumer sentiment and inflation expectations. An increase in the latter could lift yields and intensify pressure on the cryptocurrency. Falling yields could offer some respite if the sell-off in equities also slows. Friday's trading dynamics ahead of the weekend are also important. In Bitcoin's round-the-clock market, lower liquidity may amplify price movements around technical levels, particularly when the price has already approached the recent lows.
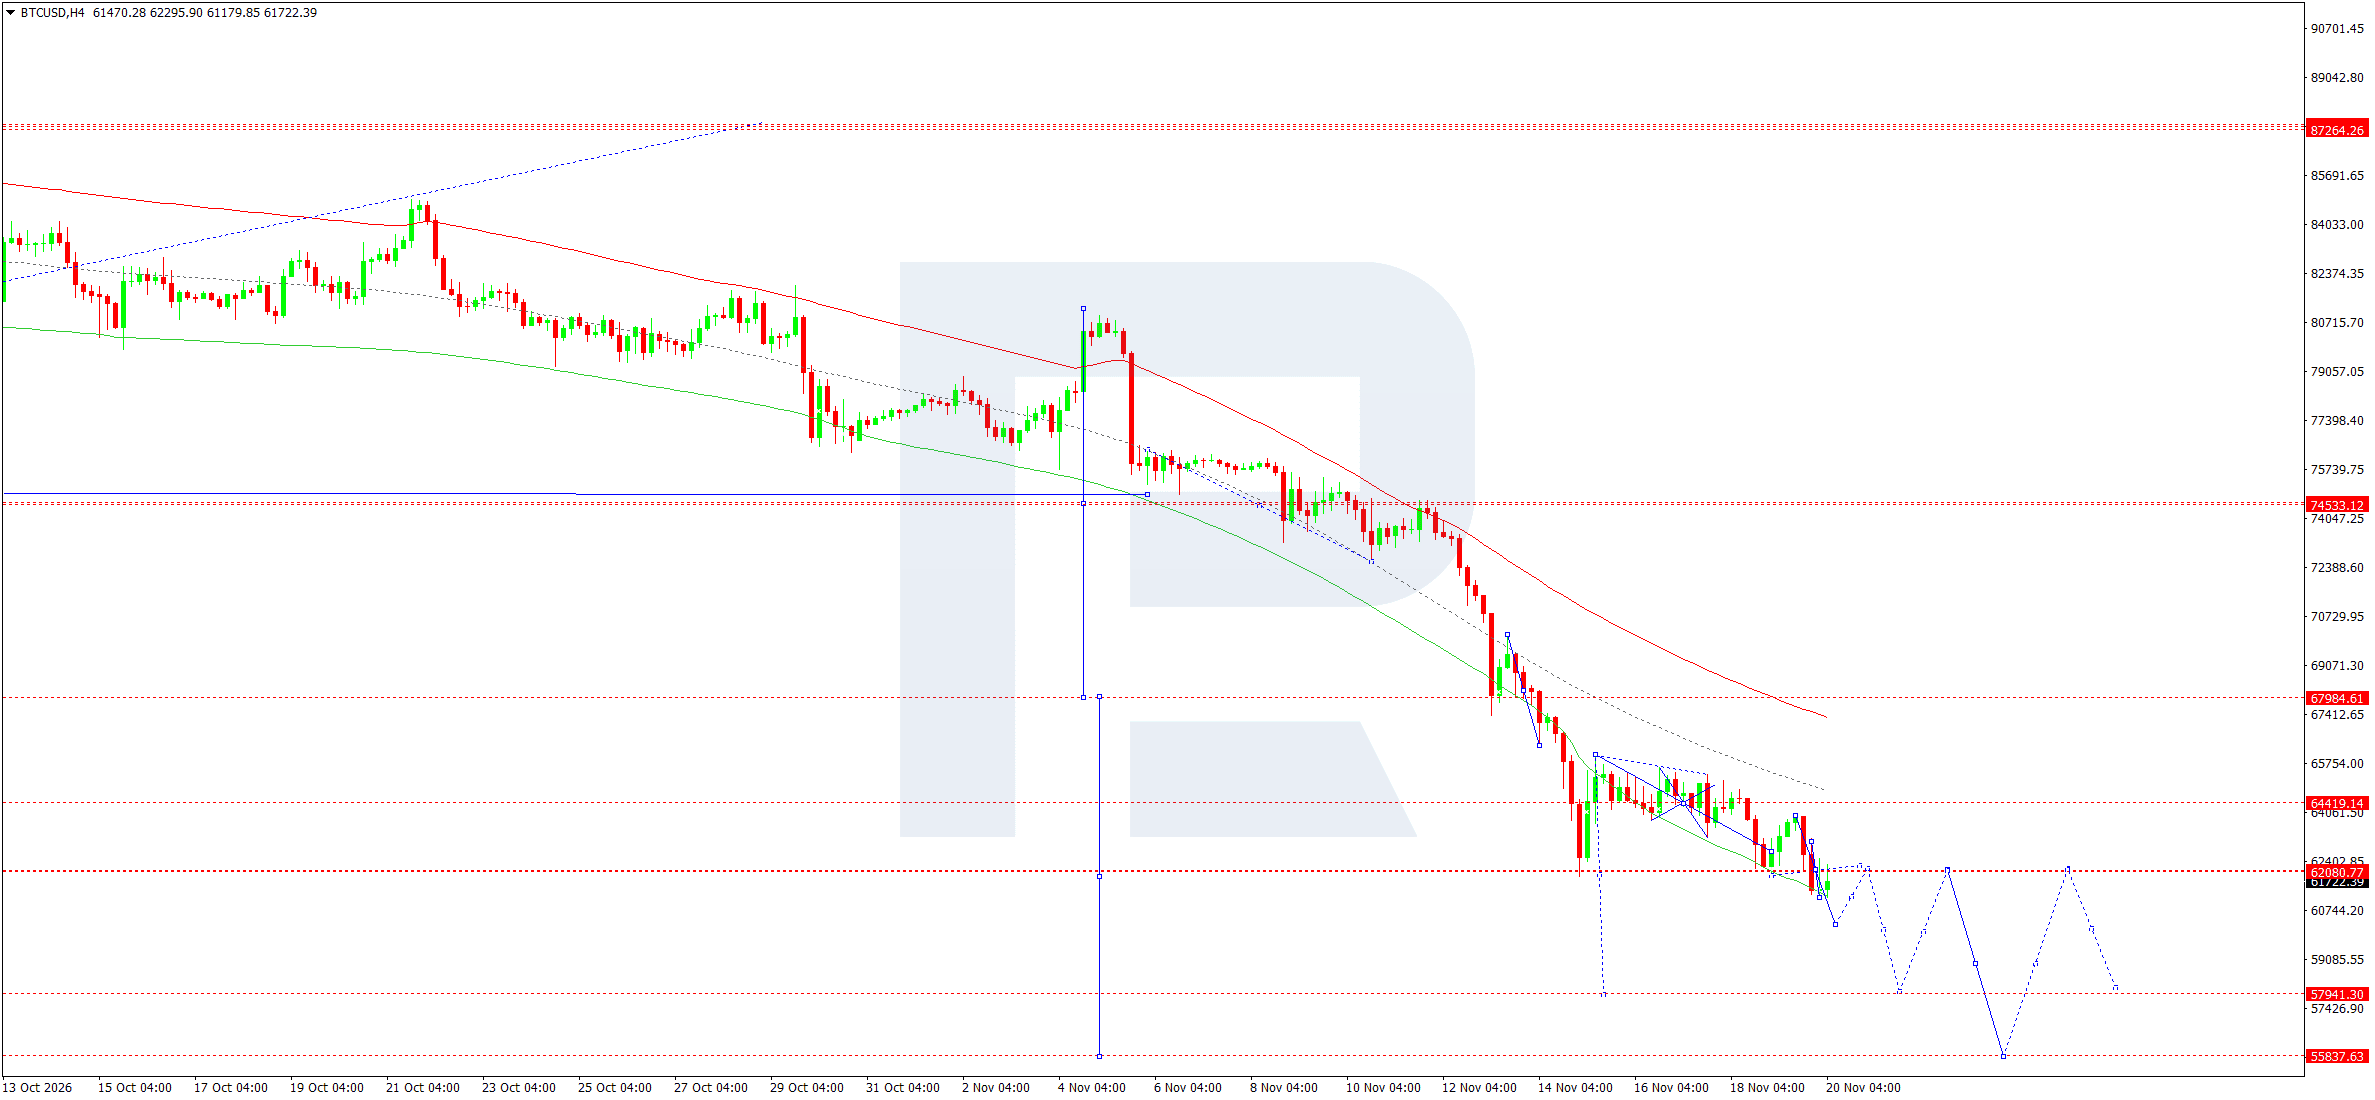
On the H4 chart, the sequence of lower highs persists after the loss of 64,419. The latest candlestick recorded a low of 61,180 before the price returned to 61,722. The 62,081 level, which previously provided support, has become the nearest area for testing supply. The high of the latest candlestick is around 62,296, so the reaction across the 62,081–62,296 area is important when assessing the rebound. As long as upward attempts end within this zone, the risk of renewed decline remains elevated.
For 20 November, consolidation above 61,180 and an attempt to return to 62,081 are likely. A rejection from resistance followed by a break below 61,180 would open the way towards 58,555, an intermediate target in the wave scenario. The next horizontal support on the chart is at 57,941. If that is broken, the next target will shift to 55,838. A recovery above 62,300 would increase the likelihood of a move towards 64,419 and invalidate the immediate selling scenario.
The Elliott wave count suggests continued downward momentum, while the calculated wave matrix pivot is around 74,819. The Price Envelope's midline is declining. The reaction at 62,081 will show whether the current rebound is sufficient to form a broader correction.
BTCUSD forecast scenario
Editors’ picks


EURUSD forecast 2026–2027: technical analysis, price levels & predictions
The EURUSD outlook for 2026 and 2027: key levels on the daily chart, three trading scenarios and the policy gap between the Fed and the ECB that drives the pair.

Gold (XAUUSD) forecast 2026: technical analysis, price levels & predictions
Where gold could trade in 2026: key levels, three trading scenarios with entry triggers and the forecasts from J.P. Morgan, Deutsche Bank and Goldman Sachs.
Forecasts presented in this section only reflect the author’s private opinion and should not be considered as guidance for trading. RoboForex bears no responsibility for trading results based on trading recommendations described in these analytical reviews.