Weekly technical analysis and forecast (22–26 December 2025)
This weekly technical analysis highlights the key chart patterns and levels for EURUSD, USDJPY, GBPUSD, AUDUSD, USDCAD, gold (XAUUSD), and Brent crude oil to forecast market moves for the upcoming week (22–26 December 2025)
Major technical levels to watch this week
- EURUSD: Support: 1.1616, 1.1430. Resistance: 1.1800, 1.1850
- USDJPY: Support: 154.00, 151.00. Resistance: 157.00, 157.80
- GBPUSD: Support: 1.3145, 1.3000. Resistance: 1.3455, 1.3530
- AUDUSD: Support: 0.6555, 0.6484. Resistance: 0.6622, 0.6680
- USDCAD: Support: 1.3700, 1.3670. Resistance: 1.3970, 1.4160
- Gold: Support: 4,275, 4,150. Resistance: 4,377, 4,444
- Brent: Support: 58.55, 58.00. Resistance: 63.66, 68.70
EURUSD forecast
The fundamental backdrop for the EURUSD pair over the coming week takes shape under the combined influence of geopolitical risks, differences in the monetary policy stance of the Fed and the ECB, as well as growing structural doubts about the resilience of the eurozone’s financial system. Together, these factors continue to favour the US dollar and limit the euro’s upside potential.
An escalation in the geopolitical situation in the Caribbean increases global uncertainty and lifts demand for safe-haven assets. In such conditions, the US dollar traditionally acts as the key safe-haven currency, benefiting from its role in international settlements and high liquidity.
For the euro, this factor stays negative, as rising geopolitical tension accelerates capital outflows from risky and politically sensitive assets, a category that the market increasingly applies to European instruments.
The US Federal Reserve continues to show a more hawkish stance than the European Central Bank. Even with signs of slower inflation, the Fed remains ready to keep rates elevated for longer than the market expects.
The ECB, in turn, has to factor in weak eurozone growth and limited room for further policy tightening.
The EU’s discussion of possible decisions regarding frozen Russian assets deserves separate attention. Regardless of the final format of these decisions, the very fact of such debates:
#.raises investors’ sensitivity to legal and institutional risks in the eurozone,
#.increases caution among international reserve holders,
#.supports a gradual rise in the euro risk premium.
The market interprets this factor not as a short-term trigger, but as a long-term source of uncertainty that reduces the euro’s appeal as a reserve currency and strengthens the tendency to diversify towards the US dollar and gold.
Market participants mostly view EURUSD gains as corrective rather than the start of a sustained upwards trend.
Lower liquidity at year-end adds another factor, as it increases the importance of technical levels and raises the probability of impulsive moves when price breaks out of ranges.
The combination of fundamental drivers — geopolitical risks, the Fed’s advantage in monetary policy, and rising uncertainty in the eurozone — confirms the current technical picture and supports the priority of a bearish scenario for EURUSD.
EURUSD technical analysis
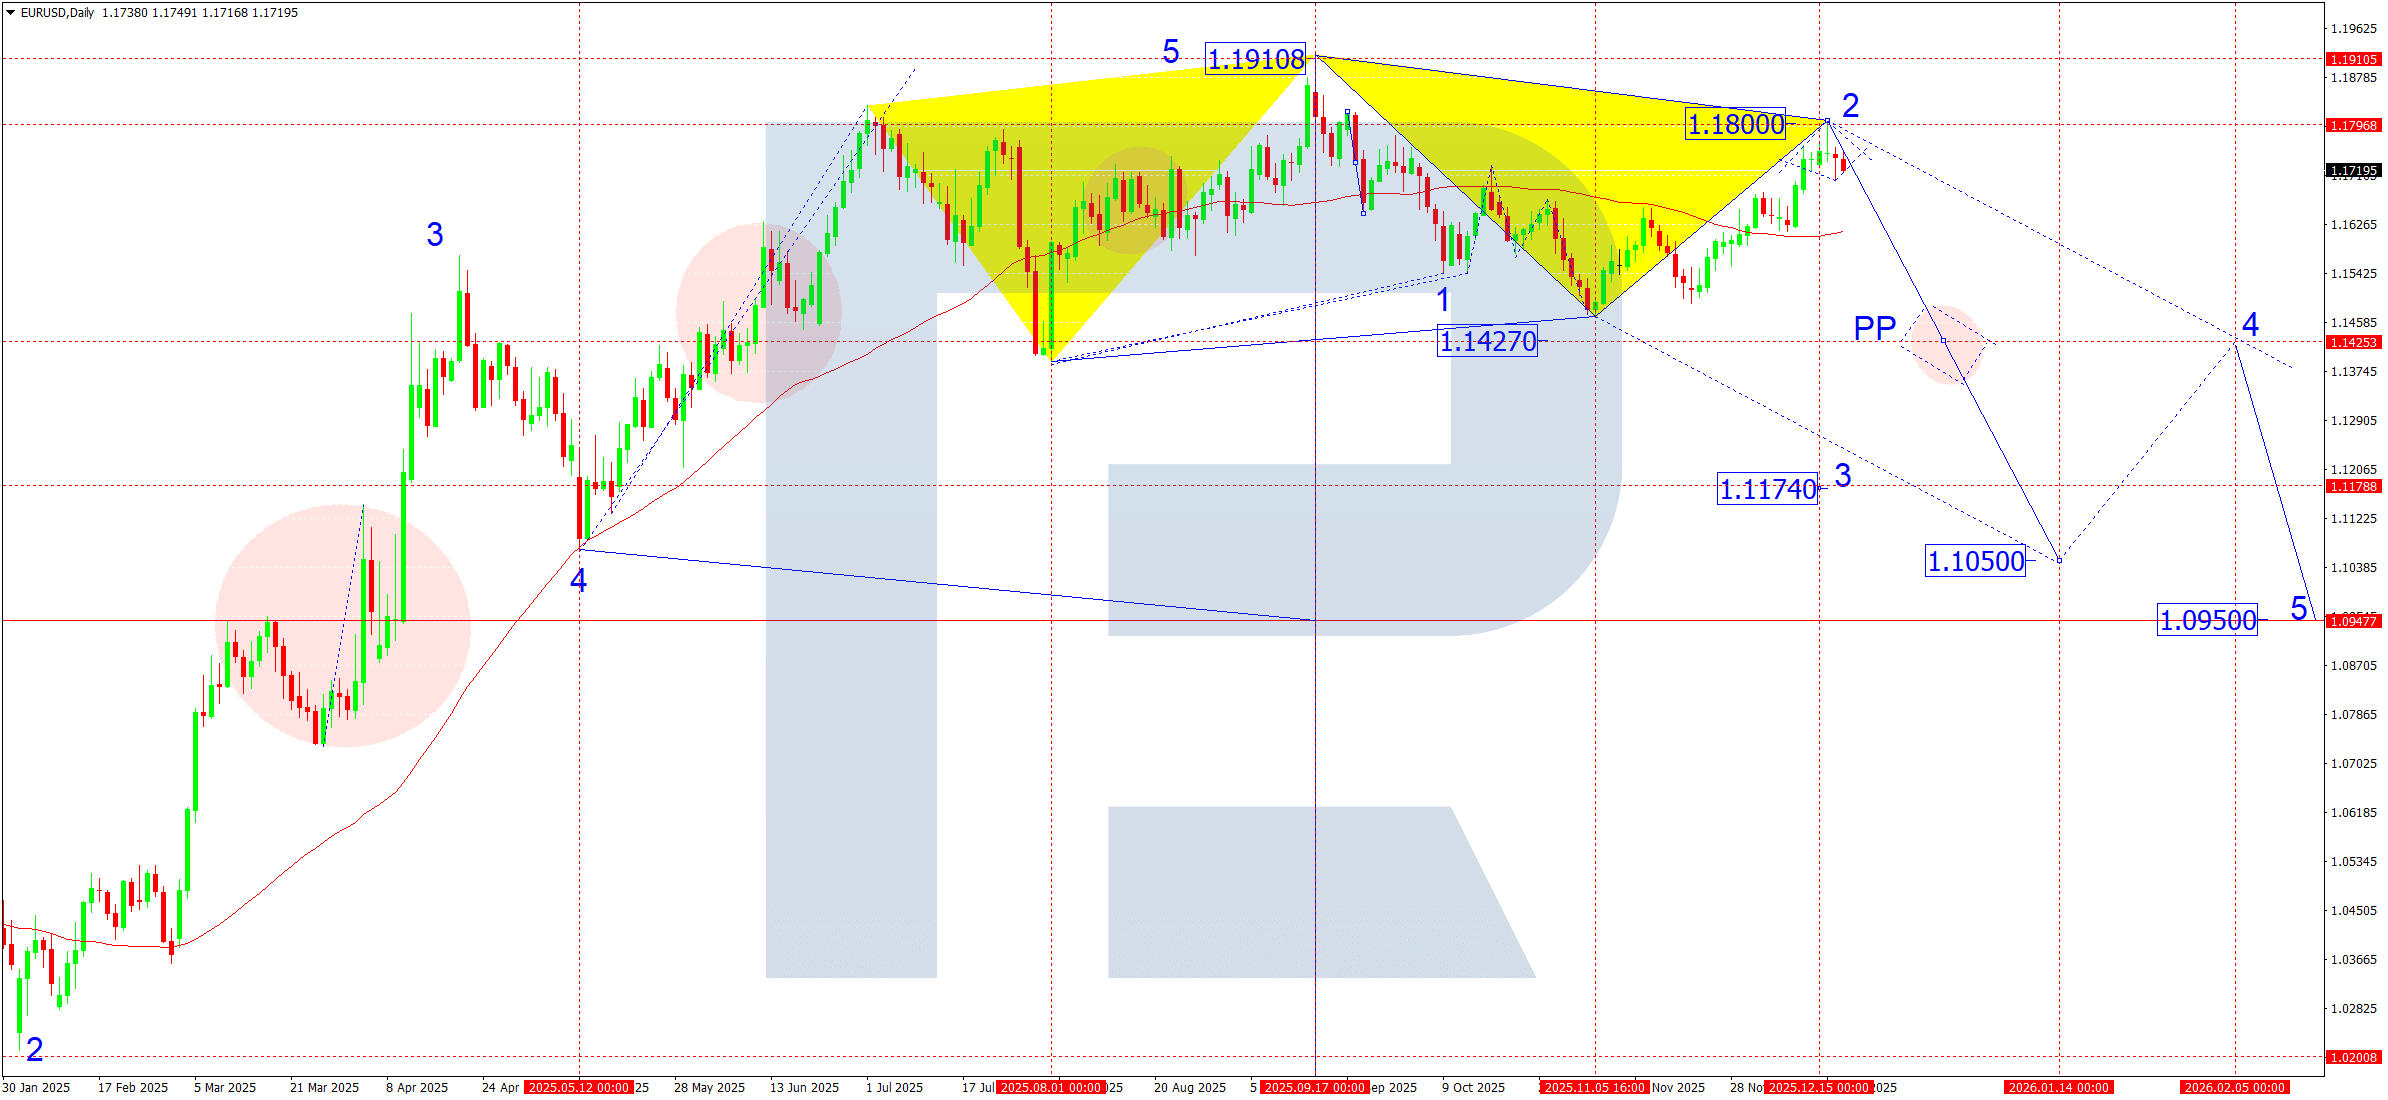
On the daily EURUSD chart, the market formed the first downward wave to 1.1473 and a correction to 1.1800. At the moment, the market is forming a consolidation range around 1.1750. Over the coming week, we anticipate a break to the downside and an expansion of the move to 1.1616. At that level, the market may receive support from the SMA 50, which could send it into a short-term correction towards 1.1700. After this correction ends, it will make sense to consider the likelihood of a downward wave developing towards 1.1427, with the trend potentially extending to 1.1174 at minimum. The target is local.
EURUSD forecast scenarios
Bearish scenario (baseline): at the moment, the market is forming a consolidation range below 1.1800. Within this range, the market formed a downward impulse and its correction. With a break lower out of the range, the market will open potential to decline towards 1.1616, 1.1430, 1.1174, 1.1050.
Bullish (alternative, unlikely): if the market breaks above 1.1800 on rising volumes, then we can consider the probability of the wave continuing towards 1.1900.
USDJPY forecast
The USDJPY pair keeps a medium-term upwards trend, although the market has now moved into a phase of local correction and consolidation after reaching the calculated local target of the growth wave. The fundamental backdrop remains moderately supportive for the US dollar, while the yen continues to face structural pressure from the Bank of Japan’s monetary policy.
The Fed is in a pause phase after a prolonged tightening cycle. The market has already largely priced in expectations of future easing in 2026, which limits the potential for a sharp further rise in the dollar.
However:
#.US Treasury yields remain at relatively high levels;
#.the yield differential between the US and Japan remains significant.
This creates conditions for sustained demand for the dollar in the medium term, but without a pronounced impulse, which correlates well with the current consolidation phase on the chart.
The Bank of Japan maintains an ultra-loose stance despite a gradual rise in domestic inflation expectations. Any talk of policy normalisation remains cautious.
The market treats the yen as a funding currency, which:
#.limits the depth of USDJPY corrections;
#.supports the scenario of building a higher base ahead of the next growth wave.
The final full trading week of the year traditionally comes with:
#.lower liquidity;
#.greater sensitivity to technical levels;
#.sharper, but often short-lived, impulses.
This increases the likelihood of false breakouts within the range, which fits well with the scenario of forming a new consolidation zone.
USDJPY technical analysis
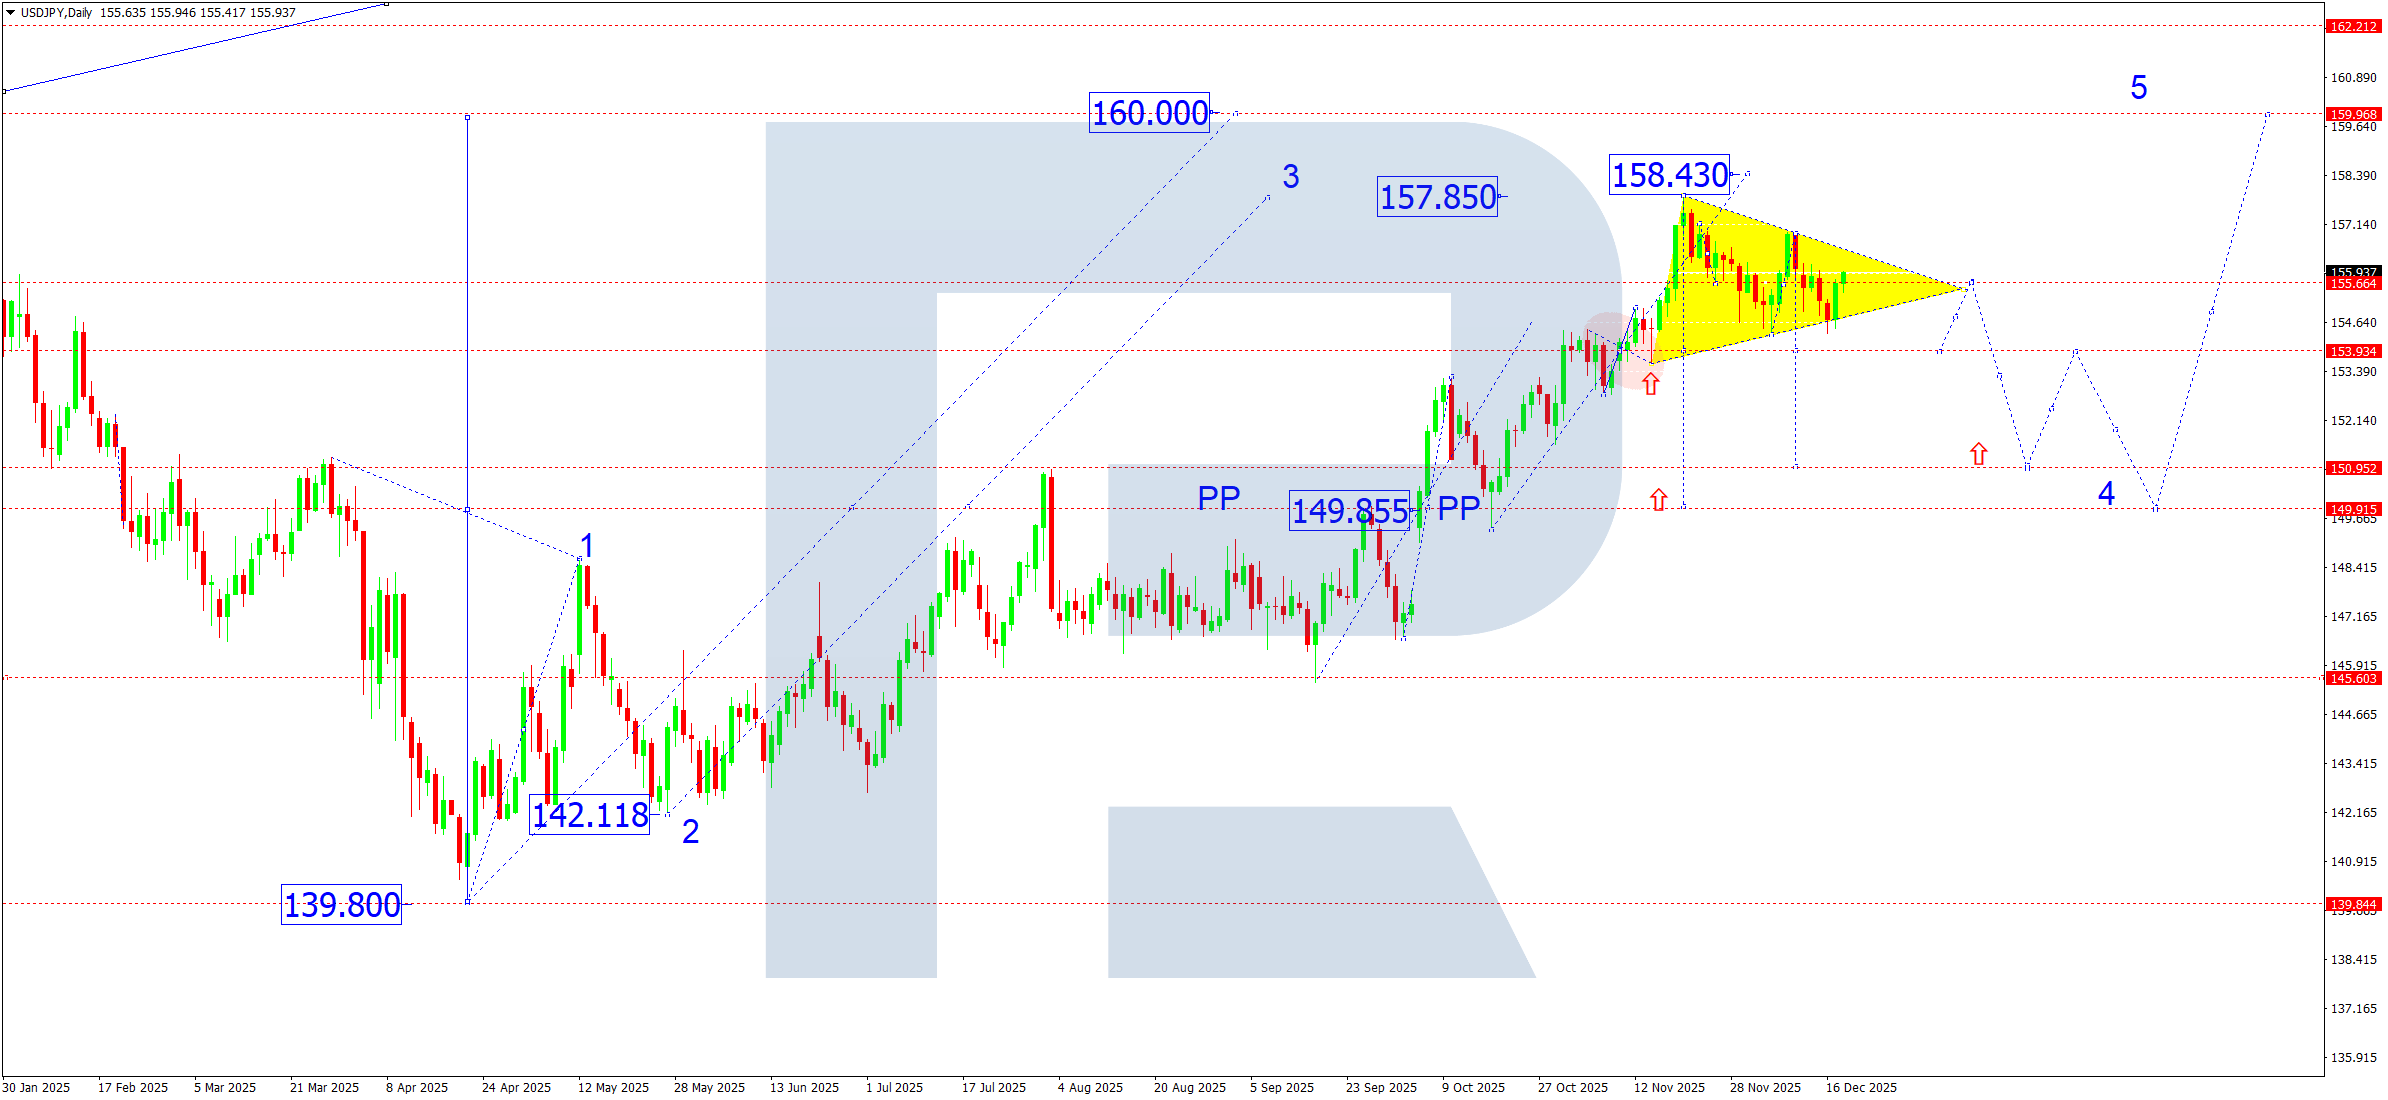
On the daily chart, the market reached the calculated local target of the growth wave at 157.85. At the moment, the market made a downward impulse and now forms a consolidation range around 155.55. Over the coming week, we anticipate the development of another downward impulse to 154.00. After that, we anticipate a return towards 155.55. In practice, the market will mark out the boundaries of a new consolidation range around this level. In the event of an upside breakout, the market will open potential to continue the growth wave towards 158.40, with the trend potentially extending to 160.00 at minimum. If the market breaks downwards out of the range, we will consider the probability of a more meaningful correction developing towards 149.90. After that, the market may rise as a fifth wave in the upwards trend towards 160.00.
USDJPY forecast scenarios
Bearish scenario (main): continuation of the downward wave towards 154.00 and a rise towards 156.40. In the event of a sharp decline and a break below 154.00, the market will open potential to extend the correction towards 149.90.
Bullish scenario (alternative): a confident break above 157.00 will open potential to continue the growth wave towards 158.40.
GBPUSD forecast
The fundamental backdrop remains moderately negative for the pound. The market still prices in the risk of a UK economic slowdown amid weak consumer demand dynamics and ongoing uncertainty in Bank of England monetary policy. Meanwhile, the US dollar continues to receive support as a safe-haven asset, which limits GBPUSD upside potential and increases pressure during recovery attempts.
At the moment, the fundamentals do not contradict a continuation of the decline, and the market treats any upside impulses mostly as corrective.
GBUSD technical analysis
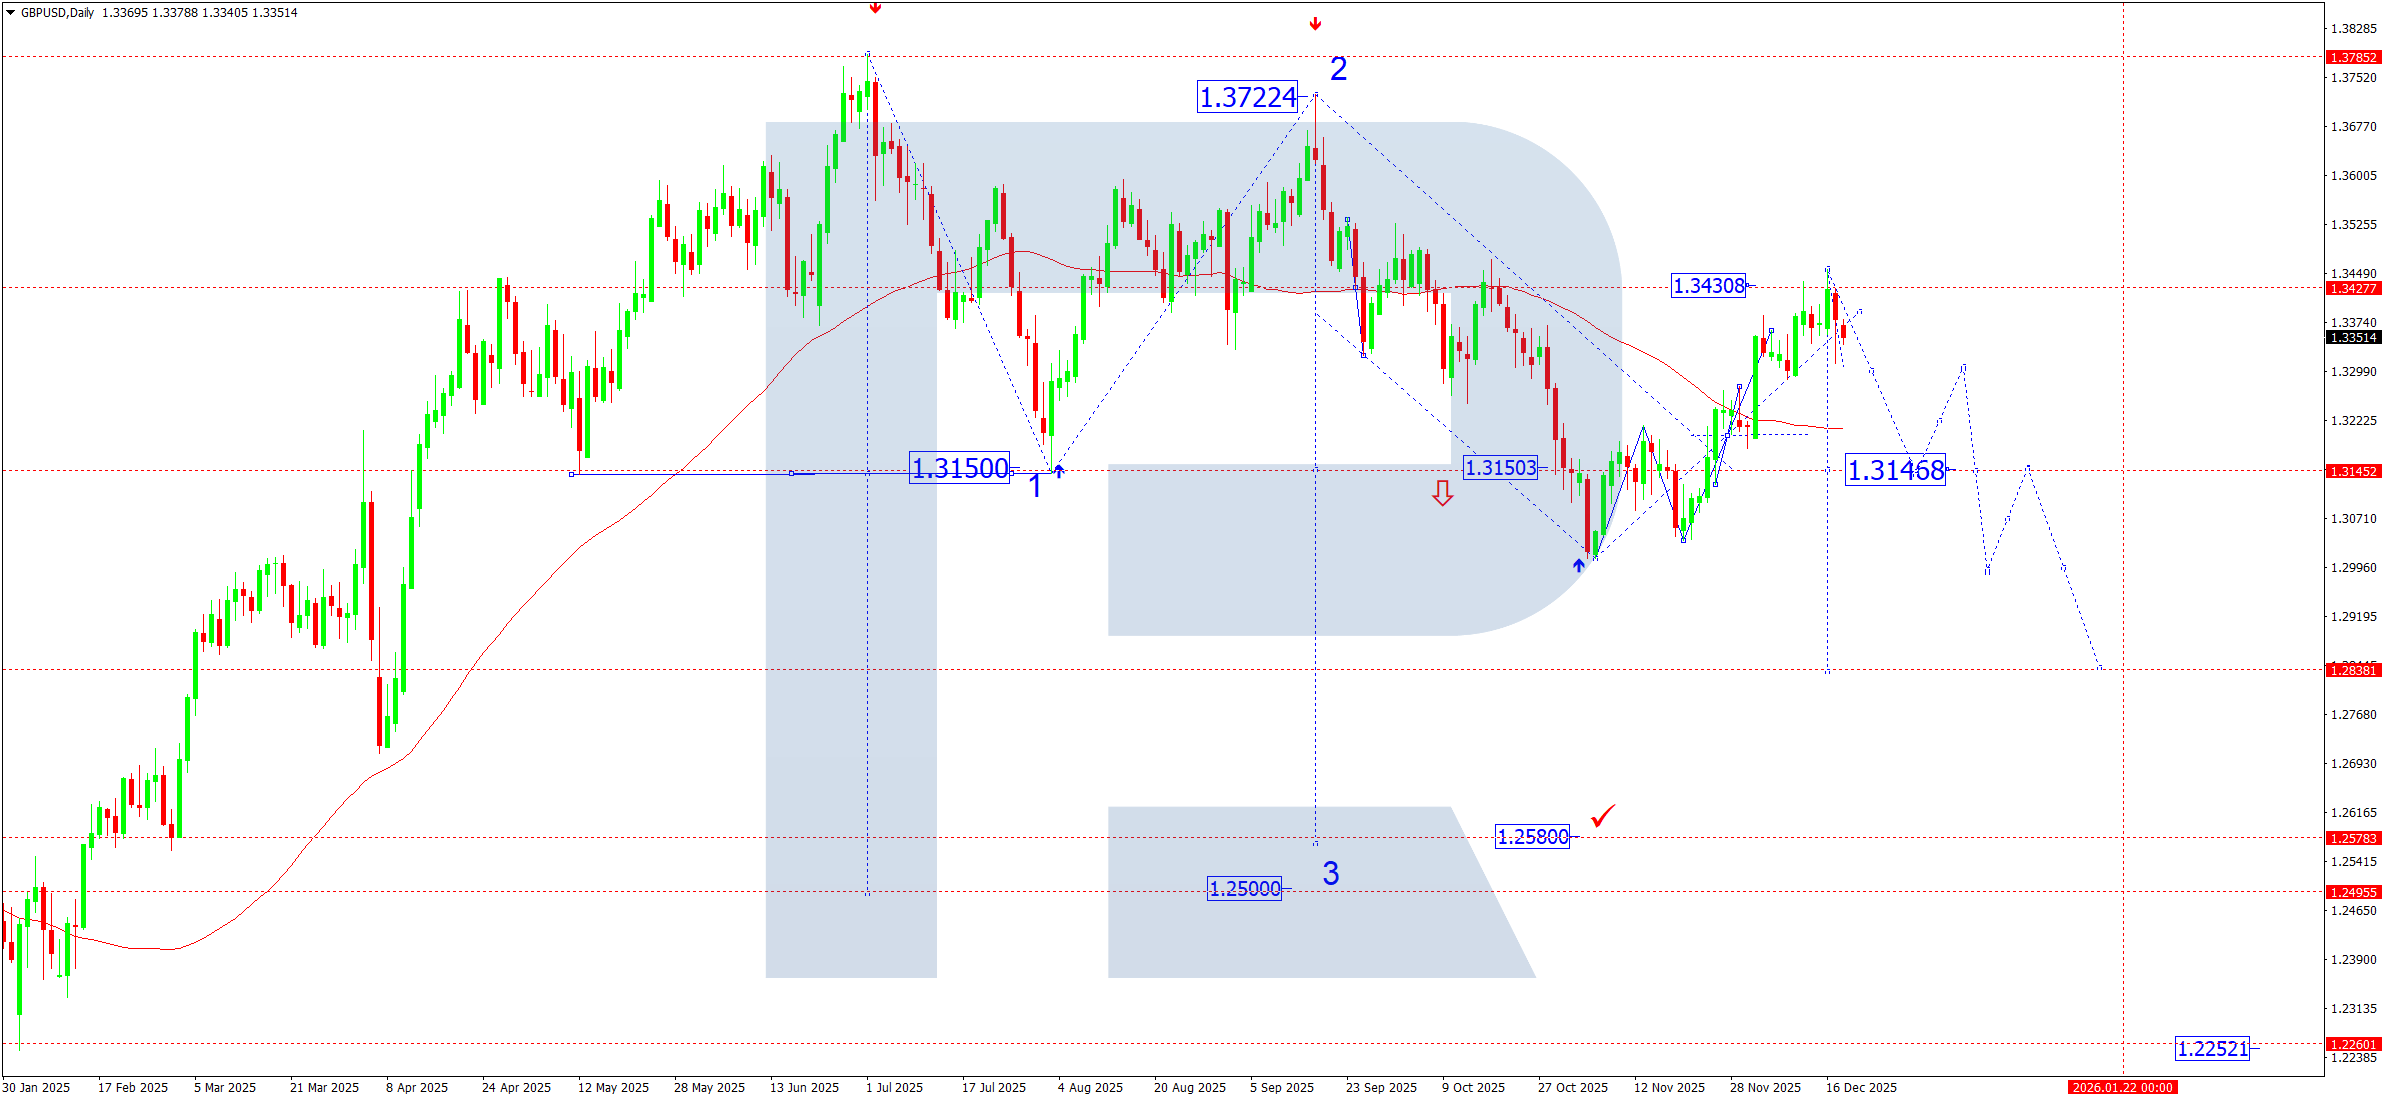
On the daily chart, GBPUSD formed a consolidation range below the key resistance at 1.3455. Last week, the market reached the calculated local correction target near this level, after which the growth impulse began to fade.
Within the current structure, we expect the start of a downward leg with the first target in the 1.3145–1.3150 area. This level is important because it:
#.matches local support,
#.runs close to the SMA50,
#.may act as a Pivot Point (PP) formation zone for the entire downward wave.
After the 1.3145 test, we allow for a corrective pullback towards 1.3266–1.3300, where the market will assess sellers’ resilience. We view the end of this correction as a potential entry point into a new downward wave.
The main medium-term target of the down move remains in the 1.2838 area, with the structure expanding and the trend potentially developing towards 1.2580 — the local target zone of the entire downward wave.
GBPUSD forecast scenarios
Bearish (main): formation of a downwards structure with the primary target at 1.3145, then a corrective pullback and a continuation of the decline towards 1.2838–1.2580.
Bullish (alternative): holding 1.3145 and developing a corrective rise with the target at 1.3300. This scenario is considered exclusively as corrective within a broader downwards structure.
AUDUSD forecast
The fundamental picture for AUDUSD continues to form amid rising uncertainty. The Australian dollar remains sensitive to several factors at once, each of which plays against growth in the medium term.
First, the Fed’s monetary policy remains tight. Despite some signs of inflation easing, the market still has not received a clear signal that a sustained rate-cutting cycle has begun. This supports the US dollar and limits the potential for corrective gains in risk currencies, including AUD.
Second, the Reserve Bank of Australia keeps a wait-and-see stance. Economic activity is slowing, domestic demand shows signs of cooling, and inflation is easing unevenly. In these conditions, the RBA is not rushing to tighten policy, which reduces the Australian dollar’s appeal compared with the US dollar.
The situation in China’s economy remains a separate negative factor. Weak performance in real estate and industry continues to pressure commodity currencies. Any signs of stabilisation in China remain local and do not form a sustained positive trend for AUD.
Overall, the fundamental backdrop indicates that the current rise in AUDUSD is corrective, while medium-term risks still tilt towards the downside.
AUDUSD technical analysis
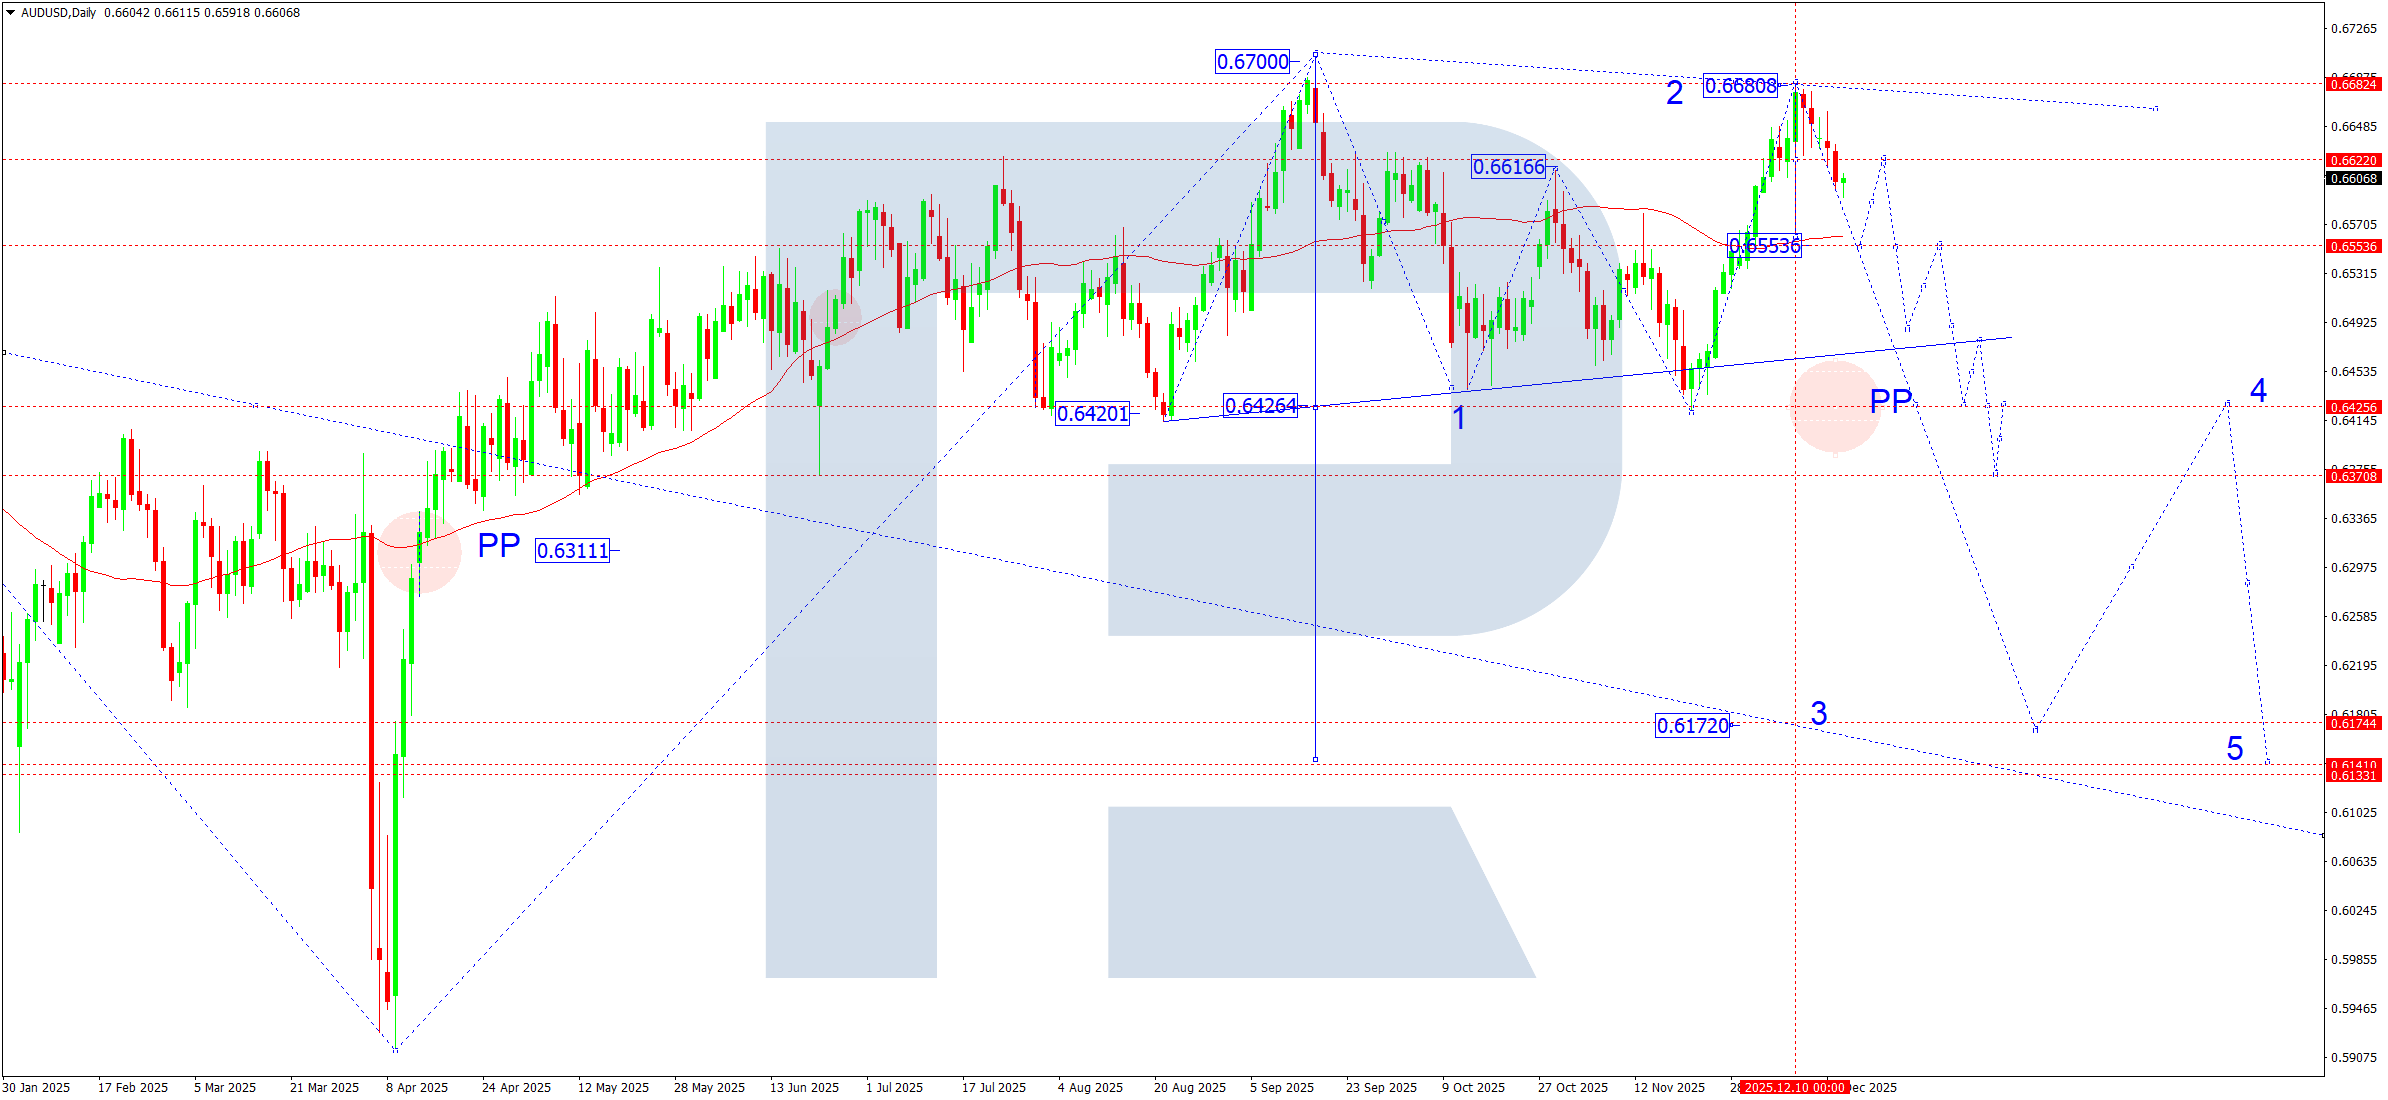
On the daily chart, AUDUSD formed a consolidation range around 0.6555, from which the market broke upwards and delivered a corrective move to the 0.6680 area. This rise is viewed исключительно as a correction within a larger downwards structure.
At the moment, price sits in the zone where the corrective impulse may complete. This week, we anticipate a downward leg developing towards 0.6555, with a likely test of this level from above. After that move plays out, the market may deliver a short-term correction towards 0.6622. At that level, upside potential will be exhausted.
The market’s technical structure points to the formation of a classic triangle — a reversal pattern formed near the top of the growth wave. A breakout from this triangle will most likely point downwards, which supports the scenario of the main downtrend resuming.
The local target of the next downward wave sits at 0.6172, which acts as a medium-term reference point.
AUDUSD forecast scenarios
Bearish (main): we anticipate a decline towards 0.6555 with a subsequent continuation of the move towards 0.6425. A break and consolidation below 0.6484 will increase pressure and confirm the development of a new downward wave.
Bullish (alternative): a break above 0.6680 may extend the corrective move towards 0.6750. However, this scenario is considered less likely. It fits within a correction rather than a trend reversal.
USDCAD forecast
The fundamental picture for USDCAD remains mixed, but in the medium term it continues to support the US dollar.
On the US side, the market still factors in the Fed’s hawkish rhetoric about keeping interest rates elevated for longer than expected. Inflation pressure is slowing, but it remains above target levels, which reduces the likelihood of aggressive easing in the coming months. This forms steady demand for the dollar.
The Canadian dollar, in turn, faces pressure from slowing domestic growth and high dependence on the commodity sector. The oil market remains volatile and does not show a sustained trend, which limits CAD strengthening potential. Expectations of a softer Bank of Canada stance amid cooling activity add an additional uncertainty factor.
Overall, the fundamental backdrop continues to form a corrective-upwards model in USDCAD, where declines act as part of a larger growth structure.
USDCAD technical analysis
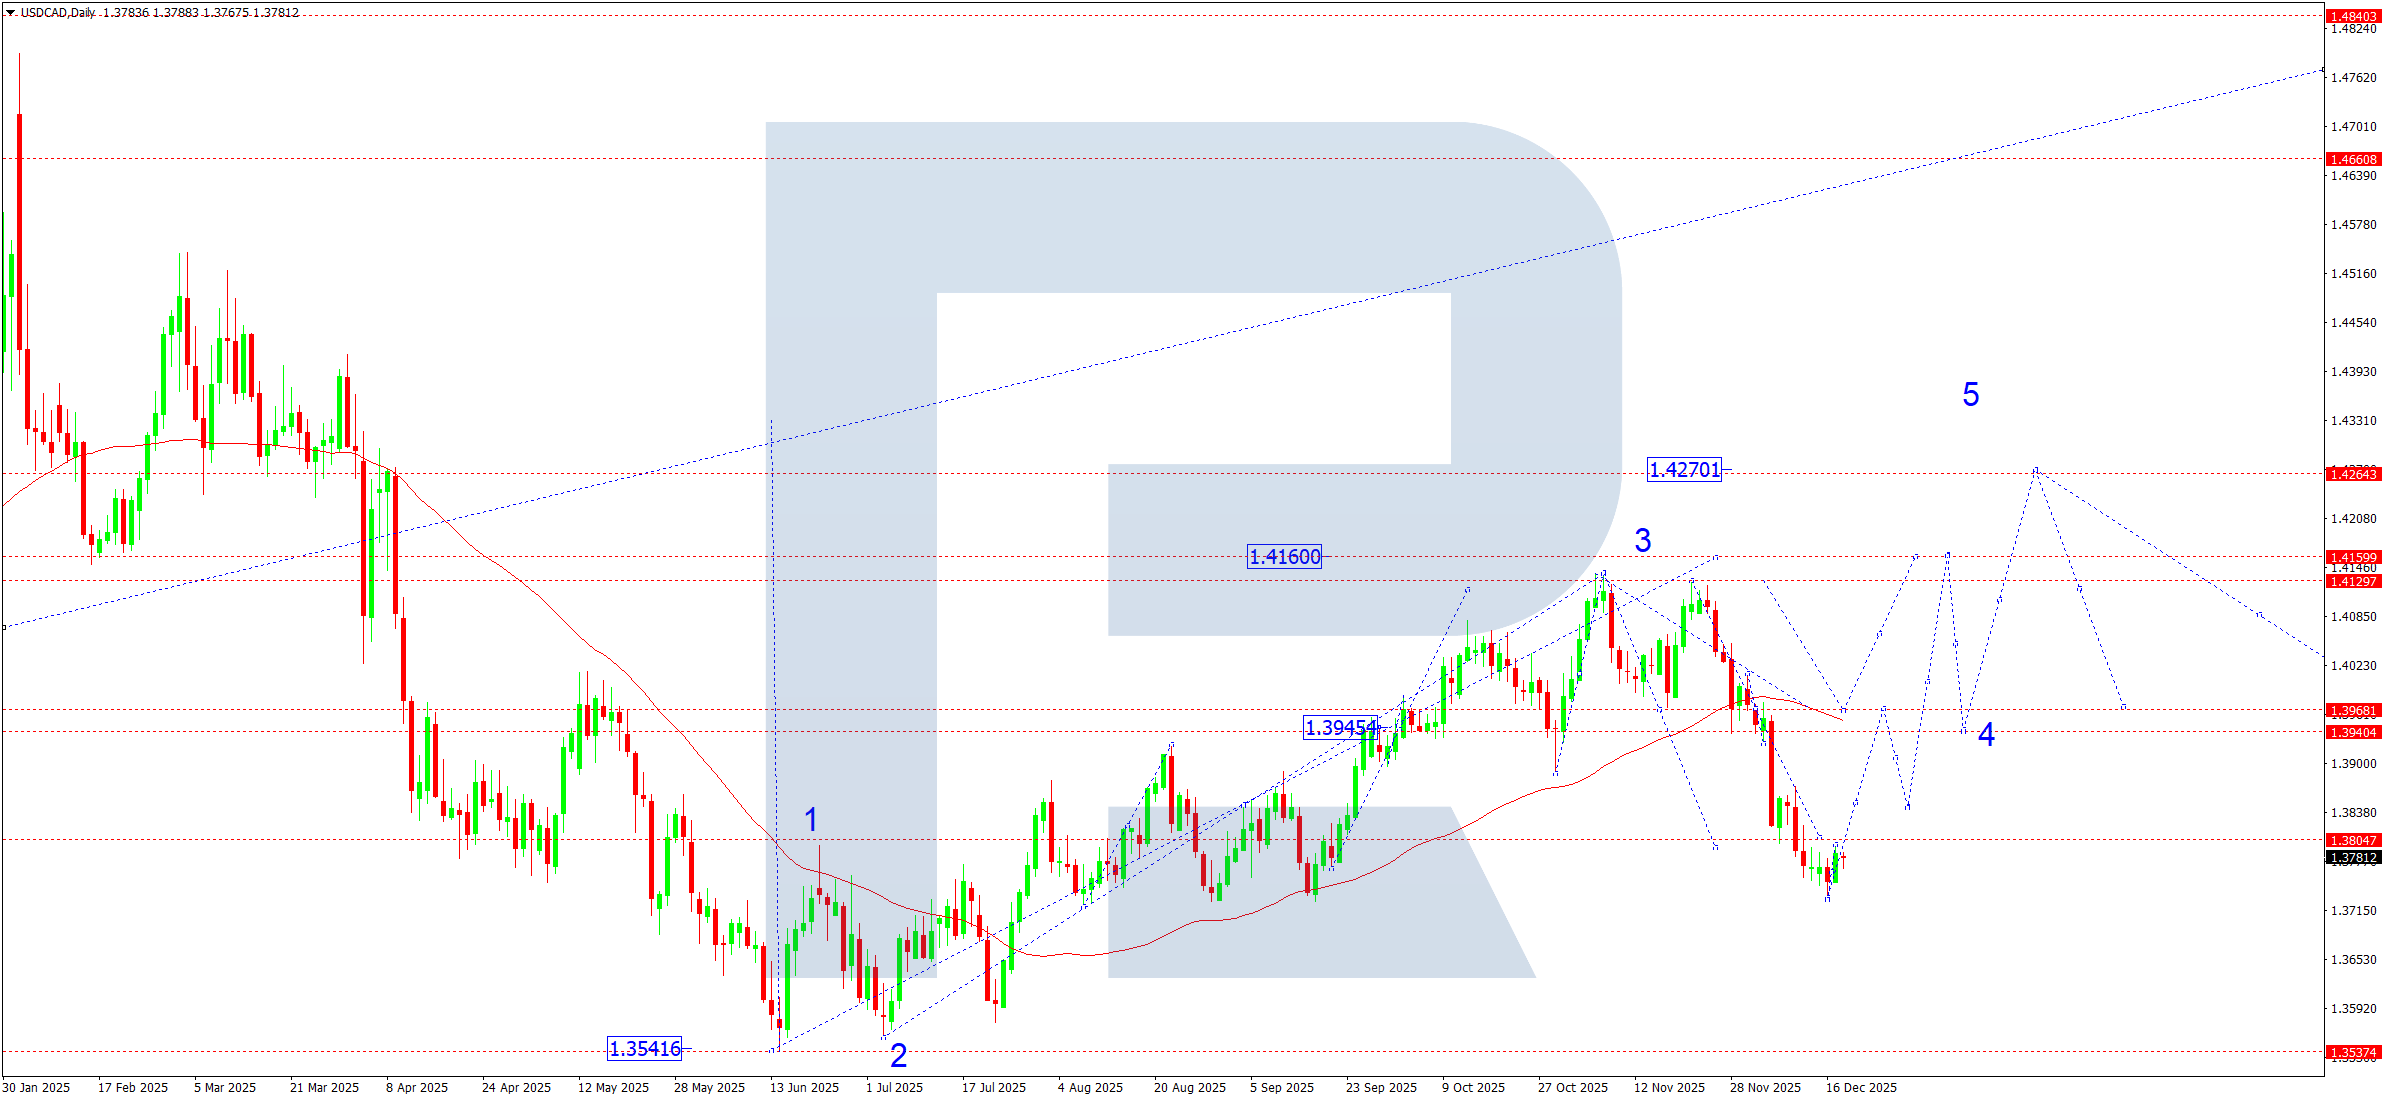
On the daily chart, USDCAD broke below the SMA50 support level (1.3970), after which the market formed a consolidation range around this level. With a break lower, the market worked through a corrective wave towards 1.3733, where sellers began to lose initiative.
At present, price trades near the 1.3805 area, building a base for a potential upwards reversal. Structurally, the current decline fits into a corrective phase within the development of the fourth growth wave.
Over the coming week, if support holds, we anticipate an attempt to form an upwards impulse with the primary target of returning to 1.3970. A break and consolidation above this level will open potential to continue rising towards 1.4160, which acts as the local target of the current wave structure.
USDCAD forecast scenarios
Bullish scenario (main): the market is forming a consolidation range around 1.3805. With an upside breakout, the market will move towards 1.3970. Consolidation above this level will confirm the impulse resumption and create conditions for a move towards 1.4160 within the fifth growth wave.
Bearish scenario (alternative): the market continues to trade in a sideways range with the risk of another corrective leg developing. In this case, a decline towards 1.3700–1.3670 is possible, without breaking the overall upwards structure, provided demand holds in this zone.
XAUUSD forecast
The fundamental picture for gold over the coming week remains constructively bullish, despite a local consolidation phase after a strong growth impulse.
Monetary policy remains the key factor. The market has already priced in expectations of an easing cycle starting in 2026, yet even the current pause in rate hikes, alongside persistent inflation risks, supports interest in safe-haven assets. Real interest rates remain vulnerable to declines, which traditionally acts as a positive factor for gold.
Additional support comes from:
#.Rising fiscal risks in the US and EU, including higher debt burdens and budget deficits
#.Geopolitical uncertainty, which increases demand for gold as a hedging instrument
#.Lower confidence in developed-economy debt obligations amid discussions about freezing and confiscating sovereign assets, which undermines trust in reserve currencies in the long run and stimulates central-bank demand for physical gold.
It is also important to note that the coming week is pre-holiday, with potentially reduced liquidity. This increases the probability of range formation and false breakouts, which fully aligns with the current technical picture.
Overall, the fundamental backdrop supports the scenario of the upwards trend continuing after the consolidation phase, with no signs of a medium-term reversal.
XAUUSD technical analysis
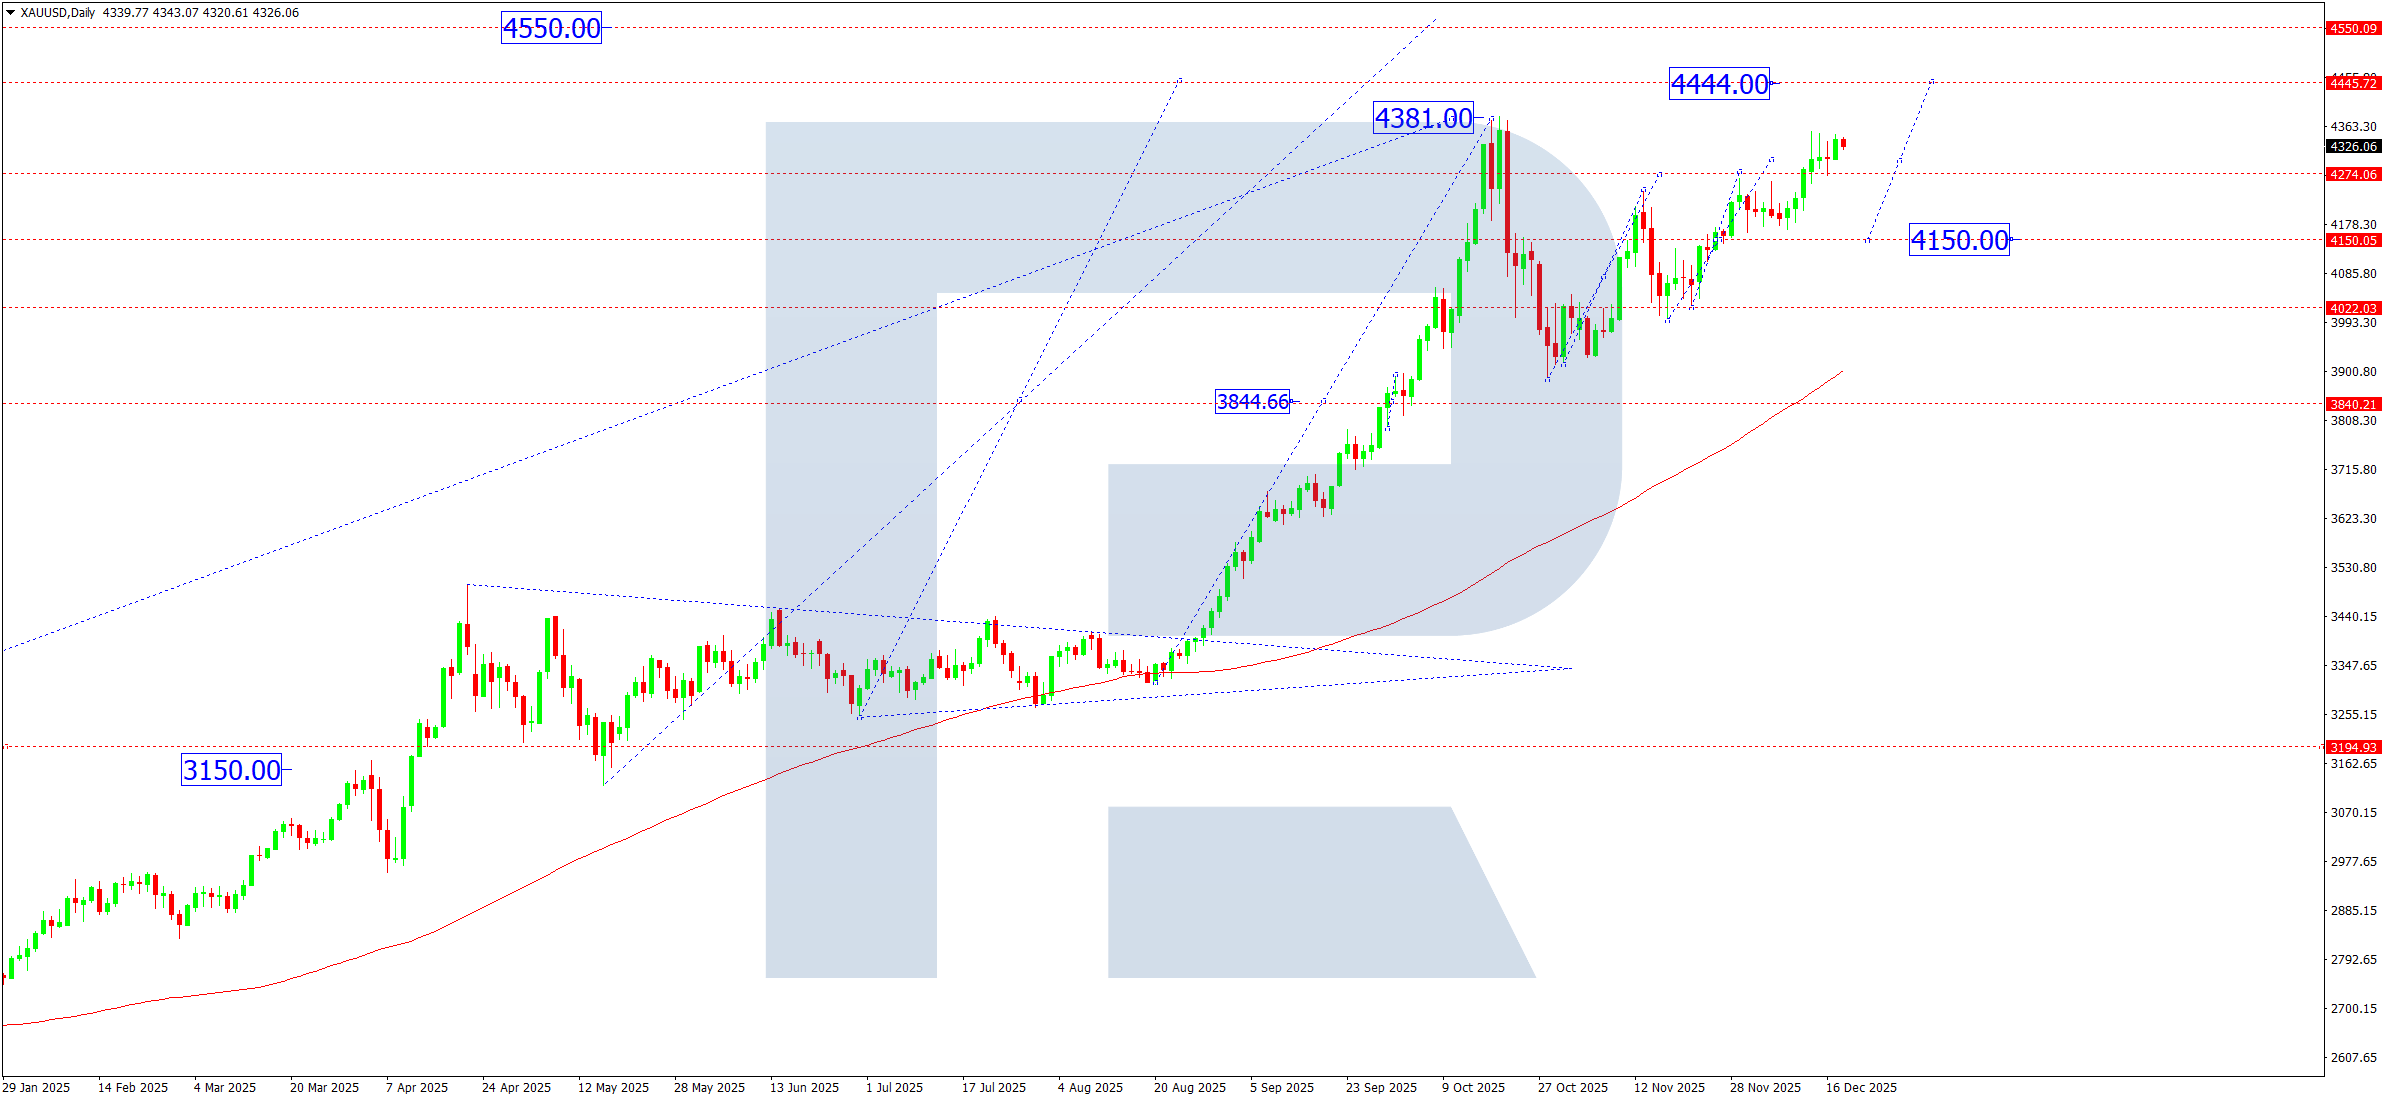
On the daily XAUUSD chart, the market completed the calculated growth wave and reached the key level at 4,300, where it is currently forming a consolidation range.
This structure acts as a pause within an upwards impulse rather than a reversal model. The market holds above an important support zone, which keeps buyers in control.
#.An upside breakout will open potential to continue the growth wave with the target area at 4,444
#.A downside breakout will be treated as a corrective leg with targets in the 4,150–4,080 area, without breaking the global bullish scenario
The current formation suggests that the market is accumulating positions ahead of the next directional move.
XAUUSD forecast scenarios
Bullish(main): holding support at 4,275 and breaking the 4,355–4,377 zone will confirm the market’s readiness to continue the growth wave. In this case, the market will open potential to move towards the target level at 4,444.
Bearish (alternative): a confident consolidation below 4,275 will lead to a corrective move developing, with the nearest targets at 4,150 and 4,080. This scenario will be viewed as a correction within an upwards trend.
Brent forecast
The oil market enters the final trading week of the year with heightened sensitivity to geopolitical and supply-side structural factors.
High geopolitical risks remain the main supportive factor. Tension in Europe and the Middle East persists, while the situation around Venezuela acts as an additional source of uncertainty. Any tightening of sanctions, export disruptions, or conflict escalation could sharply reduce effective supply in the market.
From OPEC+, the market still assumes a scenario of tight production control. Declarations of readiness to support the balance of supply and demand shape expectations of limited deliveries in early 2026, which strengthens medium-term bullish expectations.
Demand factors remain mixed in the short term: on the one hand, seasonal activity slowdown towards year-end; on the other, expectations of industrial demand recovery in Q1 2026. Together, this creates a backdrop for volatile, but mainly upwards moves after the corrective phase ends.
Brent technical analysis
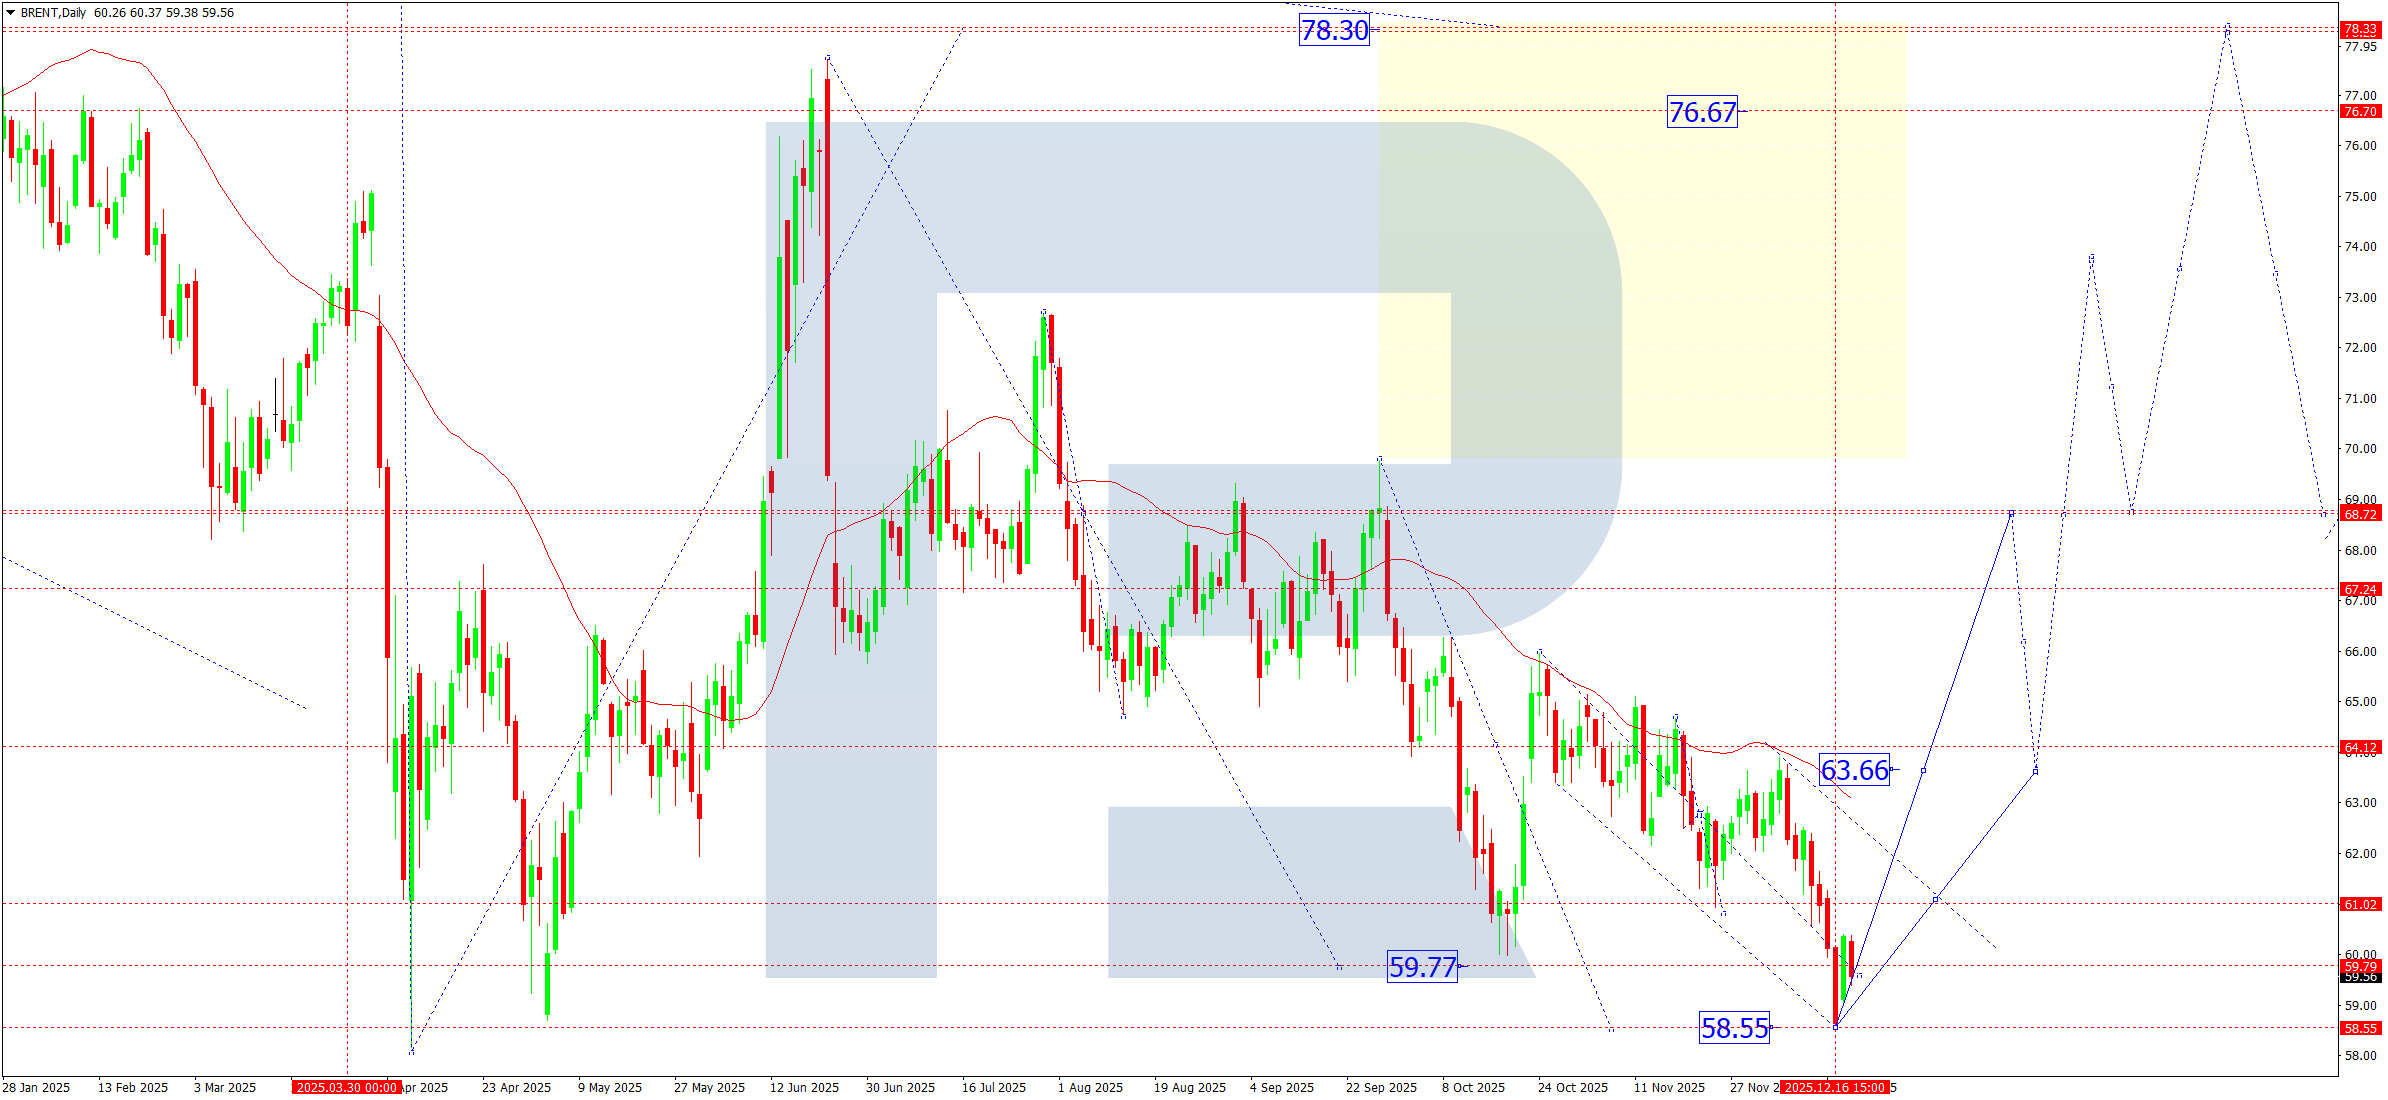
On the daily chart, Brent crude completed the formation of a downward wave structure by reaching 58.55, which now acts as a key support zone.
At the moment, the market shows signs of stabilisation, which supports a baseline scenario of a growth wave starting towards 63.66 over the coming week. This level acts as the first meaningful resistance zone and the boundary of the local range.
After testing 63.66, the market may form a corrective leg with a return towards the 61.00 area, where we anticipate a base forming for continued growth. If the reversal gains confirmation, the market structure will open potential for an impulsive wave towards 68.70, which will correspond to the completion of the next upwards segment.
In the broader context, current moves are viewed as the initial phase of a new growth wave, within which the first calculated target sits in the 78.30 area.
Brent forecast scenarios
Bullish scenario (main): given high geopolitical uncertainty (Europe, the Middle East, Venezuela), as well as stronger sanctions pressure on Russia’s oil sector, the market can receive a sharp growth driver at any moment.
In this case, we will consider an impulse towards:
#.first target - 68.70
#.second target - 72.60
#.main target of the first growth wave - 78.30
Bearish scenario (alternative): a break and consolidation below 59.00 will increase pressure on the market and may lead to a decline into the 58.00 area, with a temporary cancellation of the bullish scenario.
Editors’ picks
 EURUSD 2026-2027 forecast: key market trends and future predictions
This article provides the EURUSD forecast for 2026 and 2027 and highlights the main factors determining the direction of the pair’s movements. We will apply technical analysis, take into account the opinions of leading experts, large banks, and financial institutions, and study AI-based forecasts. This comprehensive insight into EURUSD predictions should help investors and traders make informed decisions.
 Gold (XAUUSD) forecast 2026 and beyond: expert insights, price predictions, and analysis
Dive deep into the Gold (XAUUSD) price outlook for 2026 and beyond, combining technical analysis, expert forecasts, and key macroeconomic factors. It explains the drivers behind gold’s recent surge, explores potential scenarios including a move toward 4,500 to 5,000 USD per ounce, and highlights why the metal remains a strong hedge during global uncertainty.
Forecasts presented in this section only reflect the author’s private opinion and should not be considered as guidance for trading. RoboForex bears no responsibility for trading results based on trading recommendations described in these analytical reviews.