Weekly technical analysis and forecast (12–16 January 2026)
This weekly technical analysis highlights the key chart patterns and levels for EURUSD, USDJPY, GBPUSD, AUDUSD, USDCAD, gold (XAUUSD), and Brent crude oil to forecast market moves for the upcoming week (12–16 January 2026).
Major technical levels to watch this week
- EURUSD: Support: 1.1600, 1.1490. Resistance: 1.1660, 1.1750
- USDJPY: Support: 156.60, 154.50. Resistance: 158.50, 158.88
- GBPUSD: Support: 1.3280, 1.3131. Resistance: 1.3450, 1.3600
- AUDUSD: Support: 0.6660, 0.6600. Resistance: 0.6700, 0.6770
- USDCAD: Support: 1.3850, 1.3800. Resistance: 1.3850, 1.4000
- Gold: Support: 4,400, 4,300. Resistance: 4,600, 4,650
- Brent: Support: 60.66, 59.50. Resistance: 62.80, 63.50
EURUSD forecast
At the start of January, the market continues to factor in the risks of a possible US government shutdown linked to budget disputes, which fuels uncertainty around short-term fiscal policy and the dollar’s dynamics. Such factors traditionally increase currency market volatility and may put pressure on the USD when the news flow escalates.
Escalating geopolitical tensions in the Caribbean add another uncertainty factor, which raises the overall level of global risk and supports defensive investor sentiment. In such periods, the market’s focus shifts towards liquidity flows and technical reference points.
From the macroeconomic expectations side, the market remains cautious in assessing the Fed’s next steps. With mixed inflation and labour market data, the regulator will likely maintain a wait-and-see stance, which reduces the dollar’s fundamental support in the short term.
Overall, the fundamental backdrop creates neutral-to-negative conditions for the USD, but at this stage, the key driver for the EURUSD pair remains the implementation of the formed technical downward structure.
EURUSD technical analysis
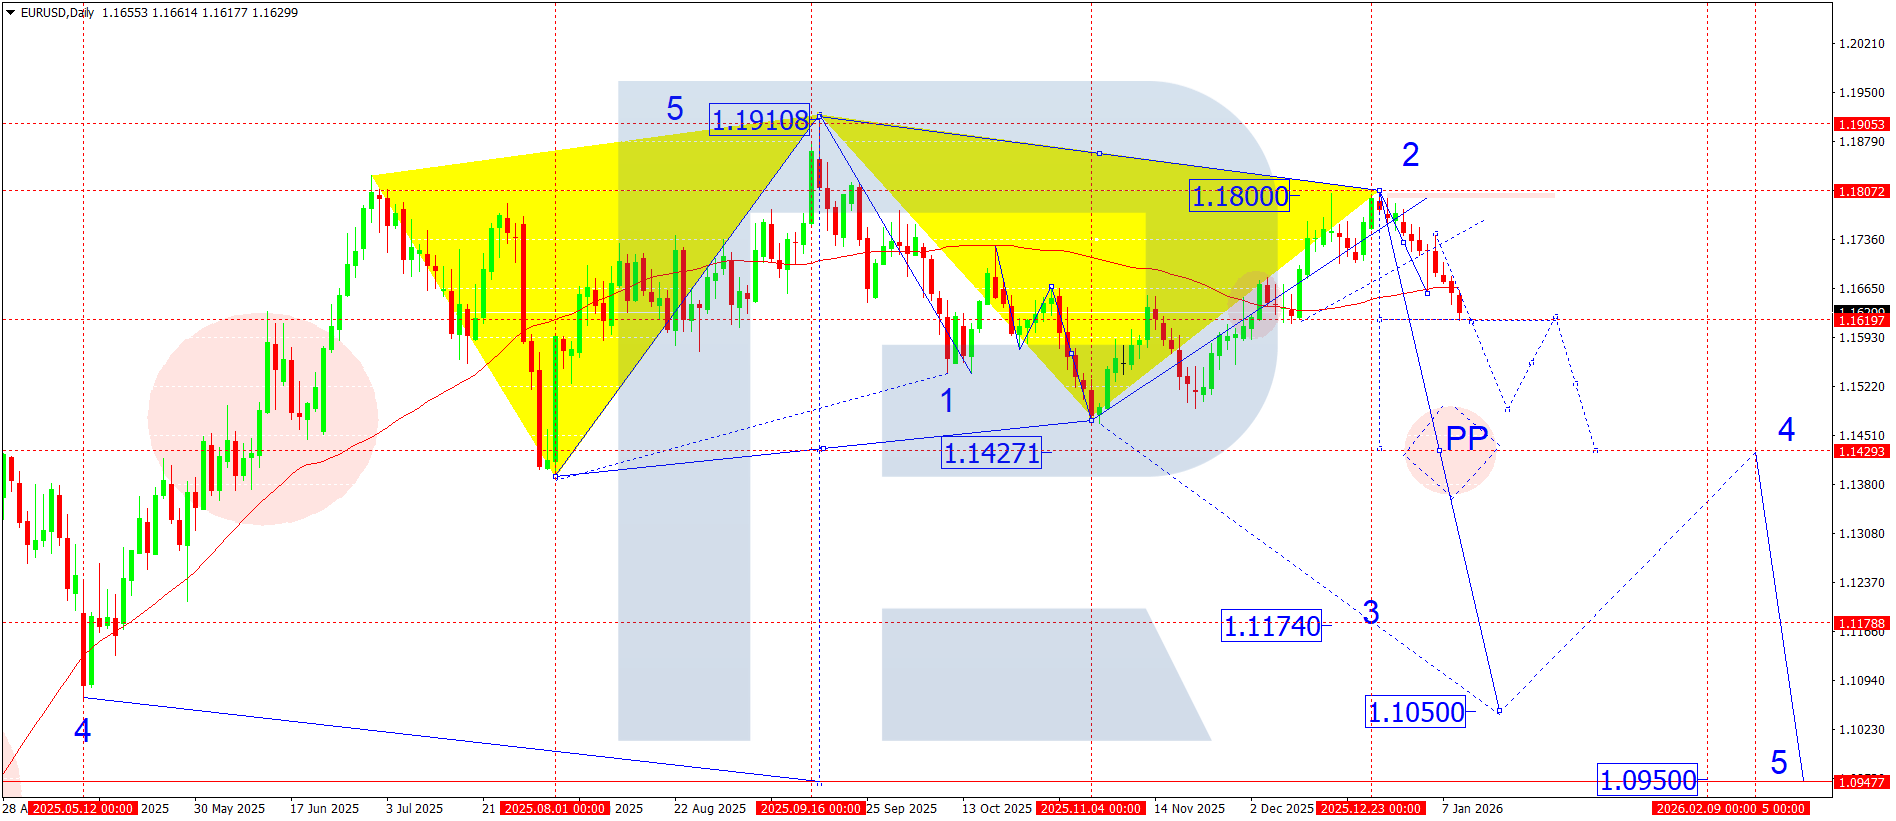
On the daily EURUSD chart at the start of the year, the market formed a downward impulse to 1.1660, followed by a corrective wave with a high near 1.1744. A consolidation range was practically formed around 1.1744.
Last week, the market:
- broke below the low of the downward impulse
- and broke the SMA 50 support level (1.1656) at the same time
This opened the potential for the next downward wave to develop towards 1.1430. It is worth noting that this level matches only half of the full downward wave structure, with a deeper local target near 1.1175.
This week, the baseline scenario is the development of the downward structure with the nearest target at 1.1490. After the market reaches it, a corrective move towards 1.1600 remains possible before the trend potentially continues lower.
EURUSD forecast scenarios
*Bearish (baseline) scenario:* the market holds below 1.1620 and continues to develop the downward wave with targets at:
- 1.1490
- 1.1430
*Bullish (alternative, unlikely) scenario:* if the market breaks above 1.1660 on rising volumes, a correction towards 1.1750 may develop
USDJPY forecast
The USDJPY pair continues to move amid a persistent divergence between the Fed and the Bank of Japan’s monetary paths. The US economy continues to show signs of slowing, but inflation pressure and the Fed’s hawkish rhetoric keep US Treasury yields elevated, which continues to support the dollar.
Japan’s monetary policy stance shows no major changes: the Bank of Japan keeps a loose approach, while any signals about policy normalisation remain cautious and do not exert a lasting influence on the yen.
Geopolitical tension and higher demand for the US dollar as a reserve currency add another factor, which limits the JPY’s strengthening potential even during phases of local correction.
USDJPY technical analysis
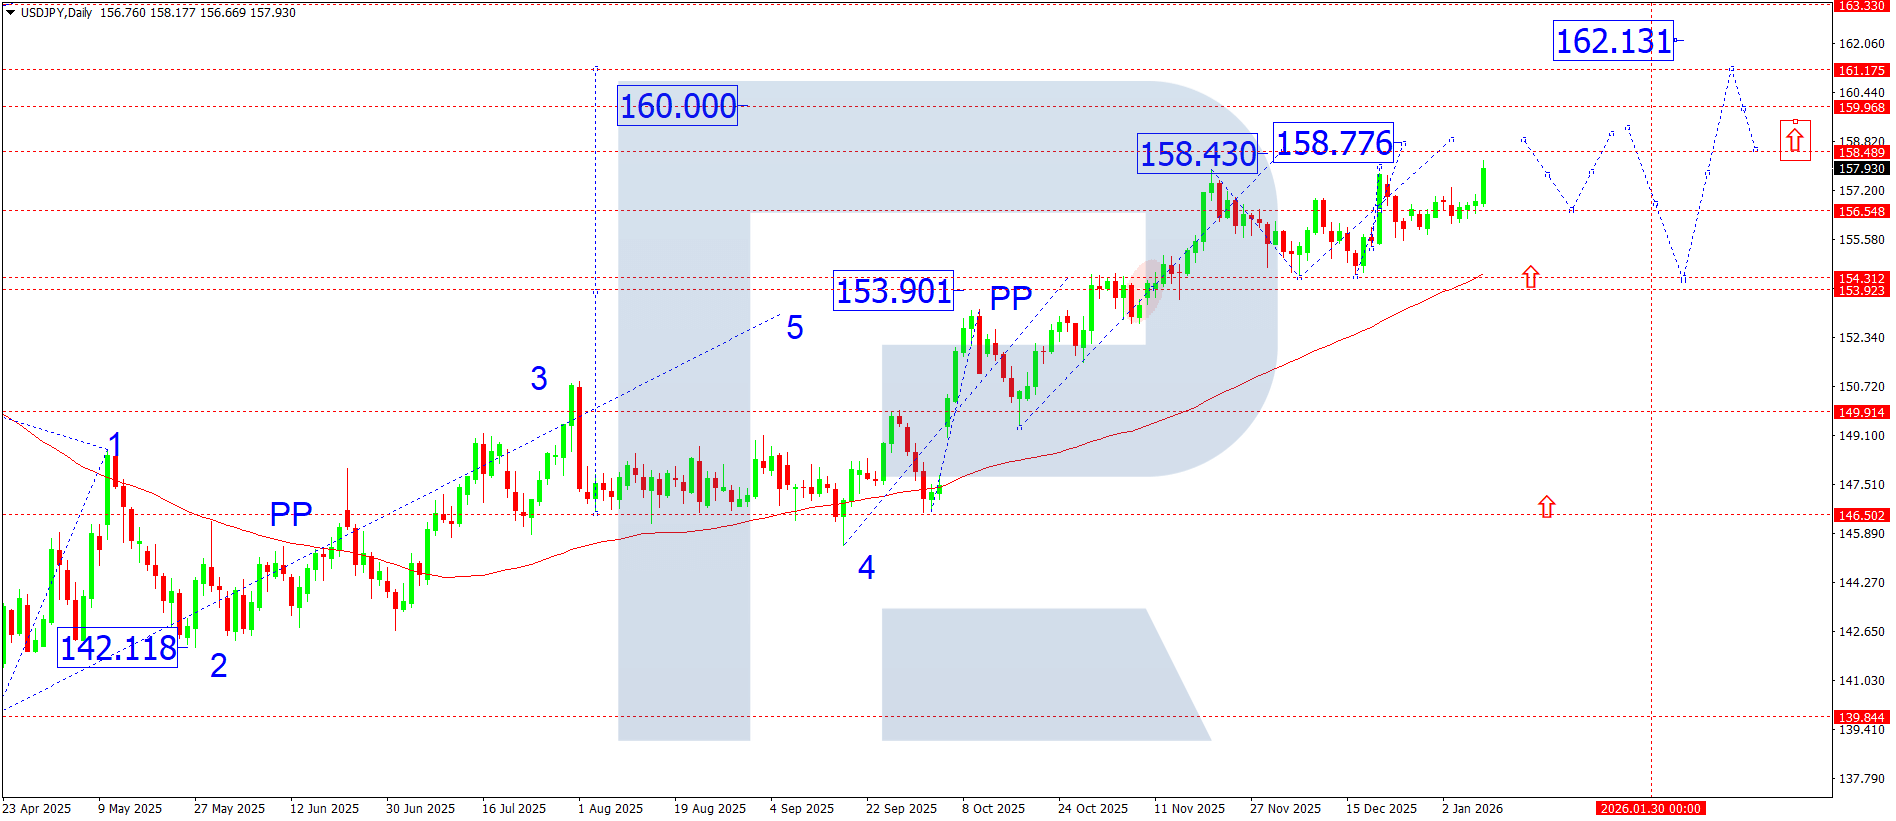
On the daily USDJPY chart, the market continues to extend the fifth growth wave. The structure remains bullish, with the price holding above key moving averages and the pivot point, which confirms buyers’ dominance.
Over the coming week, the baseline scenario remains a move towards 158.88, where the nearest local target of the current impulse lies. If the market breaks and consolidates above this level, it will open the potential for the fifth wave to extend into the 160.00 zone.
After the market reaches the 158.88–160.00 area, the probability of a corrective pullback towards 156.60 increases, which the market may use to build positions ahead of the next growth stage. In the medium term, the market retains potential to continue the uptrend towards 162.30.
USDJPY forecast scenarios
*Bearish (baseline) scenario:* if the market drops sharply and breaks below 156.60, it may shift into a deeper correction phase with the target at 154.50, while keeping the overall medium-term upward structure intact.
*Bullish (alternative) scenario:* firm holding above 156.60 and a subsequent breakout above 158.50–158.88 would open the potential for continued growth with targets at 160.00 and then 162.30.
GBPUSD forecast
The pound sterling remains under pressure amid the Fed’s hawkish rhetoric and expectations of a UK economic slowdown. The market is gradually pricing in the risk of a longer period of high rates in the US, which supports the dollar. Uncertainty around the pace of the UK recovery and expectations for the Bank of England’s next steps add to pressure. In the short term, the fundamental backdrop remains unfavourable for the GBP and supports the scenario of a continued downtrend.
GBUSD technical analysis
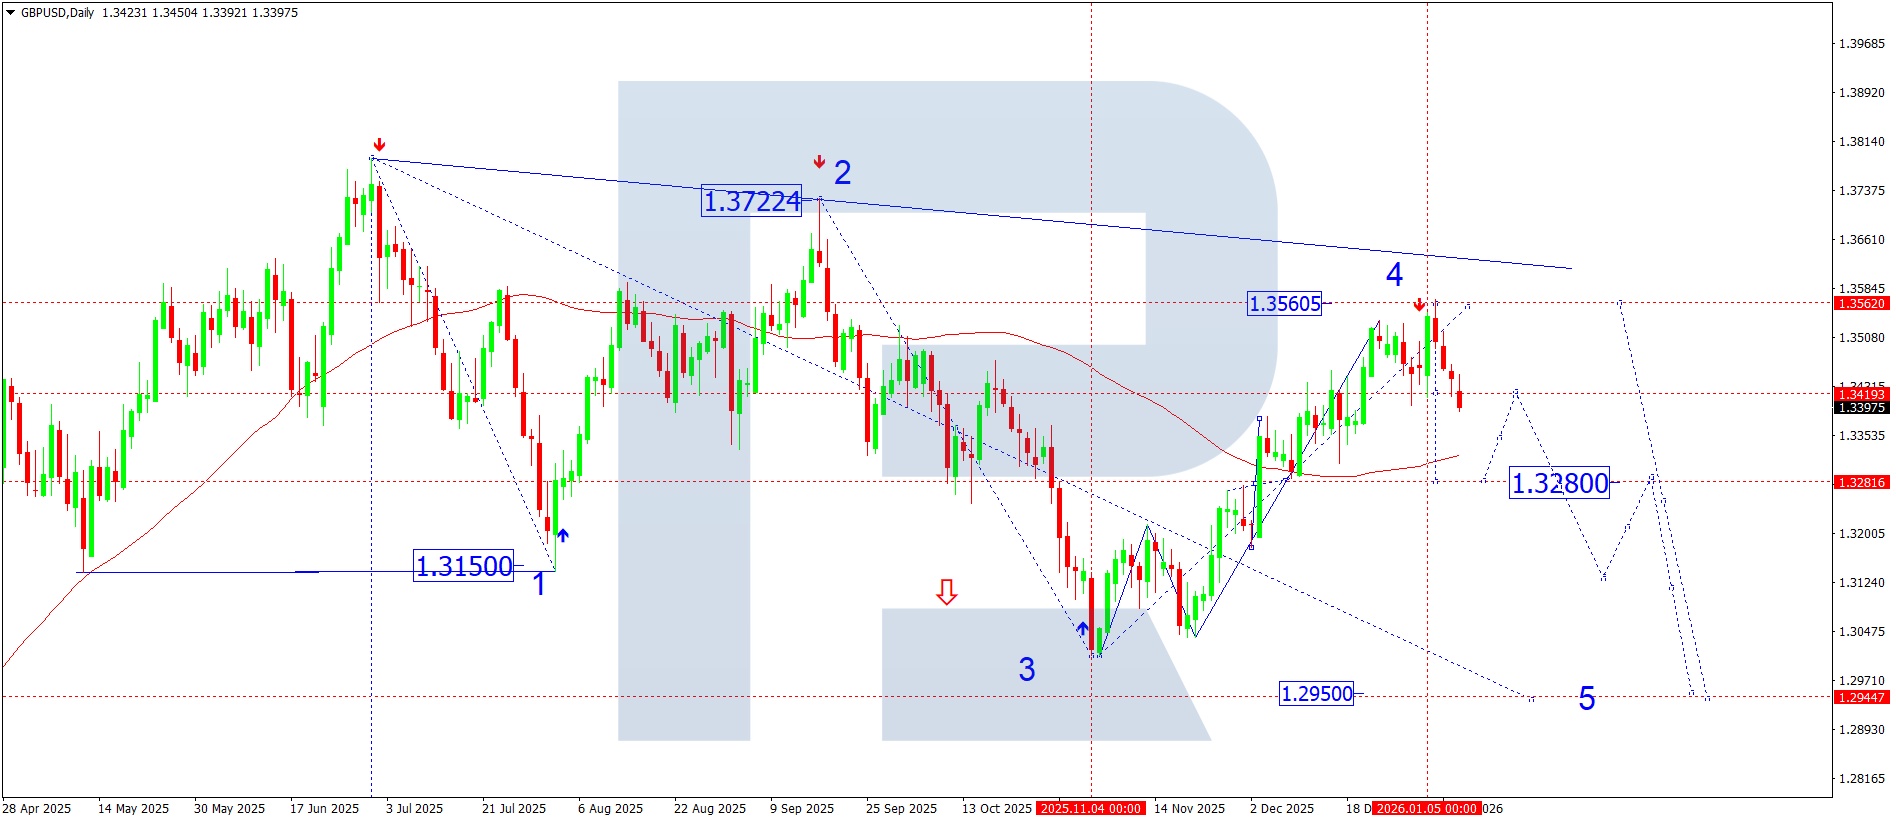
On the daily chart, the GBPUSD pair broke confidently below the key 1.3420 level last week, confirming the completion of the corrective growth structure and a shift towards a downward wave. The current dynamics indicate the formation of an impulsive decline wave within the fifth wave of the main downtrend.
The nearest downside target is 1.3280 – the first target in the structure. A breakout below this level would confirm a continued movement towards 1.2950, which acts as the main target of the fifth wave. Current pullbacks are corrective and have not broken the downward impulse structure so far.
GBPUSD forecast scenarios
*Bearish (baseline) scenario:* if pressure remains below the 1.3420–1.3450 zone, the downward structure is expected to develop further and reach 1.3280. Consolidation below this level would open the potential for a move to 1.3131 and then to 1.2950 as the fifth wave completes.
*Bullish (alternative) scenario:* if the market returns and consolidates firmly above 1.3450, it will cast doubt on the current downward structure. In this case, the market could begin to form an upward correction with targets in the 1.3600 zone, although this scenario remains only an alternative for now.
AUDUSD forecast
Over the coming week, AUDUSD dynamics will be shaped by a combination of a strong US dollar and a restrained Australian backdrop.
From the US side, the market continues to factor in the Federal Reserve’s hawkish rhetoric and expectations that interest rates will stay high for longer. Strong labour market and inflation data support the dollar, increasing pressure on commodity bloc currencies, including the AUD. Rising US Treasury yields add another factor, as they reduce the appeal of high-risk assets.
The Australian dollar remains vulnerable amid the RBA’s neutral stance. The regulator continues to signal a pause in the tightening cycle, limiting the AUD’s potential amid a strong USD. Slowing economic activity in China, Australia’s key trading partner, also adds to pressure, especially in commodities and industrial production.
A broader deterioration in risk appetite and persistent geopolitical uncertainty continue to tilt the balance towards safe-haven assets, increasing the probability that the AUDUSD pair will maintain its downward trajectory.
AUDUSD technical analysis
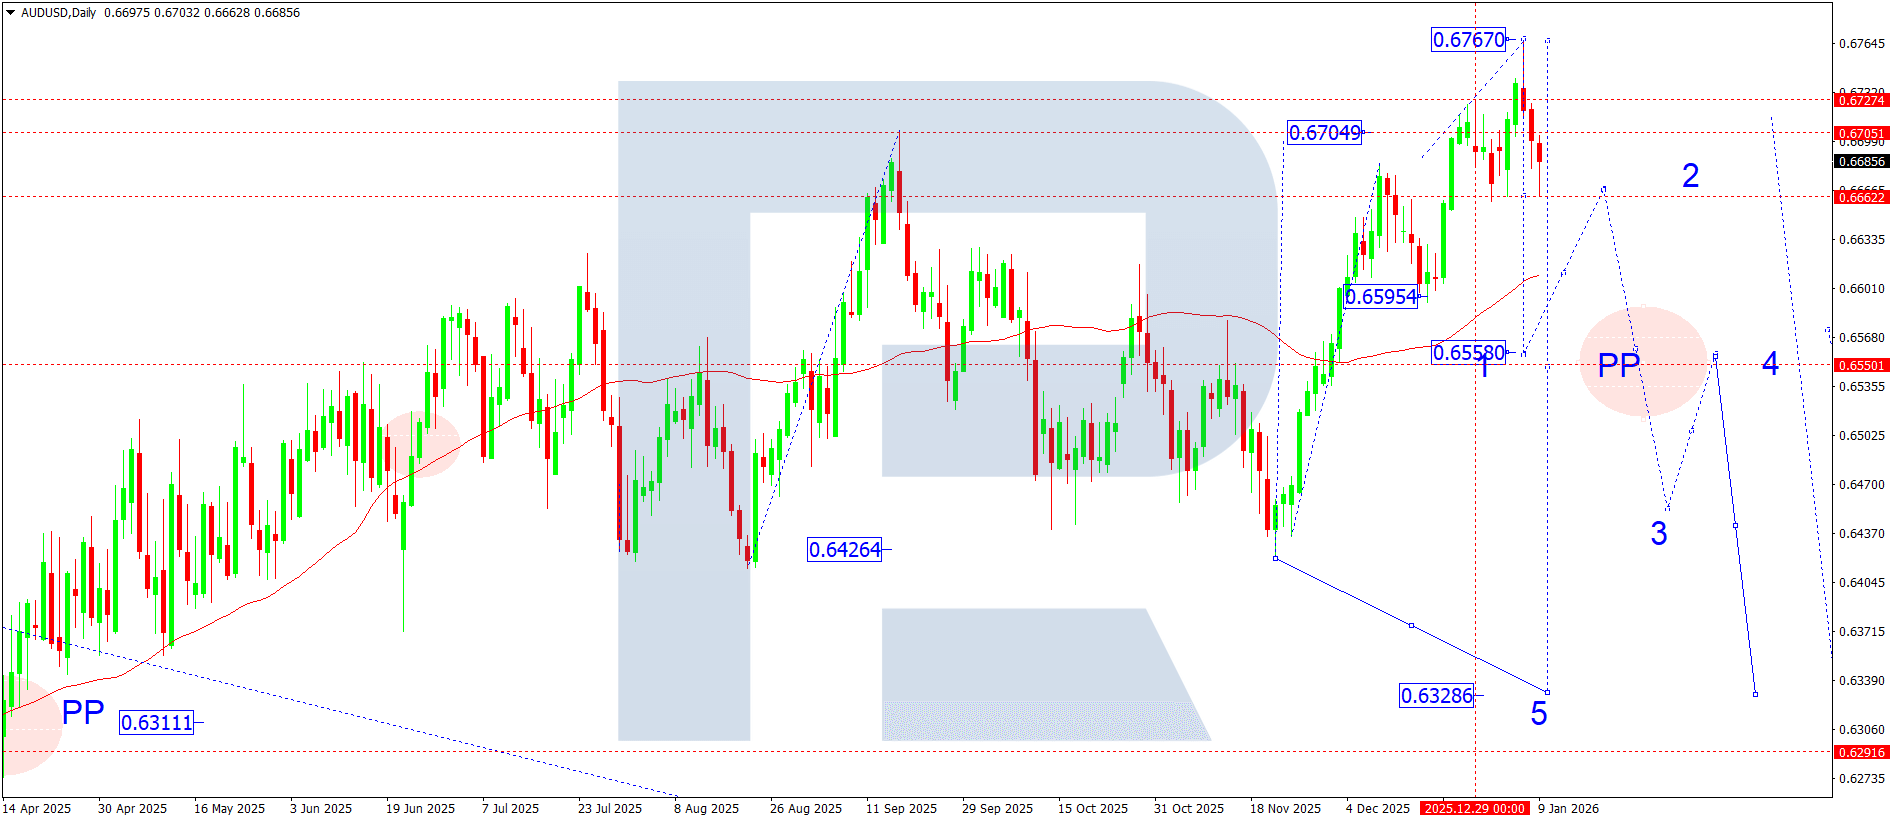
On the daily AUDUSD chart, the market completed a downward impulse, reaching the lower boundary of the consolidation range. The current structure indicates a continuation of the downtrend.
This week, the pair is expected to break below 0.6660, with the decline developing towards 0.6560 – the first target in the trend. Consolidation below this level will open the potential for the impulse to extend further.
AUDUSD forecast scenarios
*Bearish (main) scenario:* the price is expected to decline to 0.6560, with the trend continuing towards 0.6424.
*Bullish (alternative) scenario:* a breakout and consolidation above 0.6700 would open the potential for corrective growth to 0.6770.
USDCAD forecast
The Canadian dollar remains under pressure on multiple fronts this week. The key factor is the oil market’s dynamics, with the lack of sustained momentum in Brent prices limiting the CAD’s potential and increasing USDCAD sensitivity to USD moves.
From the US side, the market continues to price in the Fed’s hawkish rhetoric amid persistent inflation expectations and strong labour market data. Any signals that interest rates will stay high for longer support the dollar and form the fundamental basis for the USDCAD pair to continue its upward trajectory.
Market participants also focus on US inflation and retail sales data, as well as comments from Bank of Canada officials, where the tone remains cautious regarding future monetary policy steps. Overall, the fundamental backdrop remains moderately bullish for the USDCAD pair.
USDCAD technical analysis
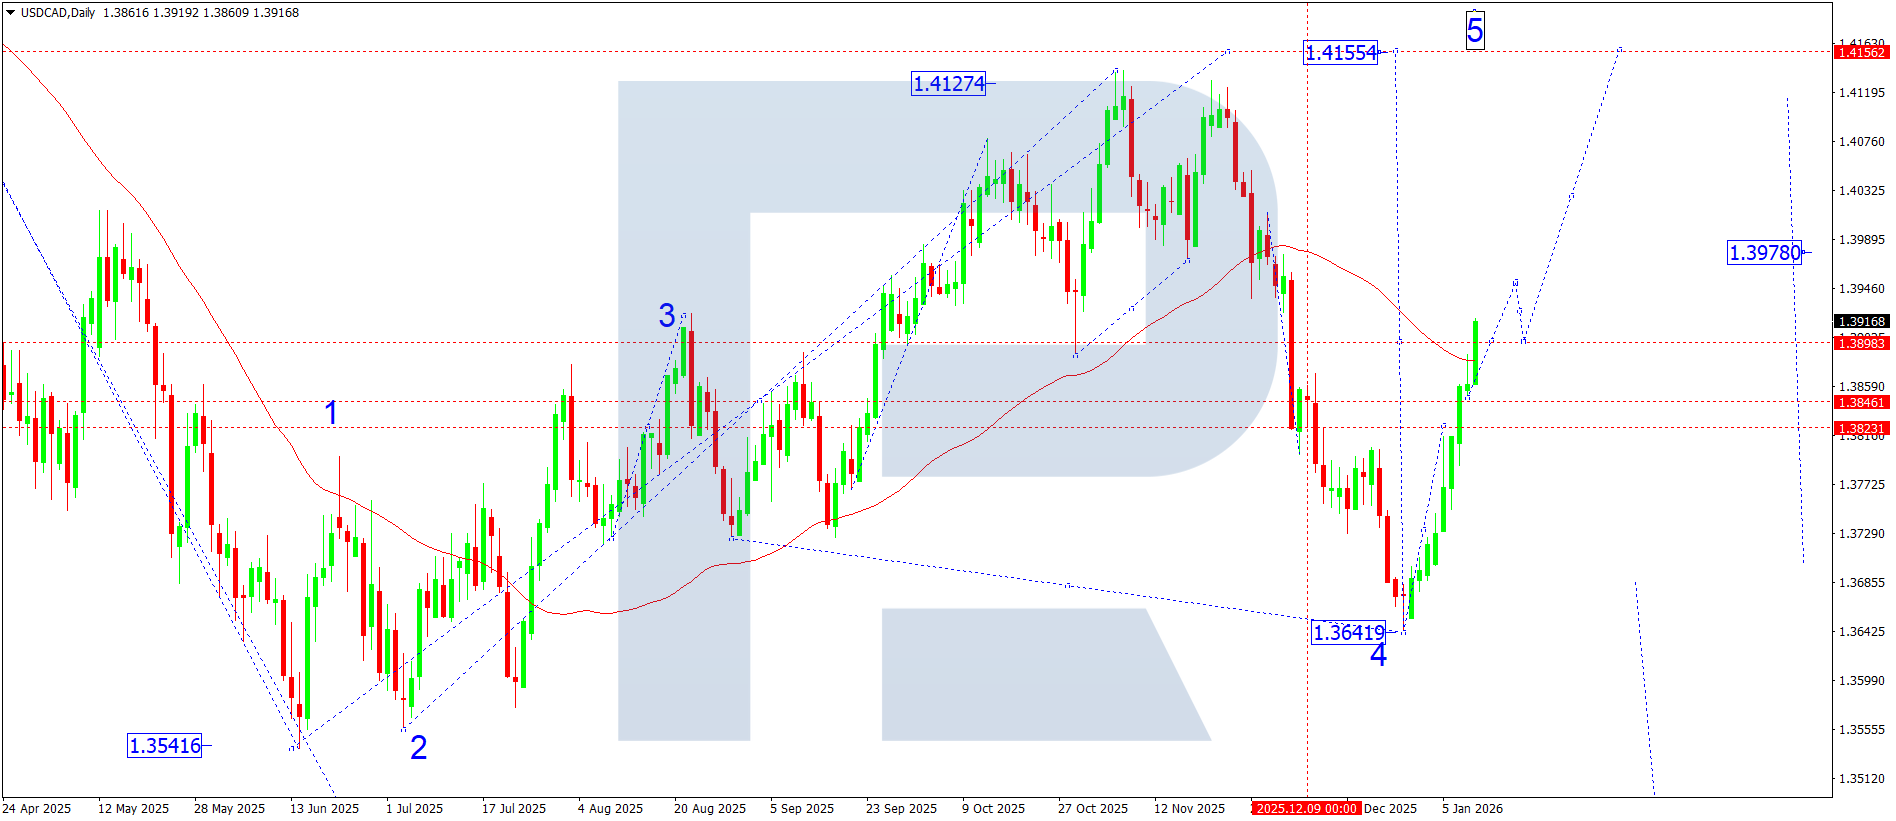
On the daily USDCAD chart, the market is forming an upward structure, with the wave developing towards 1.4150. The market has now broken above the key resistance level at 1.3898, opening the potential for the current growth wave to continue to 1.3950.
After the market reaches the 1.3950 zone, it may form a corrective move, pulling back towards 1.3900 (retesting the broken level from above). This scenario will be considered as a technically sound correction within an uptrend. After it ends, the upward move is expected to continue with the main target at 1.4150.
USDCAD forecast scenarios
*Bullish (baseline) scenario:* if the price remains above 1.3898, growth could continue towards 1.3950, with the impulse developing to 1.4150 (the main target of the week and the medium-term structure) after a possible correction.
*Bearish (alternative) scenario:* a decline and consolidation below 1.3850 will materially weaken the bullish structure and open the way for a deeper correction towards 1.3700.
XAUUSD forecast
Gold continues to gain steady support from the macroeconomic and geopolitical agenda. High uncertainty around the Fed’s monetary policy remains the key factor: the market is pricing in a scenario of soft financial conditions lasting longer than expected, which pressures real yields and drives demand for safe-haven assets.
Persistent geopolitical tensions act as an additional driver, strengthening demand for gold as a risk-hedging instrument. Institutional demand remains high, including buying from central banks, which forms long-term fundamental support for the market.
Inflation expectations also remain relevant: even as inflation slows, the market continues to price in the risk of renewed acceleration, which traditionally bolsters gold. Against this backdrop, the market treats corrective moves within the uptrend as technical pullbacks rather than a reversal of the main structure.
XAUUSD technical analysis
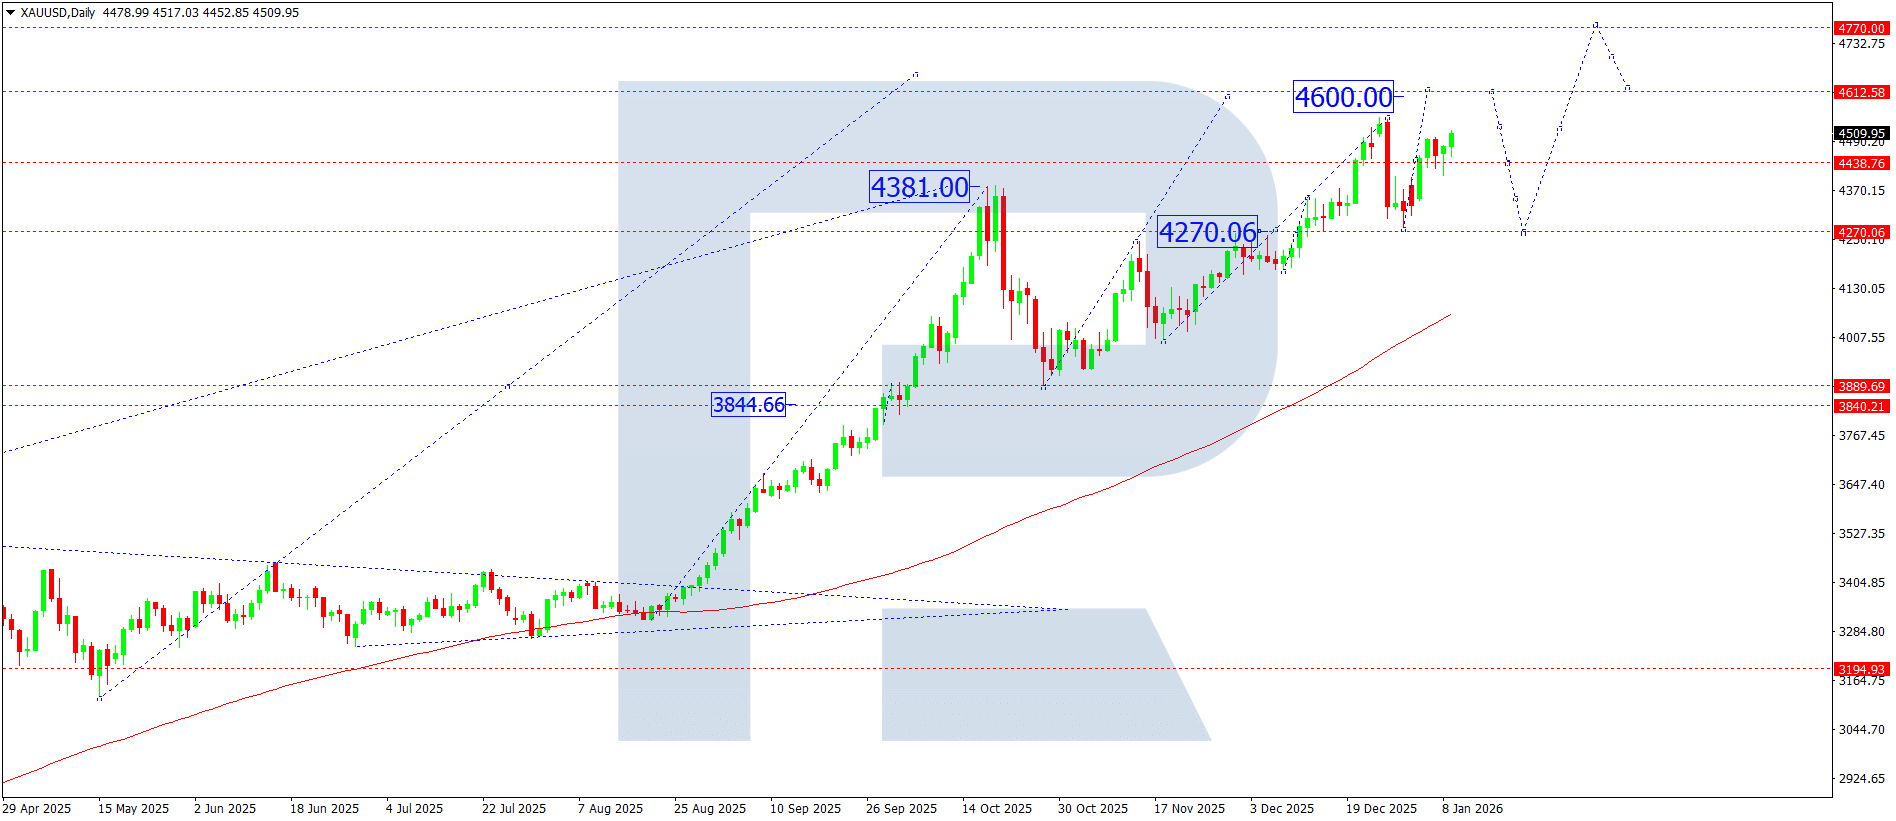
On the daily gold chart, the market has broken above 4,499 and maintains its upward momentum with the current target in the 4,600 area. This week, the market is expected to reach this level before forming a corrective move and returning to 4,499 (testing from above).
Holding above the 4,499–4,400 zone will indicate the stability of the bullish structure, enabling the growth impulse to extend further, with the prospect of moving towards 4,770.
XAUUSD forecast scenarios
*Bullish (baseline) scenario:* support near 4,300 formed a base for continued upward movement and sent the market to work through the potential of the current growth wave with the primary target at 4,600 and further prospects of an extended move.
*Bearish (alternative) scenario:* firm consolidation below 4,400 would signal a weakening of the current structure and open the potential for a decline with the target near 4,200.
Brent forecast
The oil market remains in a zone of heightened sensitivity to geopolitical factors. Supply disruption risks and expectations of a supply deficit in Q1 continue to provide the main support for prices.
Geopolitical tensions remain the key factor:
- Middle East – the risk of a broader conflict persists, which increases the risk premium in oil quotes
- Europe – the region’s energy vulnerability and dependence on imports support demand for Brent futures
- Venezuela – domestic instability, sanctions restrictions, and uncertainty around export deliveries create an additional factor of a potential supply shock
On the supply side, the market continues to price in a tough OPEC+ stance aimed at controlling output and maintaining the price balance. Any signals of quota extensions or tighter limits will act as a reason for the market to accelerate upwards.
From the demand perspective, the seasonal factor at the start of the year remains moderately neutral. However, expectations of industrial activity and transport demand recovery cap the potential for a deep correction.
Overall, the fundamental picture remains moderately bullish, with a high probability of impulsive moves amid news triggers and the absence of strong fundamental arguments for a sustained downward reversal.
Brent technical analysis
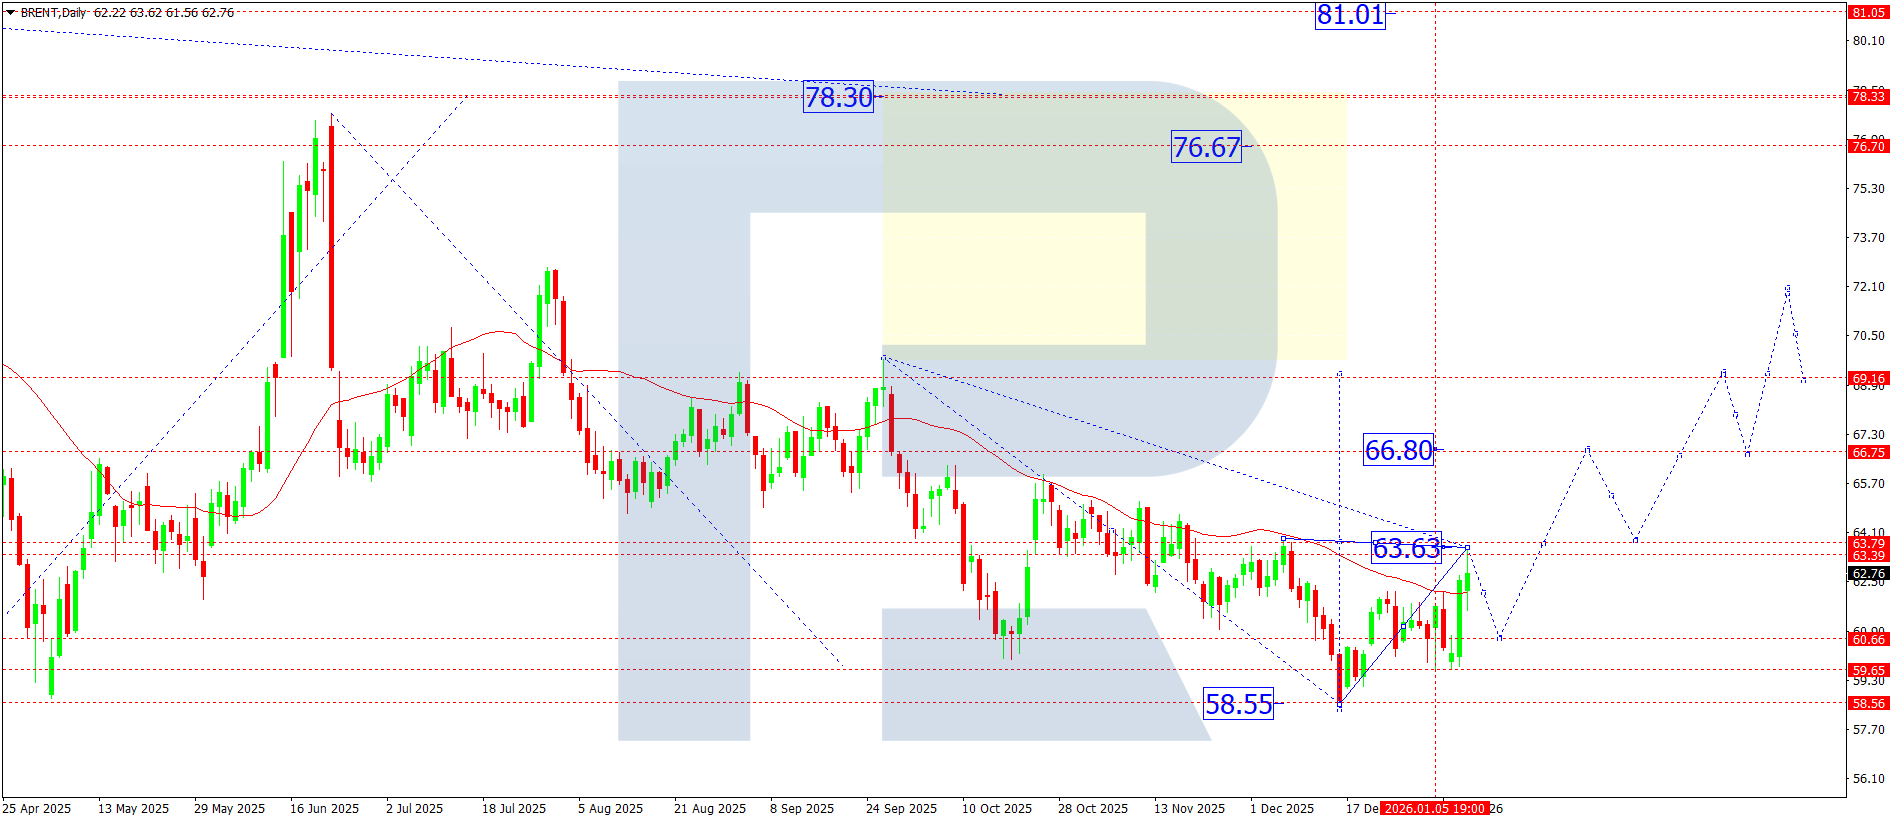
On the daily chart, Brent completed the upward wave structure, reaching 63.62. This week, a consolidation range is expected to develop below this level.
- An upward breakout would open the potential for the trend to continue towards 66.80
- If the market breaks downwards, a correction to 60.66 remains possible, after which the uptrend could resume, with the target at 66.80 (local target)
Brent forecast scenarios
*Bullish (baseline) scenario:* given persistent and potentially escalating geopolitical risks, the market may continue to rise without forming a deep correction. In this case, it will be relevant to consider accelerated movement to the following targets:
- first target: 66.80
- second target: 66.40
- main target of the first growth wave: 68.40
*Bearish (alternative) scenario:* the market may deliver a correction to the 60.66 area as part of a pullback after impulsive growth.
Editors’ picks
 EURUSD 2026-2027 forecast: key market trends and future predictions
This article provides the EURUSD forecast for 2026 and 2027 and highlights the main factors determining the direction of the pair’s movements. We will apply technical analysis, take into account the opinions of leading experts, large banks, and financial institutions, and study AI-based forecasts. This comprehensive insight into EURUSD predictions should help investors and traders make informed decisions.
 Gold (XAUUSD) forecast 2026 and beyond: expert insights, price predictions, and analysis
Dive deep into the Gold (XAUUSD) price outlook for 2026 and beyond, combining technical analysis, expert forecasts, and key macroeconomic factors. It explains the drivers behind gold’s recent surge, explores potential scenarios including a move toward 4,500 to 5,000 USD per ounce, and highlights why the metal remains a strong hedge during global uncertainty.
Forecasts presented in this section only reflect the author’s private opinion and should not be considered as guidance for trading. RoboForex bears no responsibility for trading results based on trading recommendations described in these analytical reviews.