Weekly technical analysis and forecast (19–23 January 2026)
This weekly technical analysis highlights the key chart patterns and levels for EURUSD, USDJPY, GBPUSD, AUDUSD, USDCAD, gold (XAUUSD), and Brent crude oil to forecast market moves for the upcoming week (19–23 January 2026).
Major technical levels to watch this week
- EURUSD: Support: 1.1555, 1.1430. Resistance: 1.1680, 1.1750
- USDJPY: Support: 157.60, 156.50. Resistance: 160.00, 162.62
- GBPUSD: Support: 1.3290, 1.322. Resistance: 1.3390, 1.3490
- AUDUSD: Support: 0.6650, 0.6600. Resistance: 0.6700, 0.6770
- USDCAD: Support: 1.3850, 1.3800. Resistance: 1.3970, 1.4000
- Gold: Support: 4,560, 4,500. Resistance: 4,633, 4,660
- Brent: Support: 63.00, 60.50. Resistance: 66.33, 67.80
EURUSD forecast
The key factor for the market remains the risk of a possible US government shutdown in January, which increases uncertainty around budget policy and may pressure the dollar through higher volatility this week. Escalating geopolitical tensions in the Persian Gulf further add to instability, increasing demand for safe-haven assets and strengthening short-term distortions in capital flows. In these conditions, the EURUSD market remains sensitive to the news agenda and sharp liquidity impulses.
EURUSD technical analysis
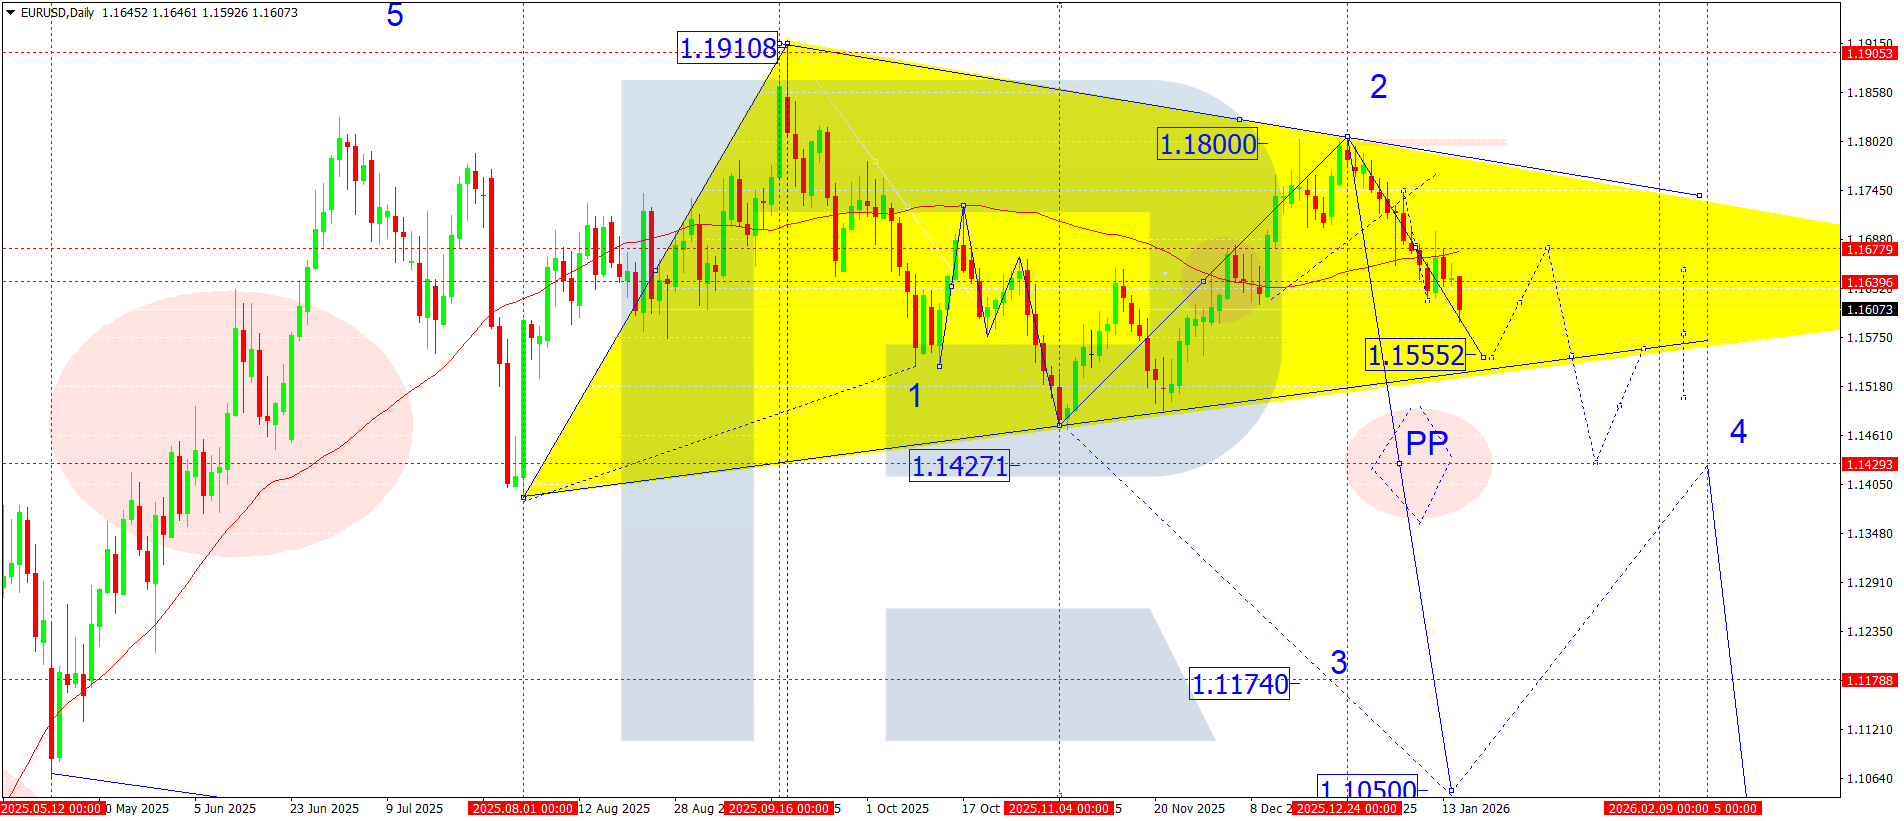
On the daily EURUSD chart, the market broke below the SMA 50 near 1.1680 and continues to form a downward wave within a medium-term corrective structure. At the moment, the market retains the potential to move towards 1.1555, which acts as the nearest target of the current wave.
The overall price structure indicates a decline developing towards the lower boundary of the Triangle pattern. If the market rebounds from this boundary, it may start a corrective move with a return to the 1.1677–1.1680 zone, where the upper boundary of the pattern and the resistance area lie.
If the market breaks confidently below 1.1550, it will open potential for the downtrend to continue with a local target near 1.1430.
EURUSD forecast scenarios
Bearish (baseline) scenario: continued downward movement towards 1.1430.
Bullish (alternative, unlikely) scenario: if the market breaks above 1.1630 amid rising volumes, a correction may develop with the target at 1.1680.
USDJPY forecast
The market continues to factor in the divergence between the Fed’s and the Bank of Japan’s monetary policies. The Fed’s continued hawkish rhetoric, alongside the lack of tightening signals from the BoJ, supports the dollar. US macroeconomic data and rising geopolitical risks may add to volatility, as they increase demand for the dollar as a safe-haven asset.
USDJPY technical analysis
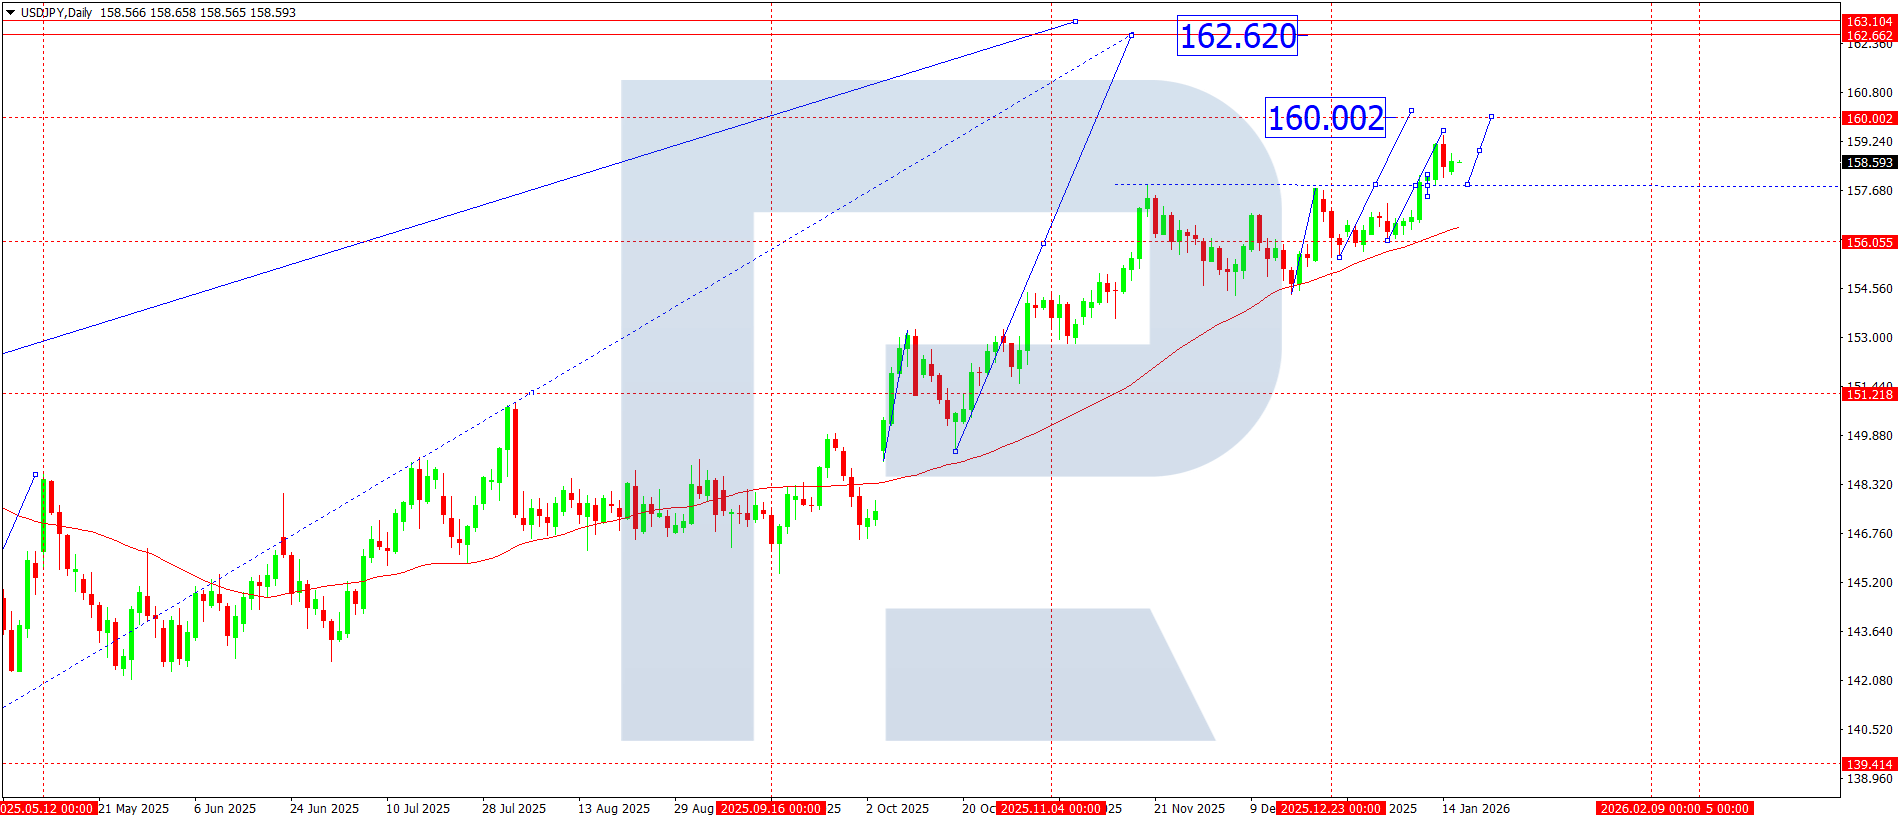
On the daily USDJPY chart, the market continues to form a consolidation range near 157.00 within an uptrend. The price is hovering above the Moving Average, indicating that the medium-term bullish momentum remains possible.
Over the coming week, the fifth growth wave is expected to extend, with the primary target at 160.00. If momentum develops, the wave may extend further towards 162.62.
After the market reaches the 160.00–162.62 zone, a corrective pullback towards 157.00 is possible, after which the baseline scenario anticipates the uptrend resuming with a focus on the 162.50–163.00 area.
USDJPY forecast scenarios
Bullish (main) scenario: firm holding above 156.60 and momentum development will open the potential for continued growth to 160.00, followed by a move towards 162.62.
Bearish (alternative) scenario: if the market drops sharply and breaks below 157.00, the likelihood of a corrective move towards 154.50 will rise.
GBPUSD forecast
The fundamental backdrop for the GBPUSD pair remains largely negative for the British pound next week. Pressure comes from the Fed’s hawkish rhetoric amid persistent US inflation risks, which supports the dollar and widens the yield differential in its favour.
From the UK side, the market continues to price in slowing economic activity and limited room for further Bank of England tightening. Budget discussions and weak macroeconomic statistics add another uncertainty factor, reducing demand for the pound in the medium term.
Overall, fundamental factors support the scenario of continued downward momentum in GBPUSD, with priority given to selling during corrections.
GBUSD technical analysis
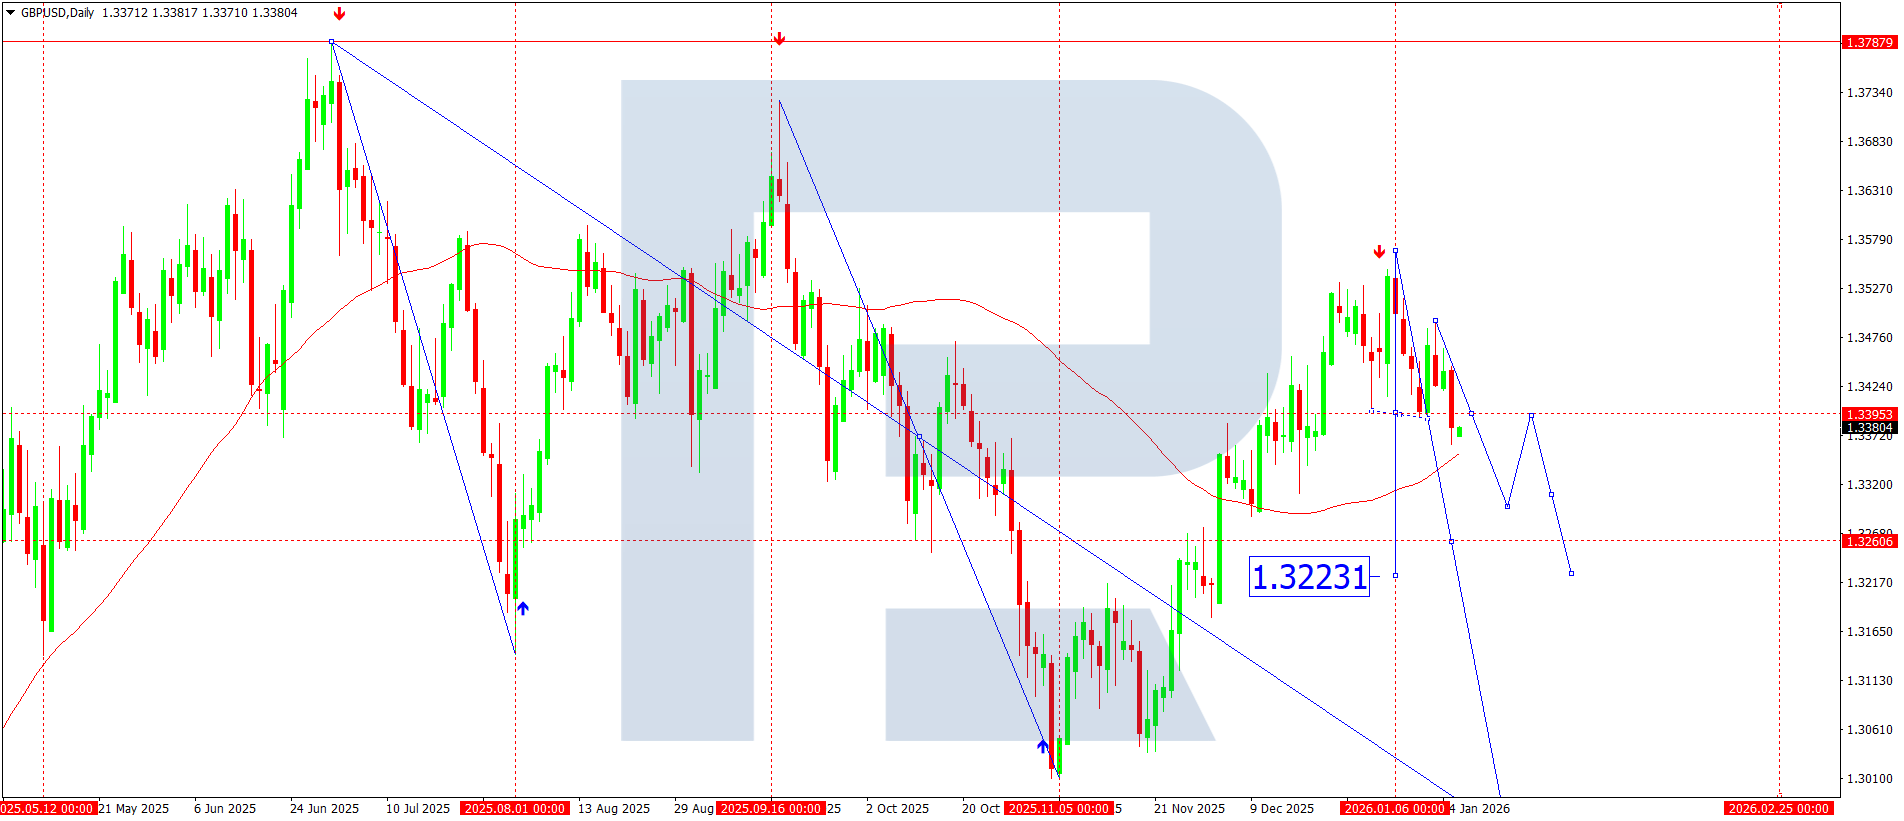
On the daily chart, the GBPUSD pair broke below the low of the first downward impulse, confirming the development of the second impulse in the downtrend. Within the current structure, the market is moving towards 1.3293, where the local decline phase is expected to complete.
After the market reaches this level, it may form a corrective move with a return towards 1.3393 (a test of the level from below). The market treats this rise as corrective within the dominant bearish scenario.
Later, if the selling pressure continues, the next downward impulse is expected to develop, with the target area at 1.3222 – the first target in the trend.
GBPUSD forecast scenarios
Bearish (main) scenario: continuation of the decline structure with a move to 1.3290, after which a short-term correction is possible, and the fall may resume towards 1.3222.
Bullish (alternative) scenario: if the market breaks and consolidates confidently above 1.3400, it may break the current downward structure and rise towards 1.3500.
AUDUSD forecast
Over the coming week, AUDUSD dynamics will be shaped by the combined influence of a strong US dollar and a restrained Australian backdrop.
From the US side, the market continues to factor in the Fed’s hawkish rhetoric and expectations that interest rates will stay high for longer. Strong labour market and inflation data support the dollar, increasing pressure on commodity bloc currencies, including the AUD. Rising US Treasury yields add another factor, as they reduce the appeal of high-risk assets.
The Australian dollar remains vulnerable amid the RBA’s neutral stance. The regulator continues to signal a pause in the tightening cycle, which limits AUD potential against a strong USD. Slowing economic activity in China, Australia’s key trading partner, further adds to pressure, especially in commodities and industrial production.
A broader deterioration in risk appetite and persistent geopolitical uncertainty continue to tilt the balance towards safe-haven assets, increasing the likelihood of continued downward movement in AUDUSD.
AUDUSD technical analysis
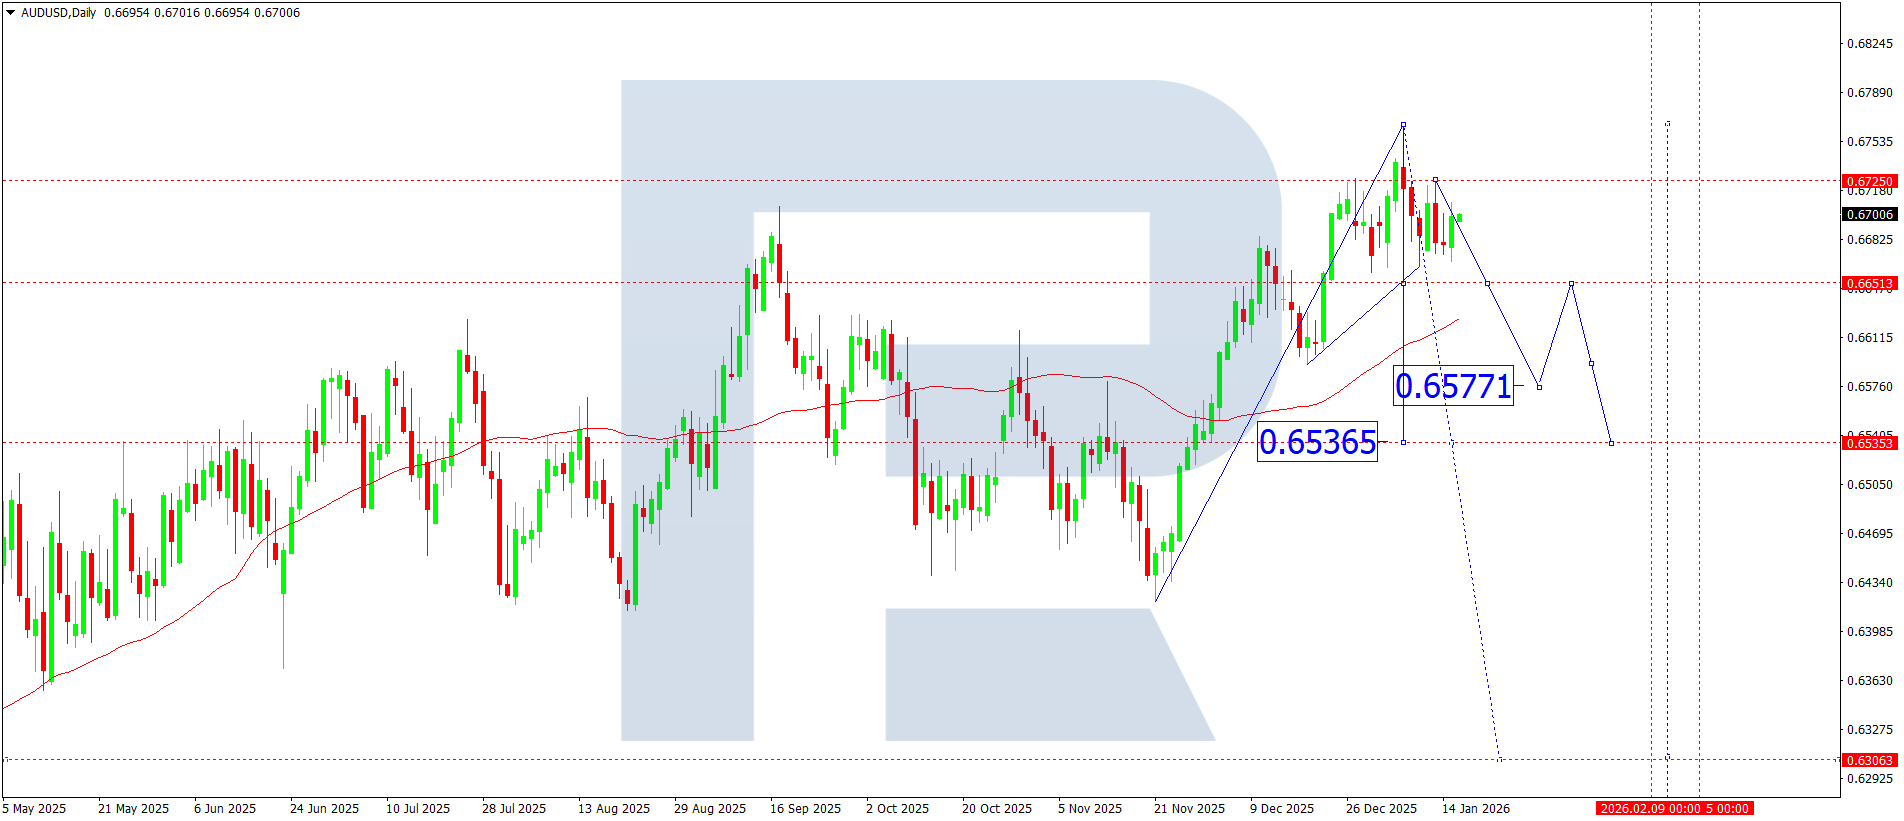
On the daily AUDUSD chart, the market continues to develop a consolidation range around 0.6700. A decline towards 0.6650 is expected. A breakout below this level will open the door for a decline to 0.6577, with the trend possibly extending to 0.6533 as the first target.
AUDUSD forecast scenarios
Bearish (main) scenario: the pair is expected to decline to 0.6560, with the trend continuing to 0.6525.
Bullish (alternative) scenario: a breakout above 0.6700 will open the potential for growth towards 0.6770.
USDCAD forecast
The Canadian dollar remains under pressure amid persistent uncertainty in the oil market’s dynamics and expectations of softer Bank of Canada rhetoric in Q1. Despite oil price stabilisation, market participants do not price in a sustained recovery in Canada’s export revenues.
From the US side, the dollar retains support due to:
- expectations that the Fed will keep tight monetary policy
- higher demand for safe-haven assets
- overall geopolitical tension
Overall, the fundamental backdrop remains moderately bullish for the USDCAD pair, which supports the scenario of continued upward movement after corrective phases.
USDCAD technical analysis
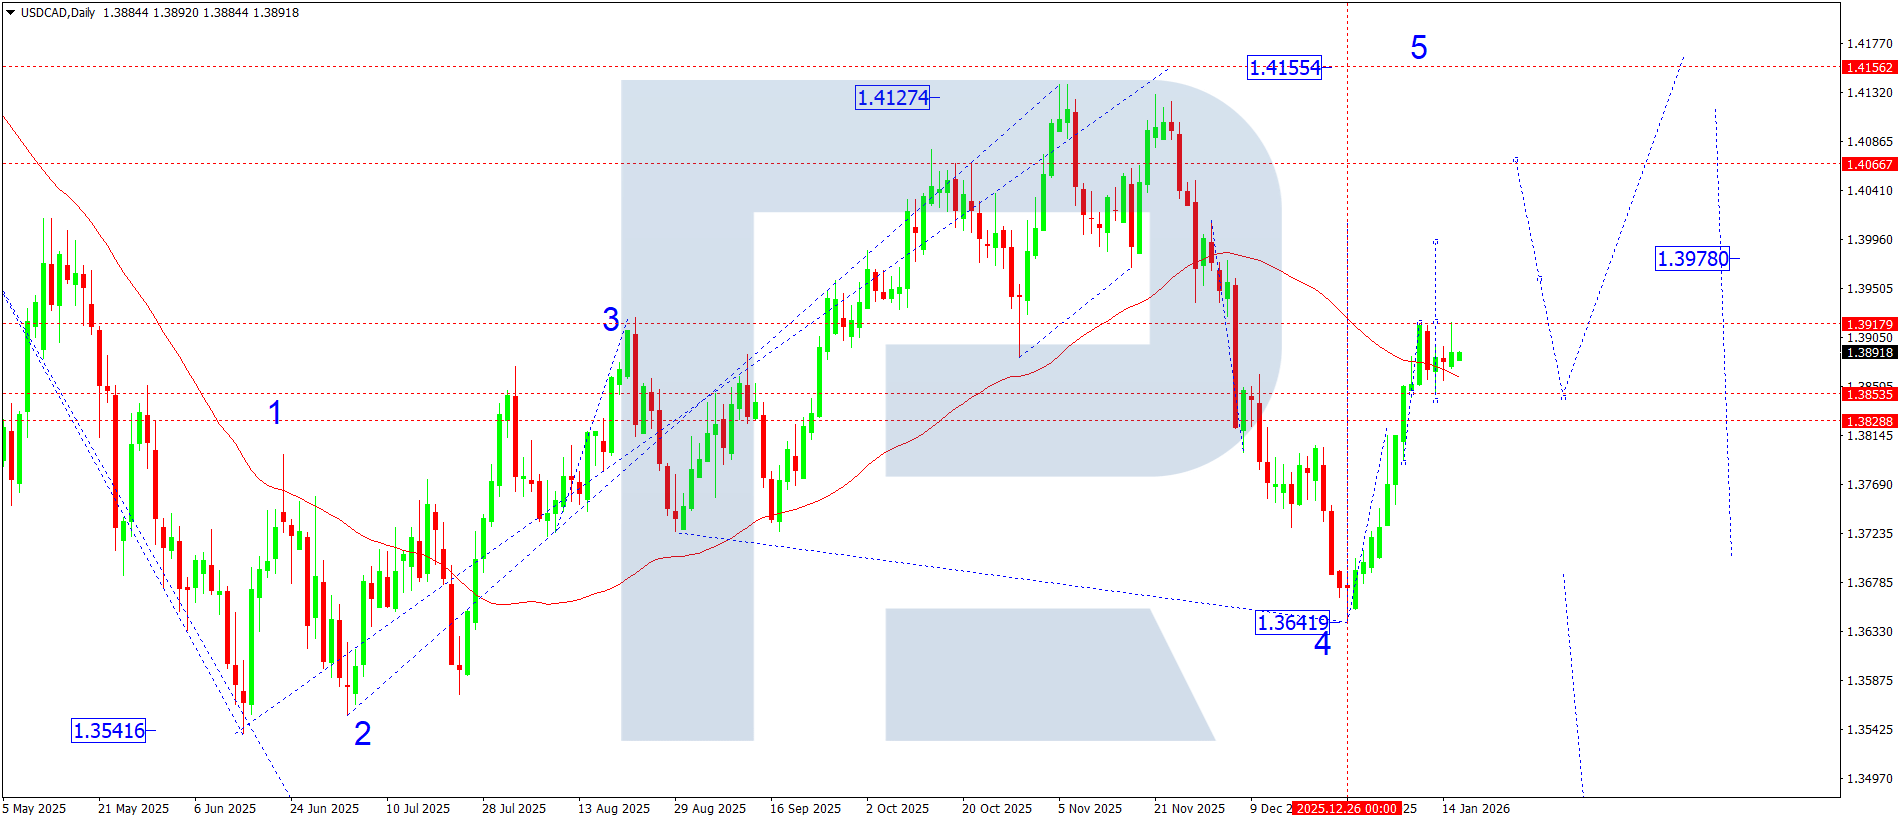
On the daily USDCAD chart, the market continues to form an impulsive growth structure, with the target near 1.4150.
After the correction towards 1.3850 ended, the market formed a base for a new upward wave. At the moment, the market is starting another impulsive structure, with the nearest target at 1.3970. After the market reaches it, the wave may extend further towards 1.4150 (the first target zone).
The move’s structure remains upward, while corrective pullbacks remain limited and fit within the trend scenario.
USDCAD forecast scenarios
Bullish (main) scenario: if the price remains above the 1.3850 zone, growth could continue to 1.3950–1.3970, with the prospect of a further move towards 1.4150.
Bearish (alternative) scenario: consolidation below 1.3800 will increase the probability of a deeper correction and open the way for a decline towards 1.3700, without breaking the medium-term upward structure.
XAUUSD forecast
Gold keeps its status as a key safe-haven asset amid a combination of macroeconomic and geopolitical factors. Persistent uncertainty around the Fed’s monetary policy path provides the main support for prices. The market remains sensitive to any signals of a US economic slowdown, which strengthens expectations of a softer regulatory rhetoric in the medium term.
Rising geopolitical tensions in the Middle East and several other regions act as an additional support factor, increasing demand for safe-haven instruments. Investors also focus on US Treasury yield dynamics and the dollar index: their local stabilisation limits pressure on gold and creates conditions for continued upward momentum.
XAUUSD technical analysis
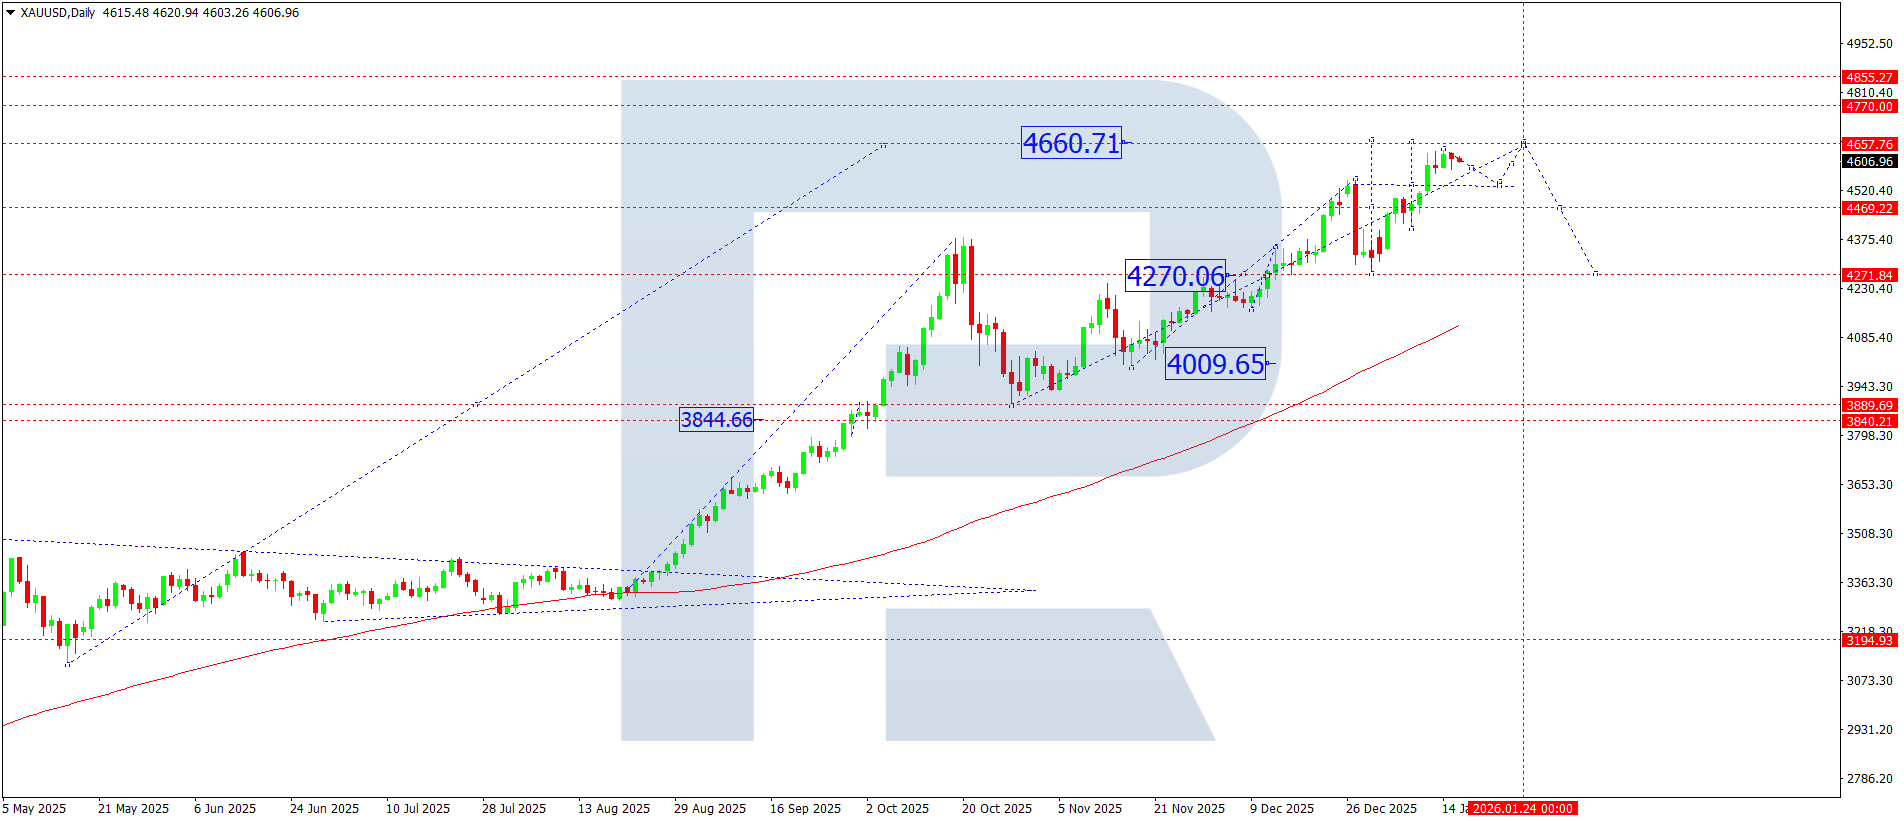
On the daily gold chart, the market broke confidently above 4,545 and continues its upward trajectory towards 4,660, which is expected to be reached this week. Subsequently, the market may form a corrective move with a return to 4,550 (a test from above of the previously broken resistance).
If the market confirms support from this zone, it will keep the potential to continue the upward move and form the next growth wave, with the target at 4,770.
XAUUSD forecast scenarios
Bullish (main) scenario: support near 4,300 formed a foundation for the upward potential to play out. If prices remain above 4,500, the main target for the current wave will be 4,660, with the prospect of the move extending further.
Bearish (alternative) scenario: firm consolidation below 4,500 will indicate a breakdown in the current growth structure and open the potential for a decline towards 4,300.
Brent forecast
The oil market remains sensitive to geopolitical risks. Tension in Europe, the Middle East, and especially around Iran creates a higher risk premium and keeps potential for sharp price moves, including impulsive growth without pronounced corrections.
Brent technical analysis
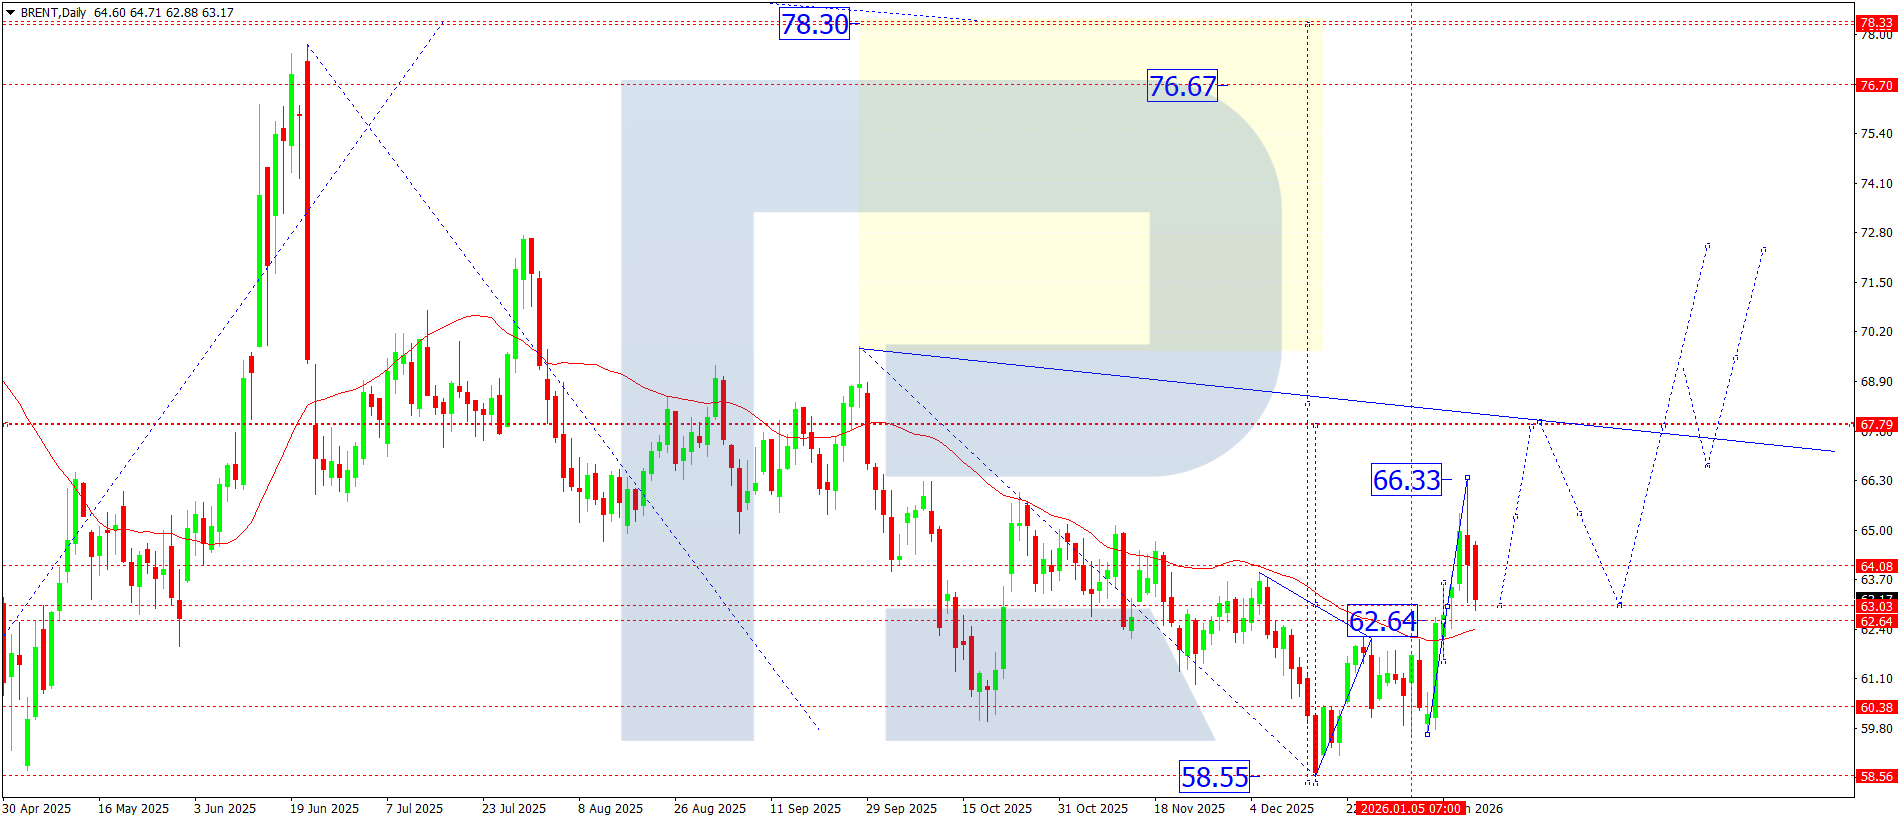
On the daily chart, Brent completed the growth wave structure by reaching 66.33 (local target). The market has now completed a correction towards 63.00, where it is forming a base.
A consolidation range is expected to develop above 63.00 over the coming week.
- An upside breakout will open the potential for the uptrend to continue, with the target at 67.80
- A downside breakout may deepen the correction towards 60.66, after which renewed growth towards 67.80 (first target) could be relevant
Brent forecast scenarios
Bullish (main) scenario: given serious geopolitical risks, a sharp momentum-driven rally without deep corrections remains highly likely. In this case, the targets are:
- 67.80 – first target
- 69.40 – second target
- 72.30 – local target of the fifth upward wave
Bearish (alternative) scenario: if the corrective dynamics strengthen, the market may decline towards 60.66, after which it may look for an upward reversal point.
Editors’ picks
 EURUSD 2026-2027 forecast: key market trends and future predictions
This article provides the EURUSD forecast for 2026 and 2027 and highlights the main factors determining the direction of the pair’s movements. We will apply technical analysis, take into account the opinions of leading experts, large banks, and financial institutions, and study AI-based forecasts. This comprehensive insight into EURUSD predictions should help investors and traders make informed decisions.
 Gold (XAUUSD) forecast 2026 and beyond: expert insights, price predictions, and analysis
Dive deep into the Gold (XAUUSD) price outlook for 2026 and beyond, combining technical analysis, expert forecasts, and key macroeconomic factors. It explains the drivers behind gold’s recent surge, explores potential scenarios including a move toward 4,500 to 5,000 USD per ounce, and highlights why the metal remains a strong hedge during global uncertainty.
Forecasts presented in this section only reflect the author’s private opinion and should not be considered as guidance for trading. RoboForex bears no responsibility for trading results based on trading recommendations described in these analytical reviews.