Weekly technical analysis and forecast (26–30 January 2026)
This weekly technical analysis highlights the key chart patterns and levels for EURUSD, USDJPY, GBPUSD, AUDUSD, USDCAD, gold (XAUUSD), and Brent crude oil to forecast market moves for the upcoming week (26–30 January 2026).
Major technical levels to watch this week
- EURUSD: Support: 1.750, 1.1825. Resistance: 1.1685, 1.1550
- USDJPY: Support: 158.30, 156.00. Resistance: 159.40, 160.00
- GBPUSD: Support: 1.3498, 1.3400. Resistance: 1.3545, 1.3590
- AUDUSD: Support: 0.6820, 0.6730. Resistance: 0.6855, 0.6895
- USDCAD: Support: 1.3698, 1.3615. Resistance: 1.3780, 1.3820
- Gold: Support: 4,888, 4,777. Resistance: 5,000, 5,050
- Brent: Support: 64.00, 63.50. Resistance: 64.70, 66.50
EURUSD forecast
The fundamental picture for the EURUSD pair remains mixed and is characterised by elevated uncertainty. Market participants are primarily focused on the risks of a possible US government shutdown in January, which increases dollar volatility and supports demand for alternative currencies.
Another factor pressuring the dollar is escalating geopolitical tensions in the Caribbean, which increases global risks and temporarily reduces interest in dollar assets. At the same time, investors remain cautious about the euro amid weak macroeconomic signals from the eurozone, which limits the pair’s potential for sustained growth. Thus, the fundamental backdrop creates conditions for elevated volatility and scenario-based trading within the medium-term range.
EURUSD technical analysis
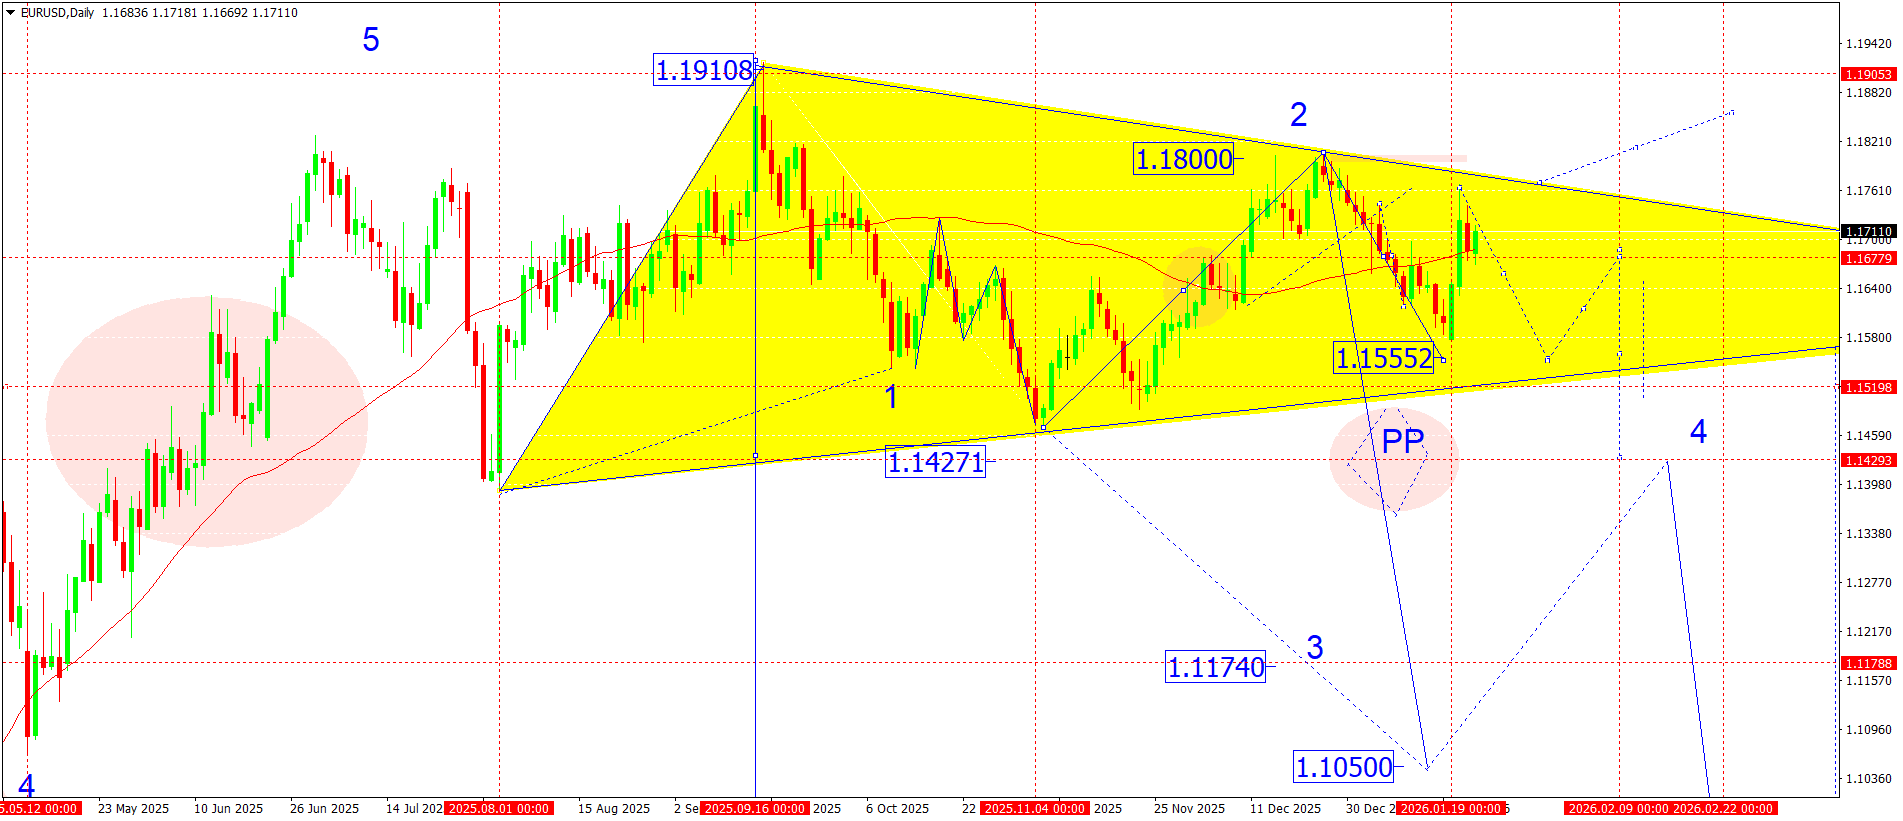
On the daily EURUSD chart, the market broke decisively and consolidated above the SMA 50 (1.1680), signalling the end of the previous correction phase and a transition to an upward wave. Within the current structure, the market suggests a continued upward move towards 1.1825, where the upper boundary of medium-term resistance and the projection of the second wave are located.
After the pair reaches 1.1825, a corrective move is expected, with a likely pullback to the 1.1680–1.1620 area (a test of the broken area from above). If the market breaks below 1.1680, it will open the potential for the decline to continue towards 1.1555, where key support of the current range is located. If the 1.1620 support level holds and reversal signals form, the upward wave could resume, aiming for 1.1825–1.1850.
EURUSD forecast scenarios
Bearish scenario (baseline): continued decline in line with the trend towards 1.1680.
Bullish scenario (alternative): if the market breaks above 1.1750 amid rising volumes, a correction may develop with the target at 1.1825.
USDJPY forecast
The USDJPY pair maintains an upward bias amid the persistent divergence between the monetary policies of the US Federal Reserve and the Bank of Japan. The US regulator continues to maintain a hawkish tone, emphasising the priority of fighting inflation and the need to keep interest rates high for an extended period. This supports the dollar and increases capital inflows into dollar-denominated assets.
At the same time, the Japanese yen remains under pressure due to weak fiscal prospects for Japan and the lack of signals from the BoJ about an imminent exit from ultra-loose monetary policy. The market prices in the persistence of negative real rates and limited scope for the regulator to tighten conditions, which continues to weigh on the JPY.
An additional uncertainty factor is the possibility of verbal interventions by Japanese authorities if the pair accelerates above the psychological 160.00 level. However, until real steps from the BoJ emerge, the market sees this factor as more restraining than trend-reversing.
Over the coming week, market participants will focus on US macroeconomic data and any comments from Fed officials that could affect rate expectations. Overall, the fundamental backdrop remains moderately bullish for the USDJPY pair.
USDJPY technical analysis
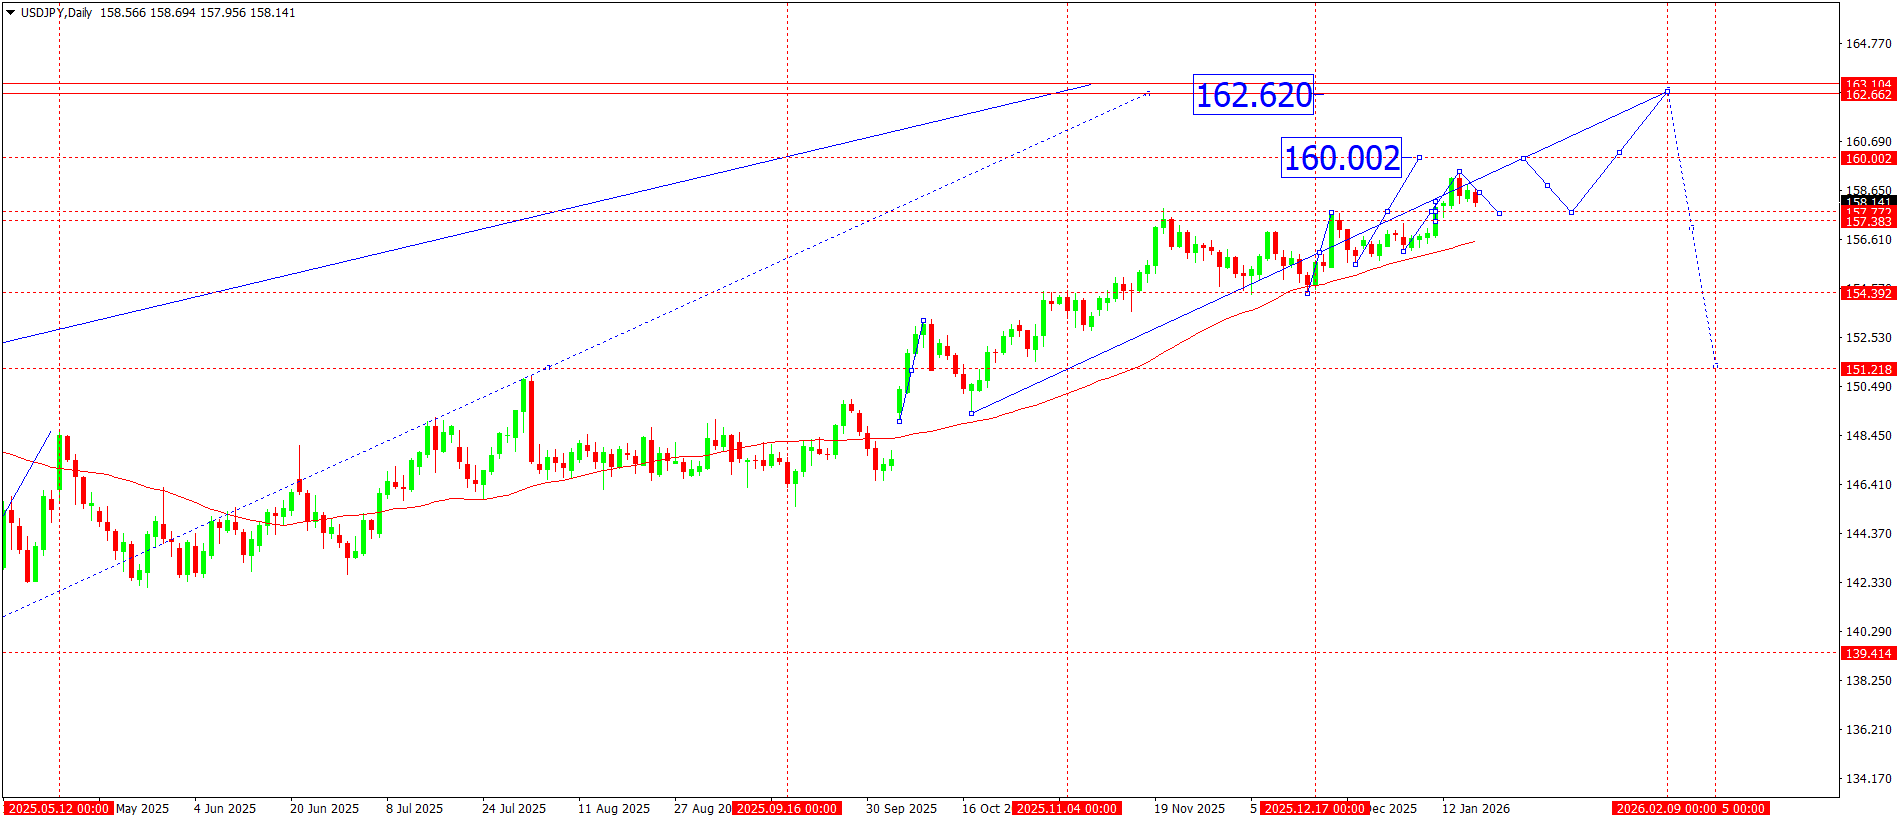
On the daily USDJPY chart, the market found support in the 158.30–158.36 area, after which a new upward wave began to form. The current structure points to an impulsive move towards the nearest resistance level at 159.40.
Buyers are expected to attempt a confident breakout of this level during the week. If they succeed, it will open the door for growth towards 159.90–160.00, where a strong psychological and technical resistance zone sits.
The move towards 160.00 may become the final phase of the current growth wave. After reaching this area, the probability of a corrective move increases, with targets near 157.70, where the nearest significant demand zone and previously formed support are located.
The overall structure still shows signs of an uptrend, but price trading near multi-year highs increases the risks of volatile pullbacks and profit-taking.
USDJPY forecast scenarios
Bullish scenario (main): firm holding above 158.35 and a breakout above the 159.40 resistance level will open the way for continued growth towards 160.00. Consolidation above this level will strengthen the bullish momentum and allow the market to consider further extension of the move.
Bearish scenario (alternative): in the event of a sharp decline and a breakout below 157.00, the probability of a deeper correction will increase, with the target zone near 155.50, which will be viewed as a corrective move within a larger uptrend.
GBPUSD forecast
The pound sterling shows resilience amid a weakening US dollar, driven by rising uncertainty around US fiscal policy and discussions of a possible partial federal government shutdown. Another factor pressuring the dollar is the decline in expectations for aggressive Fed tightening amid mixed macroeconomic statistics.
From the UK side, the market continues to factor in the Bank of England’s hawkish rhetoric. Inflation risks remain elevated, limiting the scope for easing and supporting the pound. Investors are also closely watching labour market and business activity data releases, which may increase volatility in the pair in the second half of the week.
Overall, the fundamental backdrop is moderately positive for GBPUSD, although the probability of profit-taking increases near key resistance levels.
GBUSD technical analysis
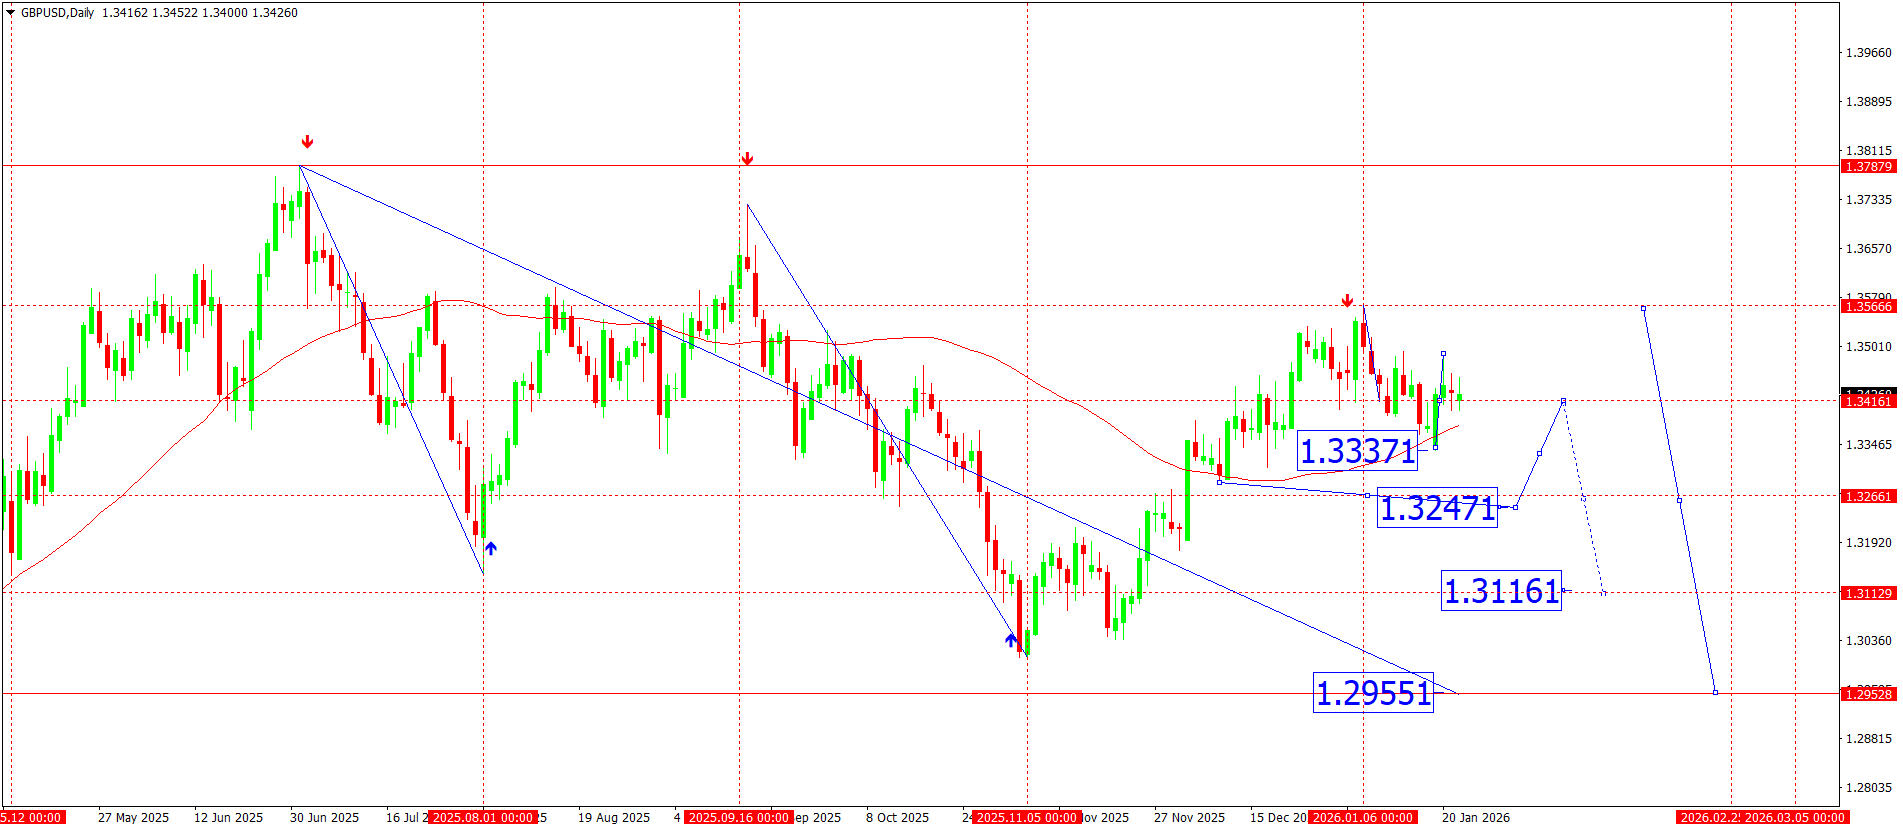
On the daily chart, the GBPUSD pair broke confidently above 1.3468, confirming a breakout from the local consolidation zone. The current dynamics indicate a continued upward wave structure with the nearest target near 1.3535.
After the pair reaches this level, a corrective move with a return to 1.3480 (testing from above) is possible, which will be viewed as a technically healthy correction within the current momentum. If buying activity persists, the market may continue to rise towards 1.3593, where, according to the current structure, the upward move’s potential is expected to be exhausted, and the risks of a reversal or a deeper correction will rise.
GBPUSD forecast scenarios
Bullish scenario (main): if the market consolidates confidently above 1.3460–1.3468, the growth structure is expected to develop towards 1.3535, followed by a test of 1.3590–1.3593.
Bearish scenario (alternative): a sharp decline and a breakout below 1.3450 would cancel the bullish scenario and open the potential for a decline towards 1.3400, with the risk of a deeper correction if the US dollar strengthens.
AUDUSD forecast
The Australian dollar maintains moderately positive momentum amid stabilising sentiment in global markets and recovering demand for risk assets. The AUD is supported by the situation in commodity markets and expectations of easier financial conditions in China, which remains Australia’s key trading partner.
At the same time, the pair’s upside potential is limited by the US dollar’s persistent strength. The market continues to factor in the Fed’s hawkish rhetoric and uncertainty around the future path of US interest rates. Another pressure factor is the difference in monetary expectations: the RBA takes a more cautious approach, while the Fed has not yet provided clear signals of a rapid policy pivot.
Thus, the fundamental backdrop creates conditions for the current upward wave to complete and for the market to transition into a correction phase.
AUDUSD technical analysis
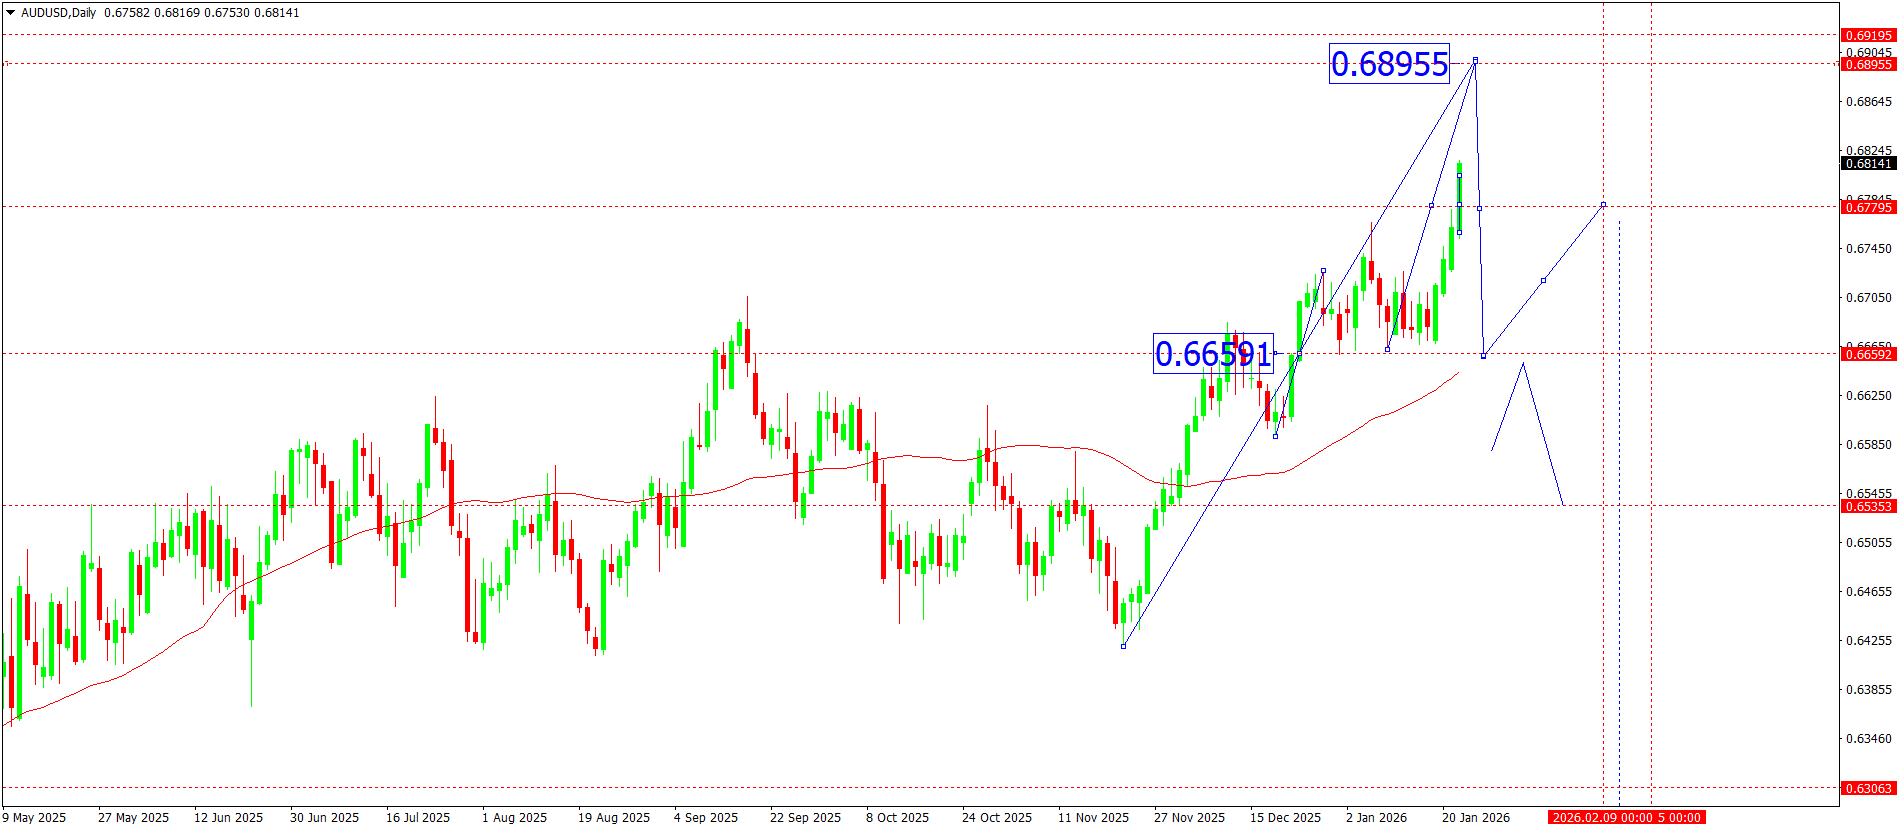
On the daily AUDUSD chart, the market continues to develop an upward wave structure with the current target in the 0.6895 area. The move is a final impulse, which increases the probability of a local top forming near this resistance level.
If the scenario of reaching the high plays out, a downward wave towards 0.6840 is expected to begin. A breakout and consolidation below this zone will confirm the development of a corrective impulse, with downside potential expanding towards 0.6770 – the first target zone under the bearish scenario.
The current structure points to a distribution phase, where the market becomes sensitive to breakouts below key support levels.
Text 12
Bullish scenario (baseline): it the price remains above 0.6830, growth will be expected to continue towards 0.6865, with the upward wave extending further to 0.6895. The 0.6895 zone is considered an area for profit-taking and a potential reversal.
Bearish scenario (alternative): a breakout and consolidation below 0.6838 will open the door for a continued decline within a new downward wave, with the target at 0.6770.
USDCAD forecast
The Canadian dollar retains relative resilience amid stabilising oil prices and reduced demand for safe-haven assets. The Brent oil market is consolidating above local lows, which continues to support the CAD as a commodity-linked currency.
From the US side, pressure on the dollar comes from expectations of a slowdown in the pace of Federal Reserve monetary tightening. Market participants are increasingly cautious in assessing the prospects for further rate hikes, shifting focus towards macroeconomic data and comments from Fed officials.
An additional factor is the divergence in monetary expectations between the Federal Reserve and the Bank of Canada. The BoC maintains a more neutral tone, which reduces the USD risk premium and boosts corrective pressure in the USDCAD pair. Overall, the fundamental backdrop for the current week is moderately bearish for the pair.
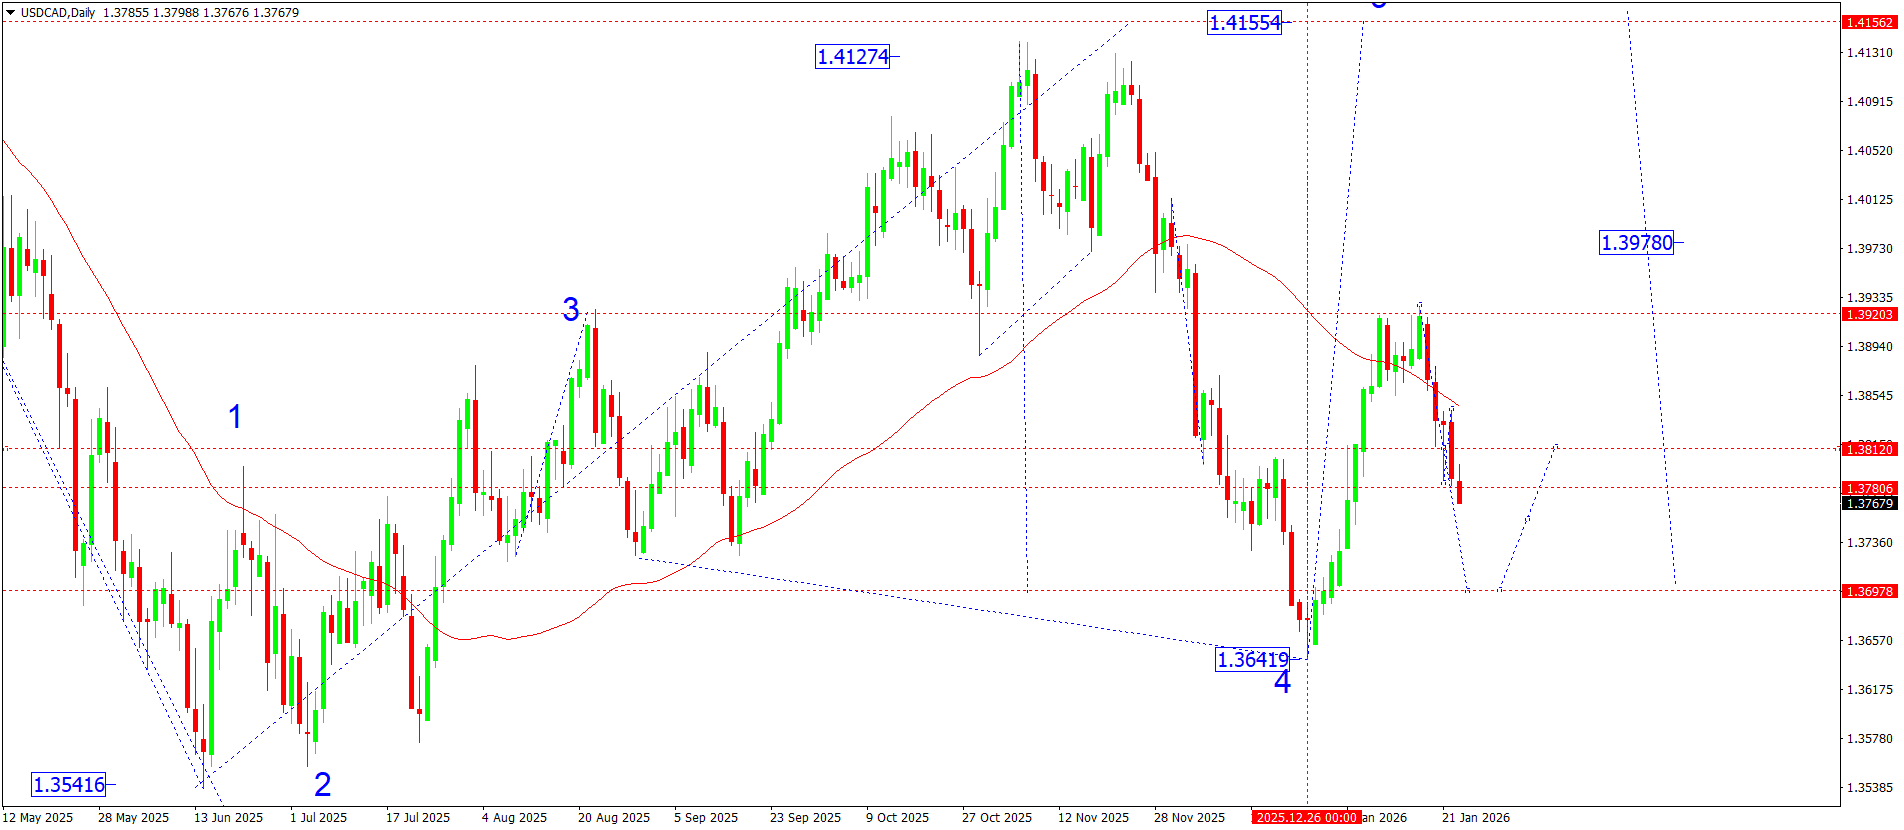
USDCAD technical analysis
On the daily USDCAD chart, the market confidently broke below the 1.3780 level, confirming the completion of the corrective structure and the transition to a new downward wave. The current momentum phase is aimed at reaching the key target level at 1.3698, where partial profit-taking and a slowdown in the downward move are expected.
After reaching 1.3698, the pair could undergo a correction, with the price recovering towards the 1.3812 area (a test of the previous breakout zone from below). However, the market structure indicates that this correction is likely to be limited in time and amplitude.
Further ahead, the potential remains for the decline to resume, with a local target in the 1.3752 area, which would correspond to the formation of a broader downward wave structure.
USDCAD forecast scenarios
Bearish scenario (baseline): if selling pressure persists and the market fails to return above 1.3780, the scenario of continued downside towards 1.3698 remains valid. Consolidation below this level will open room for a deeper decline towards 1.3615.
Bullish scenario (alternative): if the price rises strongly and breaks above 1.3850, the market will receive a signal for a deeper correction. This would open up potential for growth towards 1.3920, although this scenario is currently considered less likely.
XAUUSD forecast
Gold retains a strong bullish impulse amid a combination of macroeconomic and geopolitical factors.
Geopolitics and risk-off sentiment
- Escalating international tensions and stronger rhetoric from the US towards a number of regions continue to support demand for safe-haven assets. Investors price elevated geopolitical risks into portfolio structures, which directly benefits gold
US monetary policy
- The market maintains expectations of easing financial conditions in the medium term. Despite the Federal Reserve’s continued hawkish rhetoric, slowing inflation pressure and signs of cooling in the US economy are driving demand for gold as a hedge against monetary risks
- Yields and the US dollar
Gold is rising amid volatile US Treasury yield dynamics. Any signs of a decline or consolidation below local highs reduce the opportunity cost of holding gold. At the same time, the US dollar index is losing momentum, which provides additional support for XAUUSD
Institutional demand
- Elevated interest from central banks and large funds persists, forming long-term support for the market and limiting the depth of potential corrections
Fundamental conclusion:
The fundamental picture remains firmly bullish. Any corrective moves during the current week are viewed as technical and potentially limited.
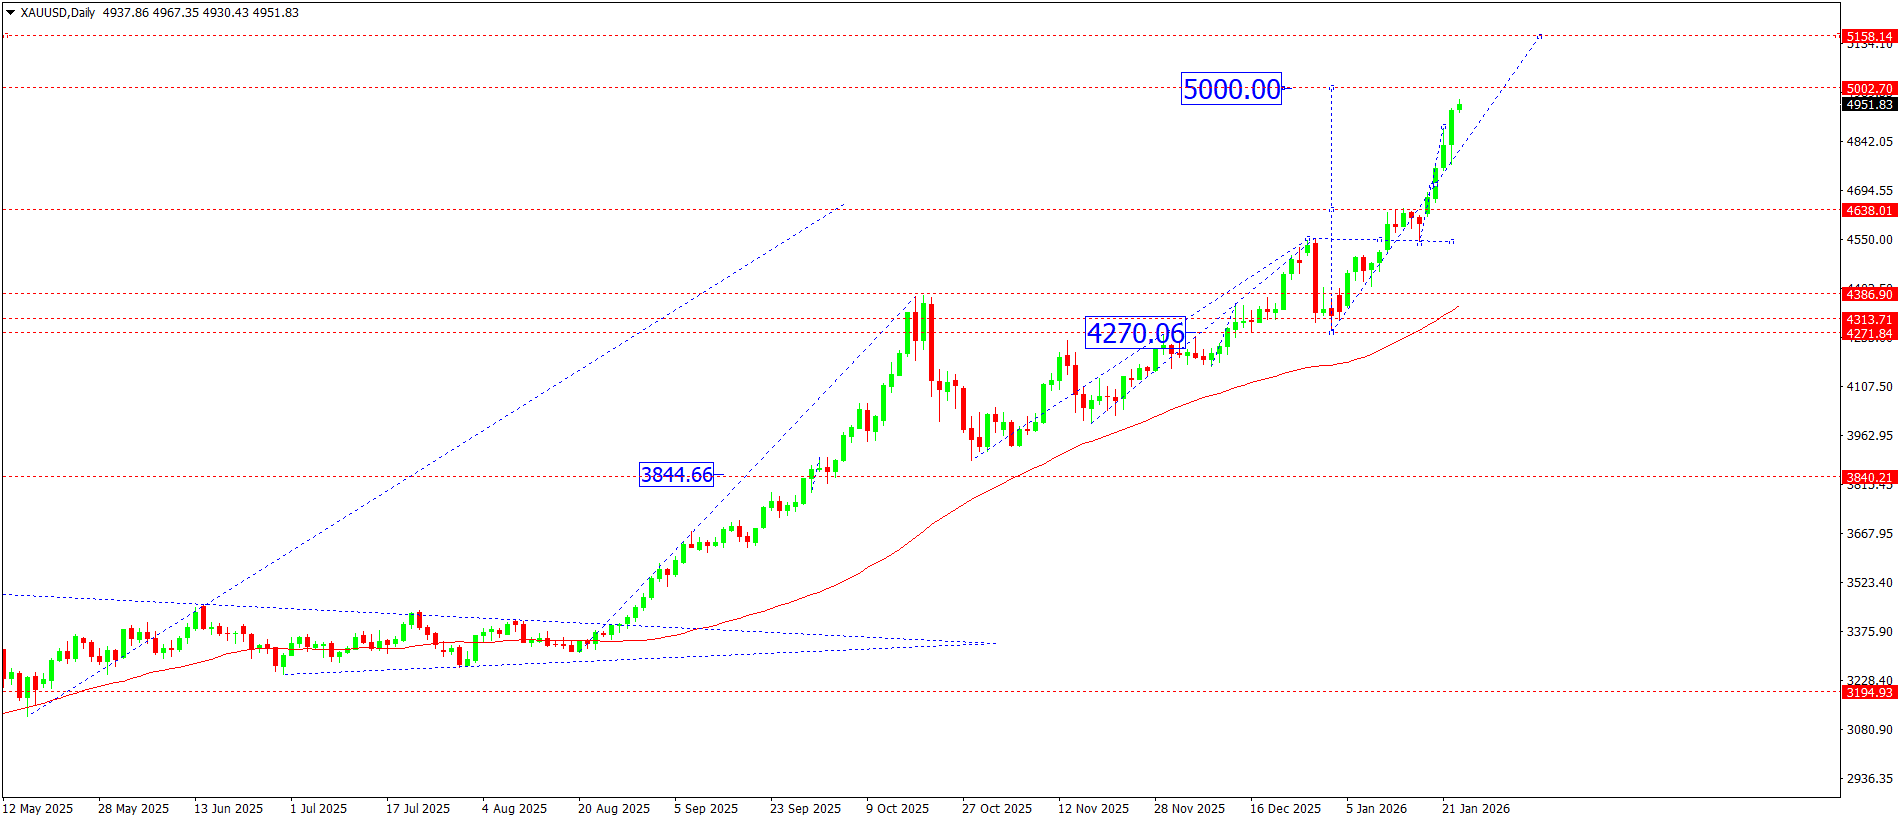
XAUUSD technical analysis
On the daily XAUUSD chart, the market confidently broke above the key level at 4,888, which previously acted as a supply zone. After the breakout, prices received confirmed support from above and continued an impulsive growth wave. The current structure points to a continuation of the move towards the psychological level at 5,000, which stands as the main target for the current week.
After reaching the 5,000 zone, a corrective leg is possible, with a potential pullback towards 4,888, representing a retest of the broken level from above.
If the 4,888 support level holds, the market will retain potential for further growth towards 4,950–5,000, with a consolidation range likely to form near these values. A deeper correction would only become possible if the current wave structure breaks.
XAUUSD forecast scenarios
Bullish scenario (main): support in the 4,777 zone formed a base for the development of an impulsive upward wave. The priority remains a move towards 5,000, followed by consolidation and an attempt to extend the upside.
Bearish scenario (alternative): if prices consolidate confidently below 4,770, the current bullish structure will break. This would open the potential for a deeper corrective wave with targets in the 4,300 area.
Brent forecast
The oil market retains a moderately positive tone following the recent correction. Brent prices continue to receive support from sustained supply control by OPEC+ and expectations of a seasonal increase in demand from oil refineries ahead of the spring period.
An additional supportive factor comes from geopolitical risks, including ongoing tensions in key regions of energy production and transportation. At the same time, the strengthening US dollar and uncertainty regarding the pace of the global economic recovery are restraining the development of a more aggressive bullish momentum.
Overall, the market is in a balancing phase: fundamentals create conditions for continued growth, but without a new driver, price action remains wave-based and corrective in nature.
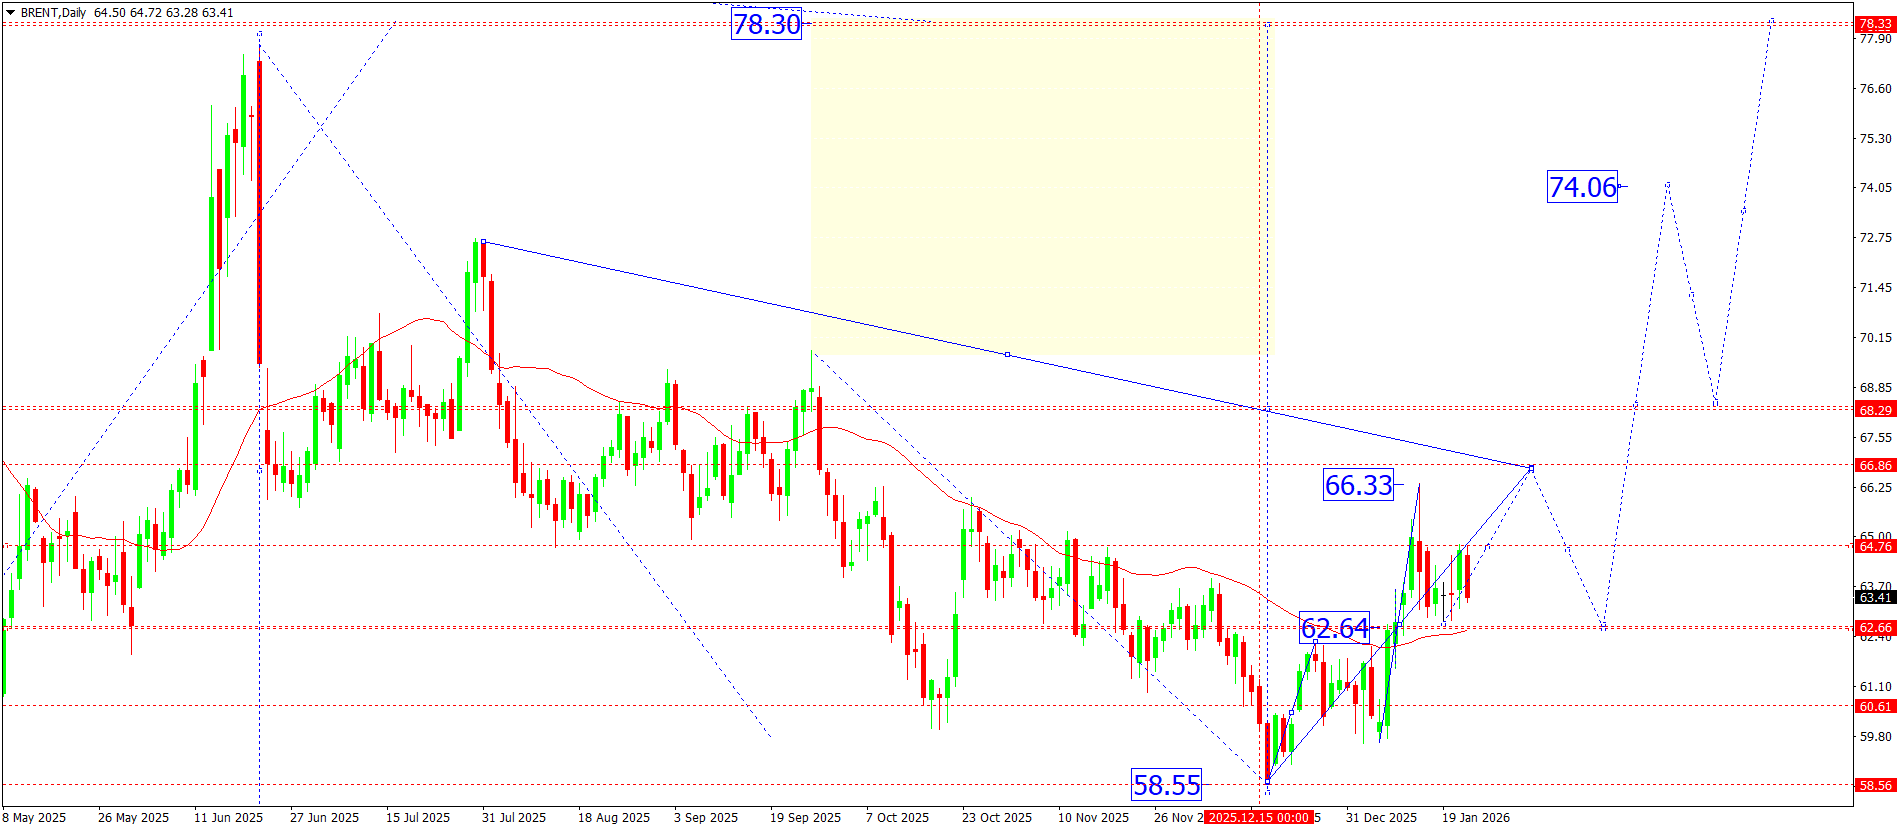
Brent technical analysis
On the daily chart, Brent crude is forming a growth wave structure, with a local target around 66.75. After completing the impulse, the market corrected lower towards the 63.00 level, where buying interest emerged.
For the current week, a new growth wave is expected to begin, aiming for 66.50. After reaching this level, a corrective pullback towards the 64.57 area is possible, which may act as a technical retest ahead of the final move towards the main target at 66.75.
The structure remains upward as long as prices hold above key support zones.
Brent forecast scenarios
Bullish scenario (main): a confident breakout and consolidation above the 64.69 level would open the door for continued growth first towards 65.75 and then towards 66.50–66.75 as part of the completion of the current wave structure.
Bearish scenario (alternative): if selling pressure intensifies and the support level is broken, the market may deepen the correction towards the 60.66 area, which would indicate a deeper redistribution phase ahead of the next attempt to move higher.
Editors’ picks
 EURUSD 2026-2027 forecast: key market trends and future predictions
This article provides the EURUSD forecast for 2026 and 2027 and highlights the main factors determining the direction of the pair’s movements. We will apply technical analysis, take into account the opinions of leading experts, large banks, and financial institutions, and study AI-based forecasts. This comprehensive insight into EURUSD predictions should help investors and traders make informed decisions.
 Gold (XAUUSD) forecast 2026 and beyond: expert insights, price predictions, and analysis
Dive deep into the Gold (XAUUSD) price outlook for 2026 and beyond, combining technical analysis, expert forecasts, and key macroeconomic factors. It explains the drivers behind gold’s recent surge, explores potential scenarios including a move toward 4,500 to 5,000 USD per ounce, and highlights why the metal remains a strong hedge during global uncertainty.
Forecasts presented in this section only reflect the author’s private opinion and should not be considered as guidance for trading. RoboForex bears no responsibility for trading results based on trading recommendations described in these analytical reviews.