Weekly technical analysis and forecast (2–6 February 2026)
This weekly technical analysis highlights the key chart patterns and levels for EURUSD, USDJPY, GBPUSD, AUDUSD, USDCAD, gold (XAUUSD), and Brent crude oil to forecast market moves for the upcoming week (2–6 February 2026).
Major technical levels to watch this week
- EURUSD: Support: 1.1845, 1.1615. Resistance: 1.1995, 1.2255
- USDJPY: Support: 152.15, 148.85. Resistance: 154.75, 155.65
- GBPUSD: Support: 1.3625, 1.3475. Resistance: 1.3845, 1.4065
- AUDUSD: Support: 0.6875, 0.6705. Resistance: 0.7075, 0.7265
- USDCAD: Support: 1.3465, 1.3295. Resistance: 1.3705, 1.3925
- Gold: Support: 4,945, 4,805. Resistance: 5,245, 5,450
- Brent: Support: 67.50, 62.85. Resistance: 69.95, 74.35
EURUSD forecast
The fundamental picture for the EURUSD pair remains favourable. Despite a short-term decline to the 1.19 level, the euro is still hovering not far from the June 2021 highs that were reached earlier this week. The currency came under pressure from a stronger US dollar after the US Treasury Secretary’s comments lowered expectations of US intervention in the currency markets.
In Europe, a member of the ECB’s Governing Council warned that further strengthening in EURUSD could push the regulator to resume rate cuts. The European Central Bank will decide on monetary policy next week, and rates are expected to remain unchanged.
EURUSD technical analysis
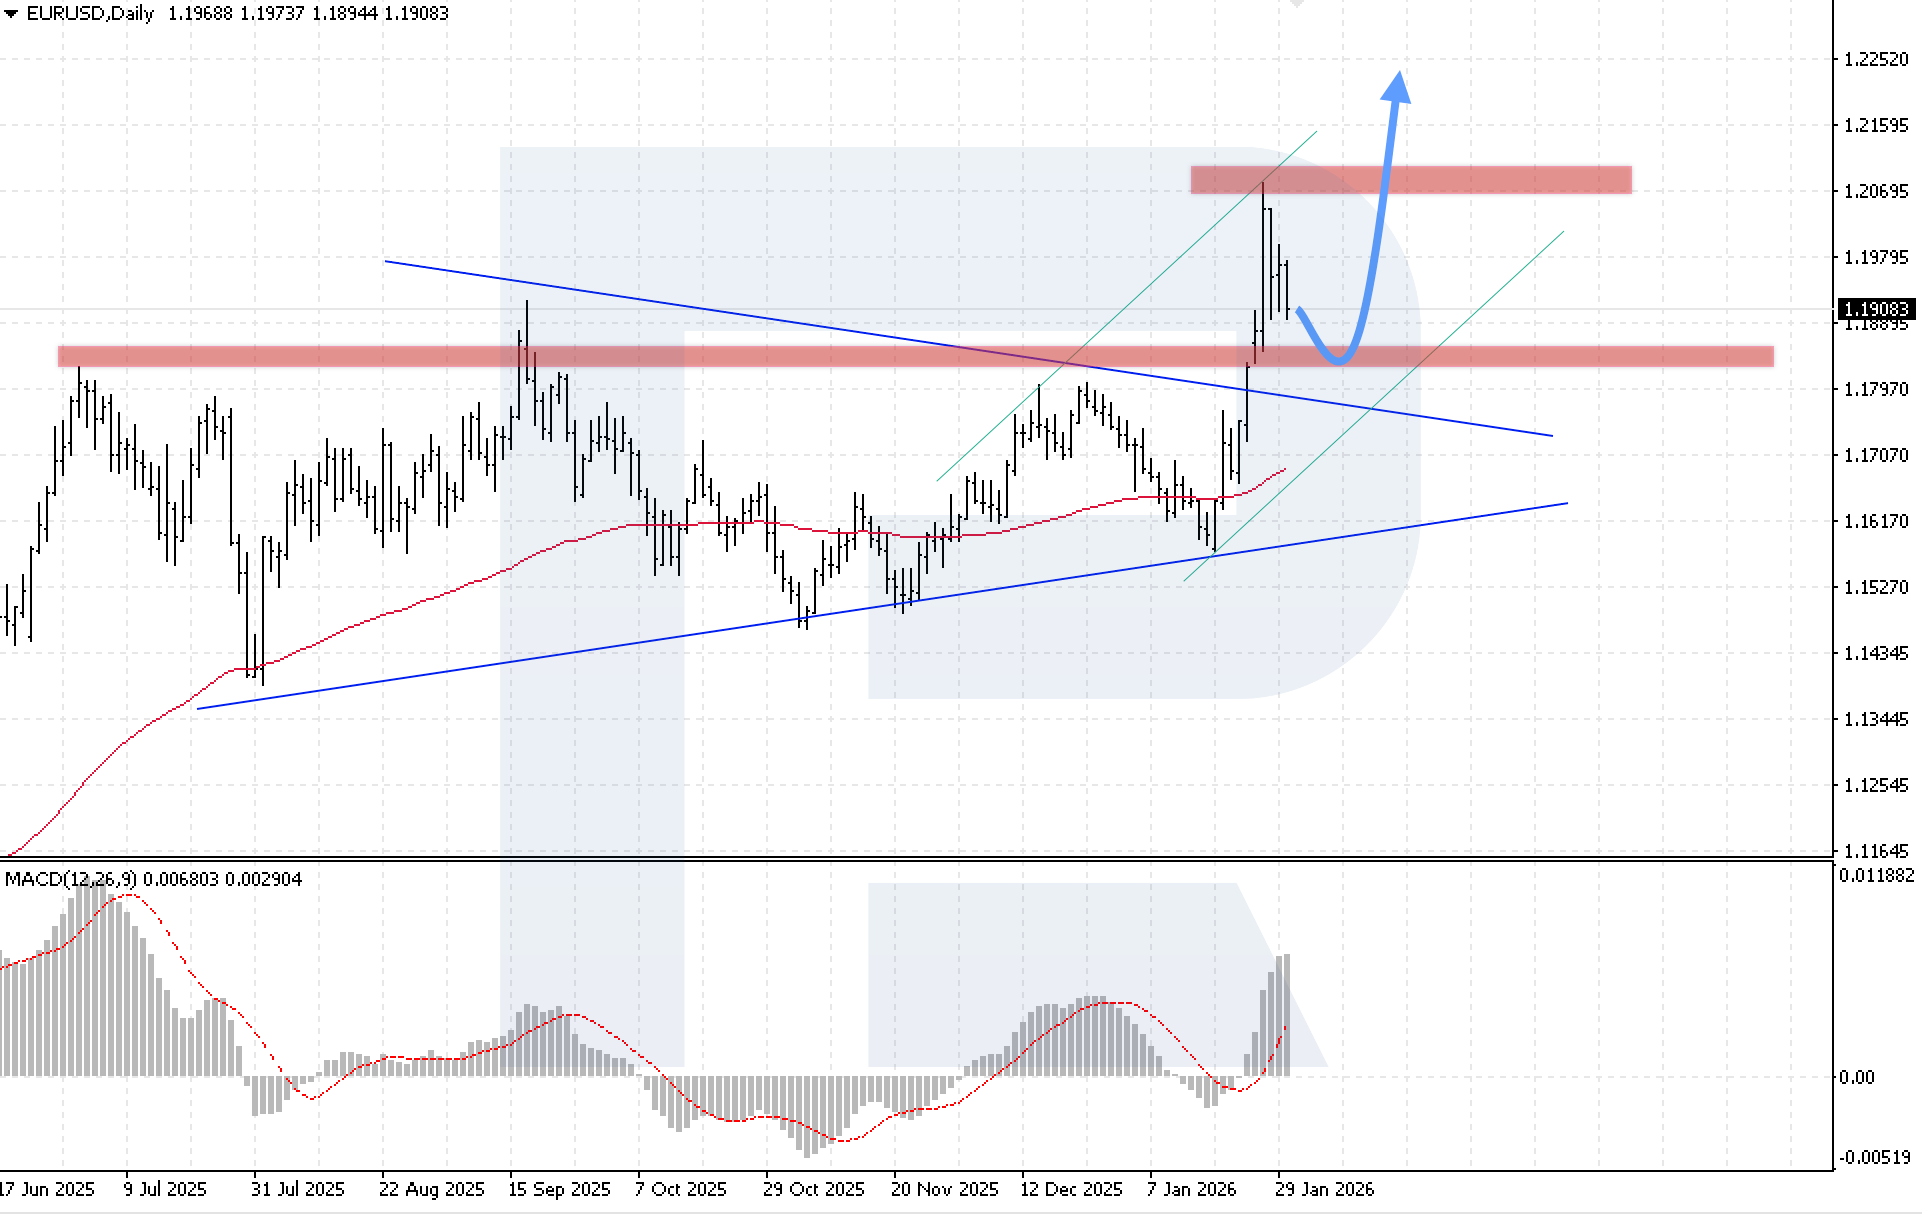
On the daily EURUSD chart, the market confidently broke above the upper boundary of the Triangle pattern, which may signal long-term growth in the currency pair. Within the current structure, the upward move could continue towards 1.2255 as part of the pattern’s completion after a rebound from the key support level at 1.1845.
MACD analysis confirms this scenario: the histogram is rising confidently, with only a slight slowdown at the top, reflecting a consolidation phase. A key condition for the bullish scenario to play out this trading week will be a firm consolidation above the nearest resistance level at 1.1995.
An alternative scenario becomes relevant if the market breaks below 1.1715. This would open the potential for a further decline towards 1.1615, where the lower boundary of the Triangle pattern is located.
EURUSD forecast scenarios
Bearish scenario (baseline): continued growth within the bullish trend towards 1.2255
Bullish scenario (alternative): if the price breaks below the 1.1715 support level, a correction may develop, with a target at 1.1615.
USDJPY forecast
The USDJPY pair has been falling for the second consecutive trading week. On Friday, the rate underwent a correction but remained below the key resistance level at 154.75. The pair came under pressure amid speculation about possible intervention by regulators, although central bank data indicates there were no official actions by the authorities.
Nevertheless, traders remain cautious about the possibility of unilateral intervention by Japanese authorities. The US Treasury Secretary also denied rumours of coordinated intervention.
On the economic side, Japan’s retail sales in December unexpectedly fell by 0.9% year-on-year, while industrial production declined by just 0.1% and came in below forecasts, having a moderate impact on market sentiment.
USDJPY technical analysis
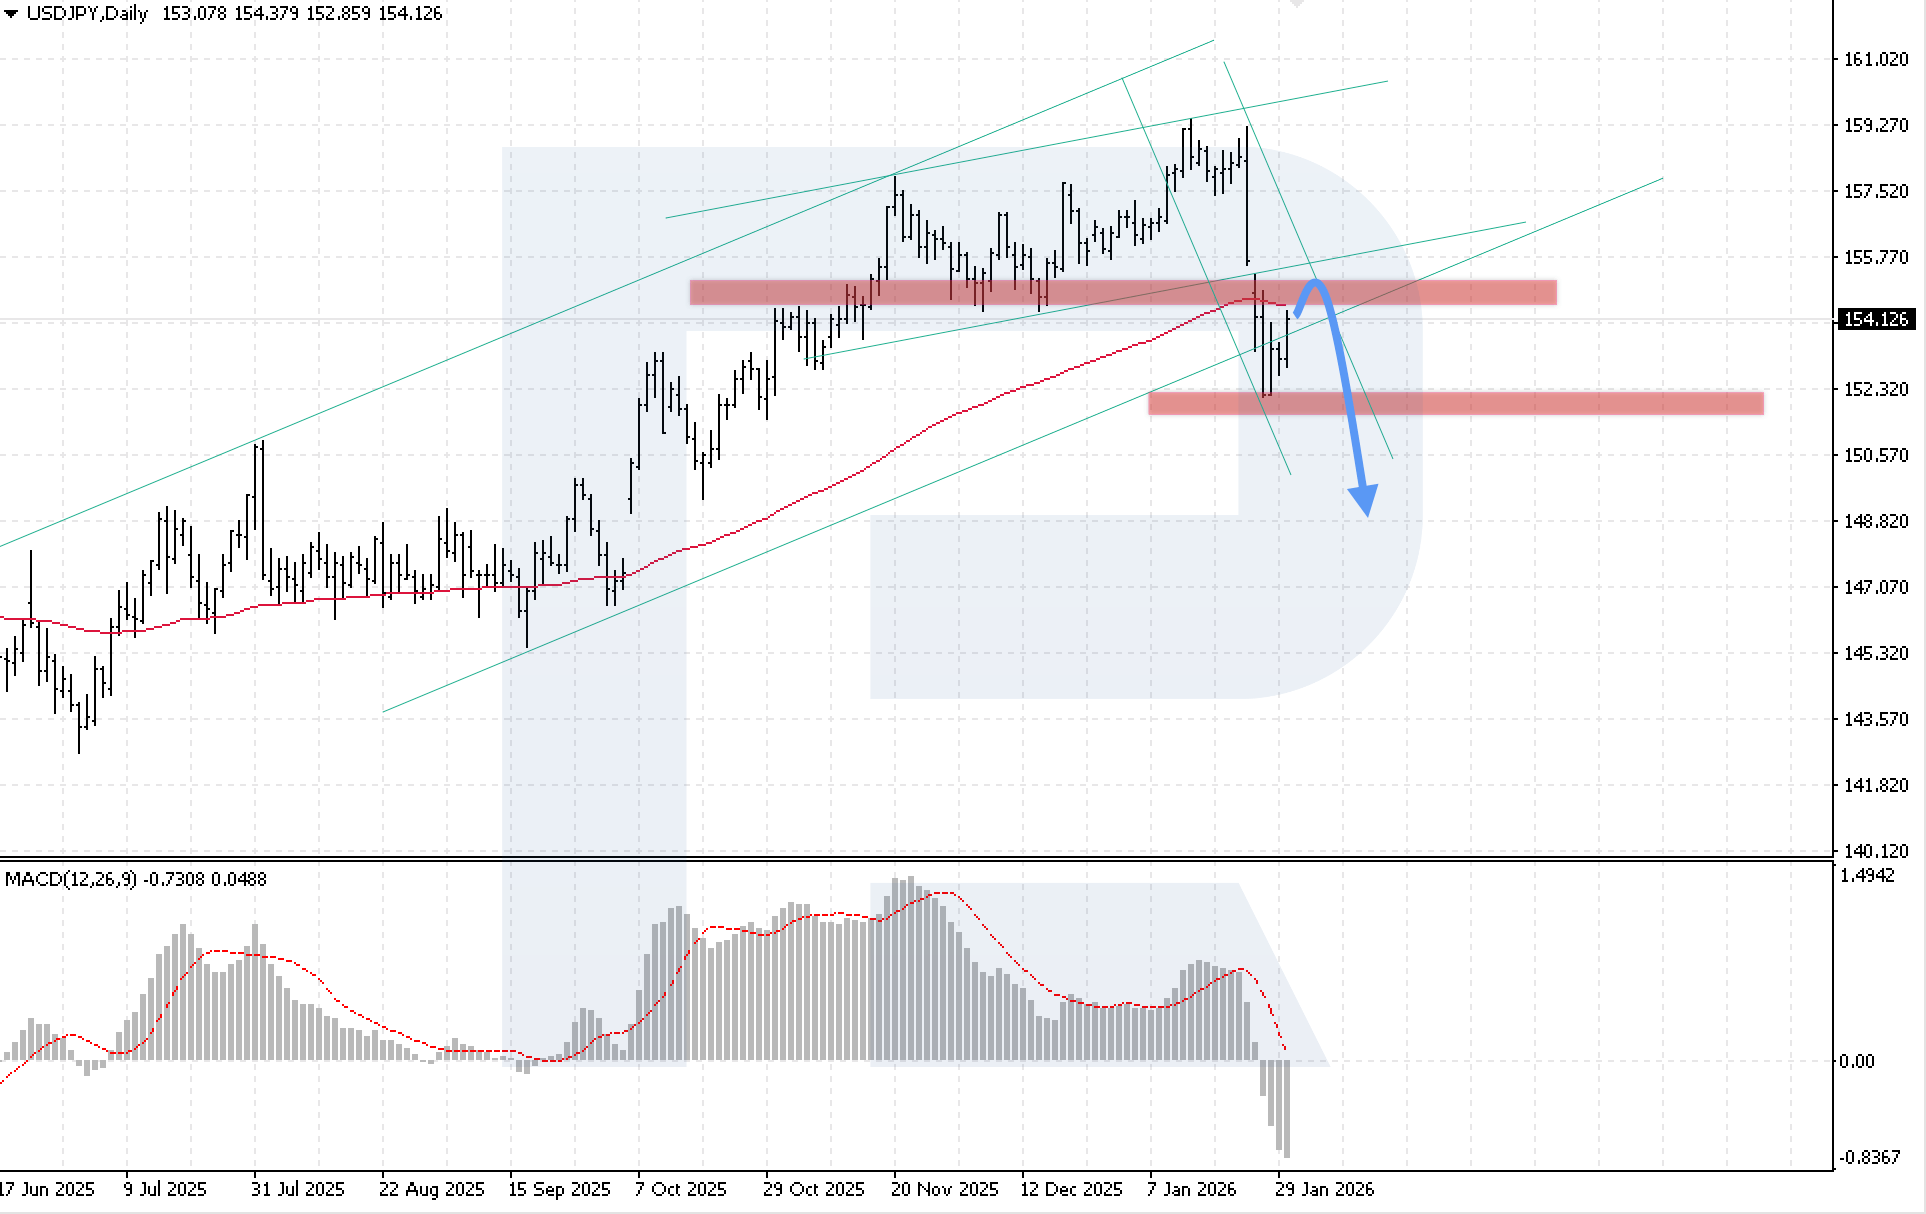
On the daily USDJPY chart, the market confidently broke below the lower boundary of the long-term bullish channel. At the start of the trading week, there remains potential for a bullish correction with a test of the 154.75 resistance level, after which the decline is expected to continue, with a potential target at 148.85.
MACD analysis confirms the bearish scenario for the USDJPY pair: the histogram is falling aggressively after crossing the zero line, indicating strong bearish momentum. A key condition for the downside scenario to play out this week will be price consolidation below the 152.15 support level.
An alternative scenario becomes relevant if the market breaks above 155.65. This would signal a return to the bullish channel and further growth, with potential for movement towards 157.75.
USDJPY forecast scenarios
Bearish scenario (baseline): a rebound from the 154.75 resistance level will open the door for bearish momentum after the current correction, with a target at 148.85.
Bullish scenario (alternative): if quotes rise sharply at the start of the trading week and break above 155.65, the probability of a bullish correction will increase, with a target at 157.75.
GBPUSD forecast
The GBPUSD rate declined after testing the key resistance level at 1.3805. However, despite the bearish correction, the pair maintains its bullish momentum. The US dollar continued to weaken after the Fed’s decision to leave rates unchanged and signals from President Donald Trump that the administration is comfortable with a weak dollar.
In the UK, fresh BRC data showed faster price growth: in January, shop prices rose by 1.5% compared to the same period a year earlier. This is fuelling concerns about persistent inflation and may limit the BoE’s ability to cut interest rates. Fish, meat, and fruit prices are rising the fastest, while household goods and cosmetics are increasing more slowly.
Federal Reserve Chairman Jerome Powell noted a clear improvement in the US economic outlook and said the labour market is showing signs of stabilisation. Nevertheless, these comments did not provide significant support to the US dollar amid concerns about a government shutdown, weak consumer confidence, and persistent political uncertainty.
GBPUSD technical analysis
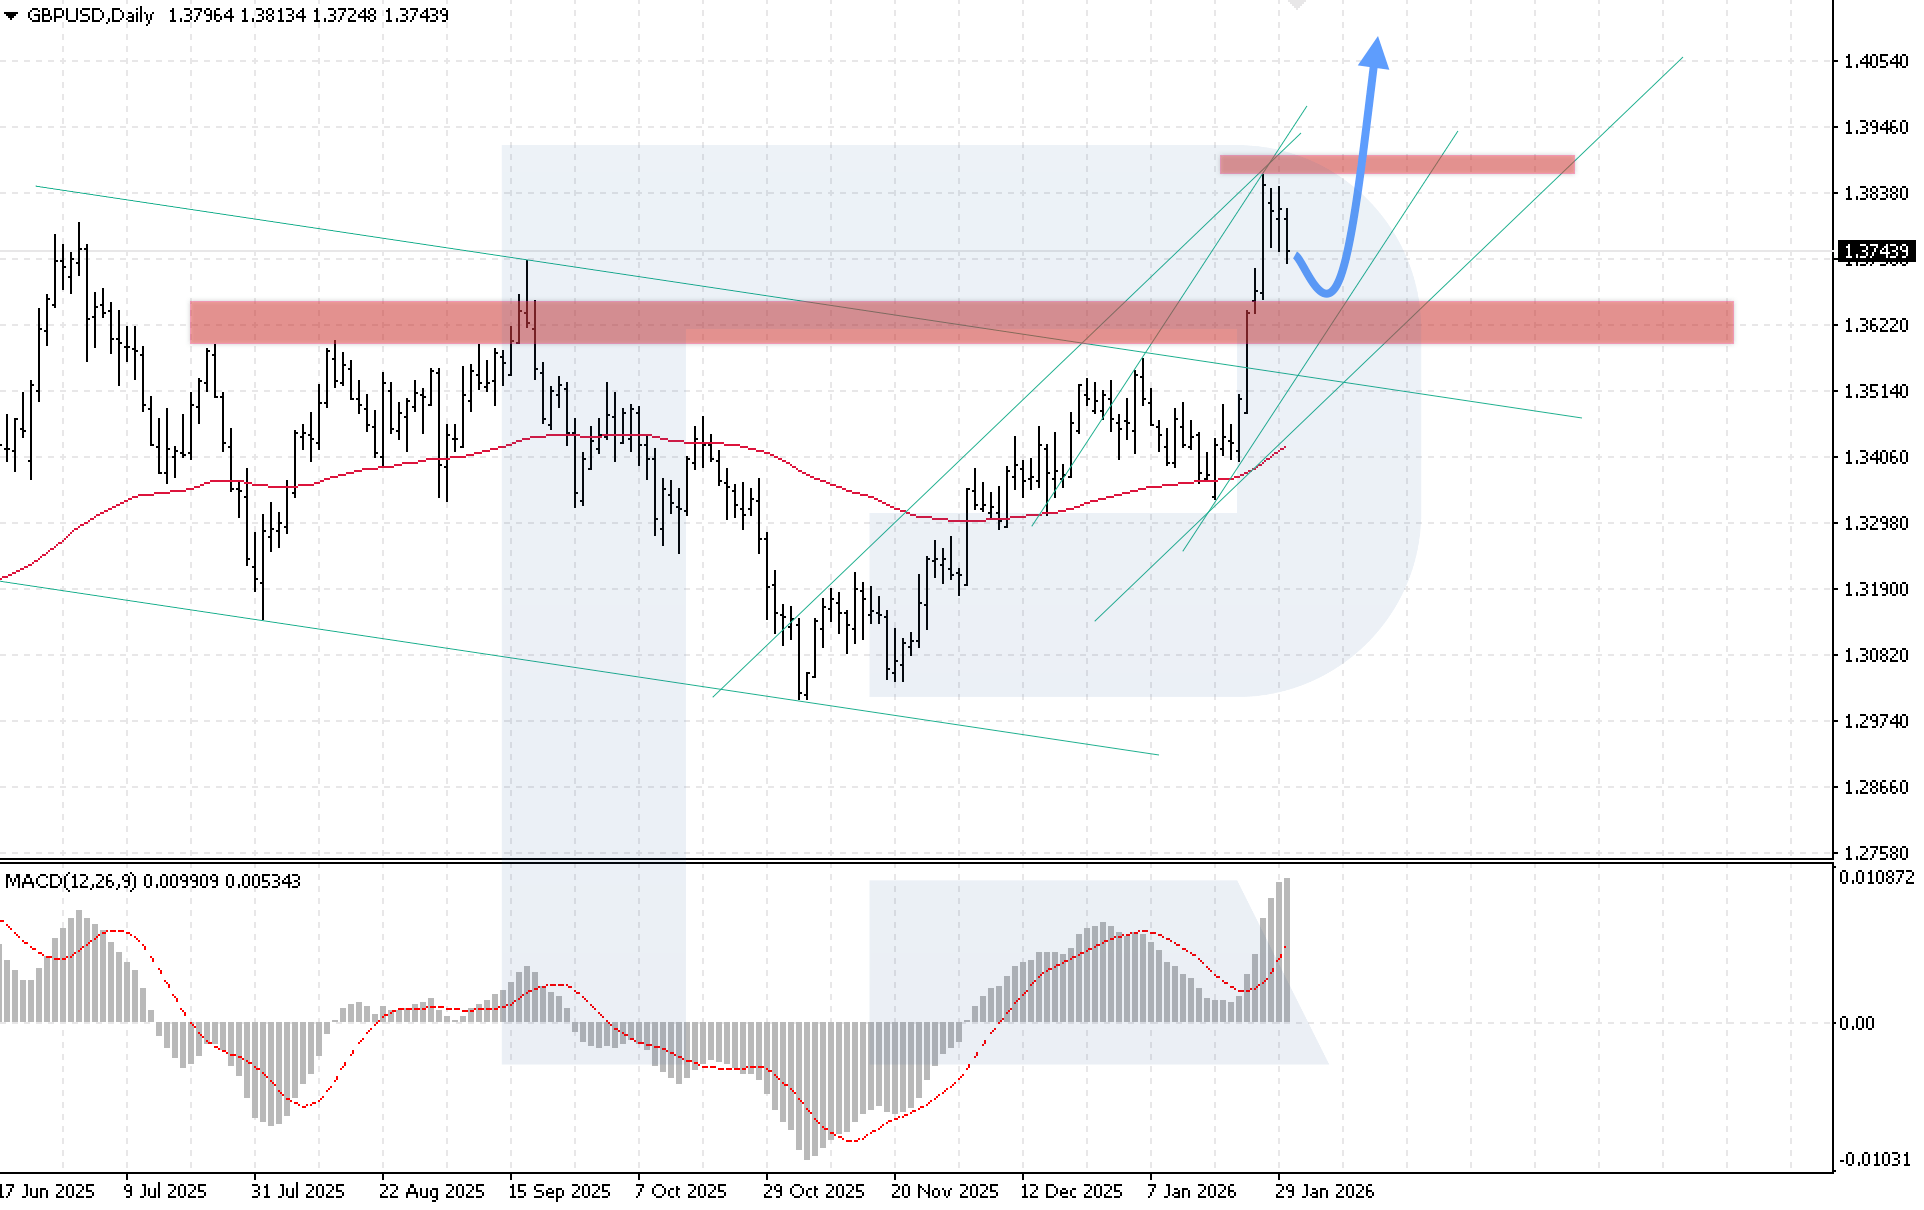
On the daily GBPUSD chart, the market is undergoing a correction but remains within an ascending channel. The key support level is located at 1.3625. At the start of the trading week, there remains potential for quotes to decline towards the lower boundary of the bullish channel, after which the uptrend is expected to continue towards the target of 1.4065.
MACD analysis confirms the bullish scenario: the histogram is rising actively, and buyers have managed to overcome the bearish divergence on the indicator, which points to bullish strength. A key condition for the upside scenario to play out this week will be price consolidation above 1.3845.
An alternative scenario becomes relevant if the pair breaks below the key support level at 1.3625, signalling consolidation below the channel’s lower boundary and potentially leading to a decline towards the EMA-85 line.
GBPUSD forecast scenarios
Bullish scenario (baseline): if the price confidently rebounds from the key support level at 1.3625, the upward structure is expected to continue towards the target of1.4065.
Bearish scenario (alternative): a sharp drop below 1.3585 will cancel the GBPUSD rally scenario for this trading week and trigger a deeper correction.
AUDUSD forecast
The AUDUSD pair posted aggressive gains last week. Buyers managed to break above the upper boundary of the ascending channel, indicating bullish pressure. The Australian dollar continues to receive support amid rising expectations of a key rate hike in Australia later in the week. Markets estimate the likelihood of a 25-basis-point hike at around 70%.
The RBA will hold its meeting on Tuesday. The country’s largest banks forecast a rate increase to 3.85%, although there is still some uncertainty about whether the decision will be unanimous. Part of this hike may already be priced in, which helps explain the strong upside momentum in the pair last week.
If the regulator does raise rates, it will become one of the few central banks in developed countries that are increasing rates, which could provide an additional boost for further AUDUSD gains.
AUDUSD technical analysis
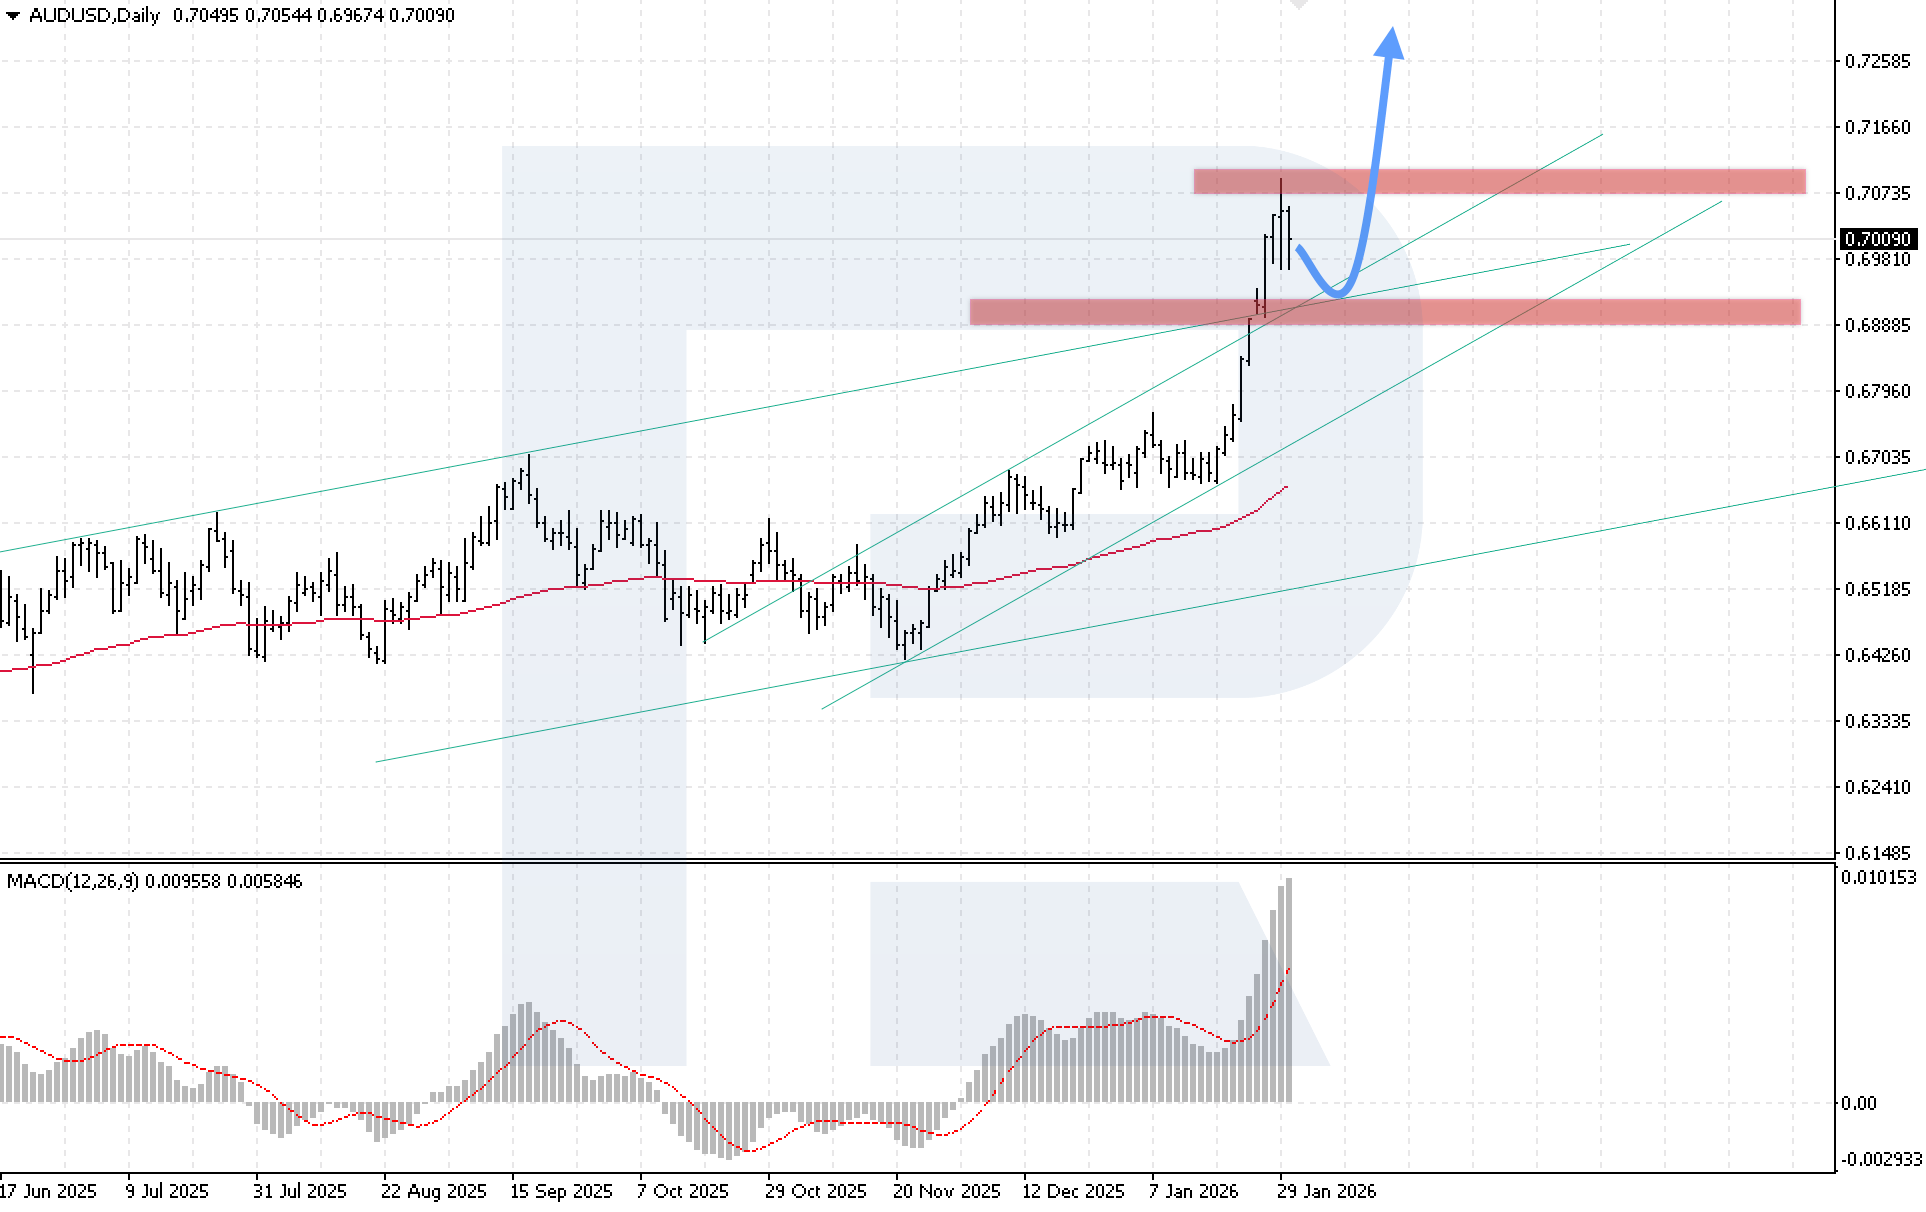
On the daily AUDUSD chart, quotes stalled ahead of the key resistance level at 0.7075. The nearest support is at 0.6900, where the upper boundaries of two ascending channels converge. At the start of the trading week, there remains potential for a minor correction with a test of this level, after which the bullish momentum is expected to continue, targeting 0.7265.
MACD analysis confirms the bullish scenario: the histogram is rising actively, and bulls have managed to neutralise the formation of a bearish divergence, indicating the strength of the current AUDUSD trend. A key condition for the bullish scenario to play out this week will be price consolidation above 0.7105.
An alternative scenario will come into play if the 0.6875 support is broken. This would signal consolidation below the lower boundary of the bullish channel and could lead to a decline towards 0.6705.
Text 12
Bullish scenario (baseline): holding above 0.6900 will enable further growth towards 0.7265, which is especially relevant amid rising expectations of an RBA rate hike.
Bearish scenario (alternative): a breakout of the key support level and consolidation below 0.6875 will open the potential for a bearish correction.
USDCAD forecast
The USDCAD pair fell below 1.3500 last week, allowing the Canadian dollar to reach a 171-week high. The pair came under pressure amid the market’s reaction to the latest Bank of Canada decision and its monetary policy outlook.
Despite the ongoing impact of US tariffs and trade uncertainty, which constrain Canada’s economy, analysts expect moderate GDP growth. Additional pressure on the US dollar came from its general weakening, while speculation about possible coordinated actions by the US and Japan to support the yen only worsened the US currency’s position.
USDCAD technical analysis
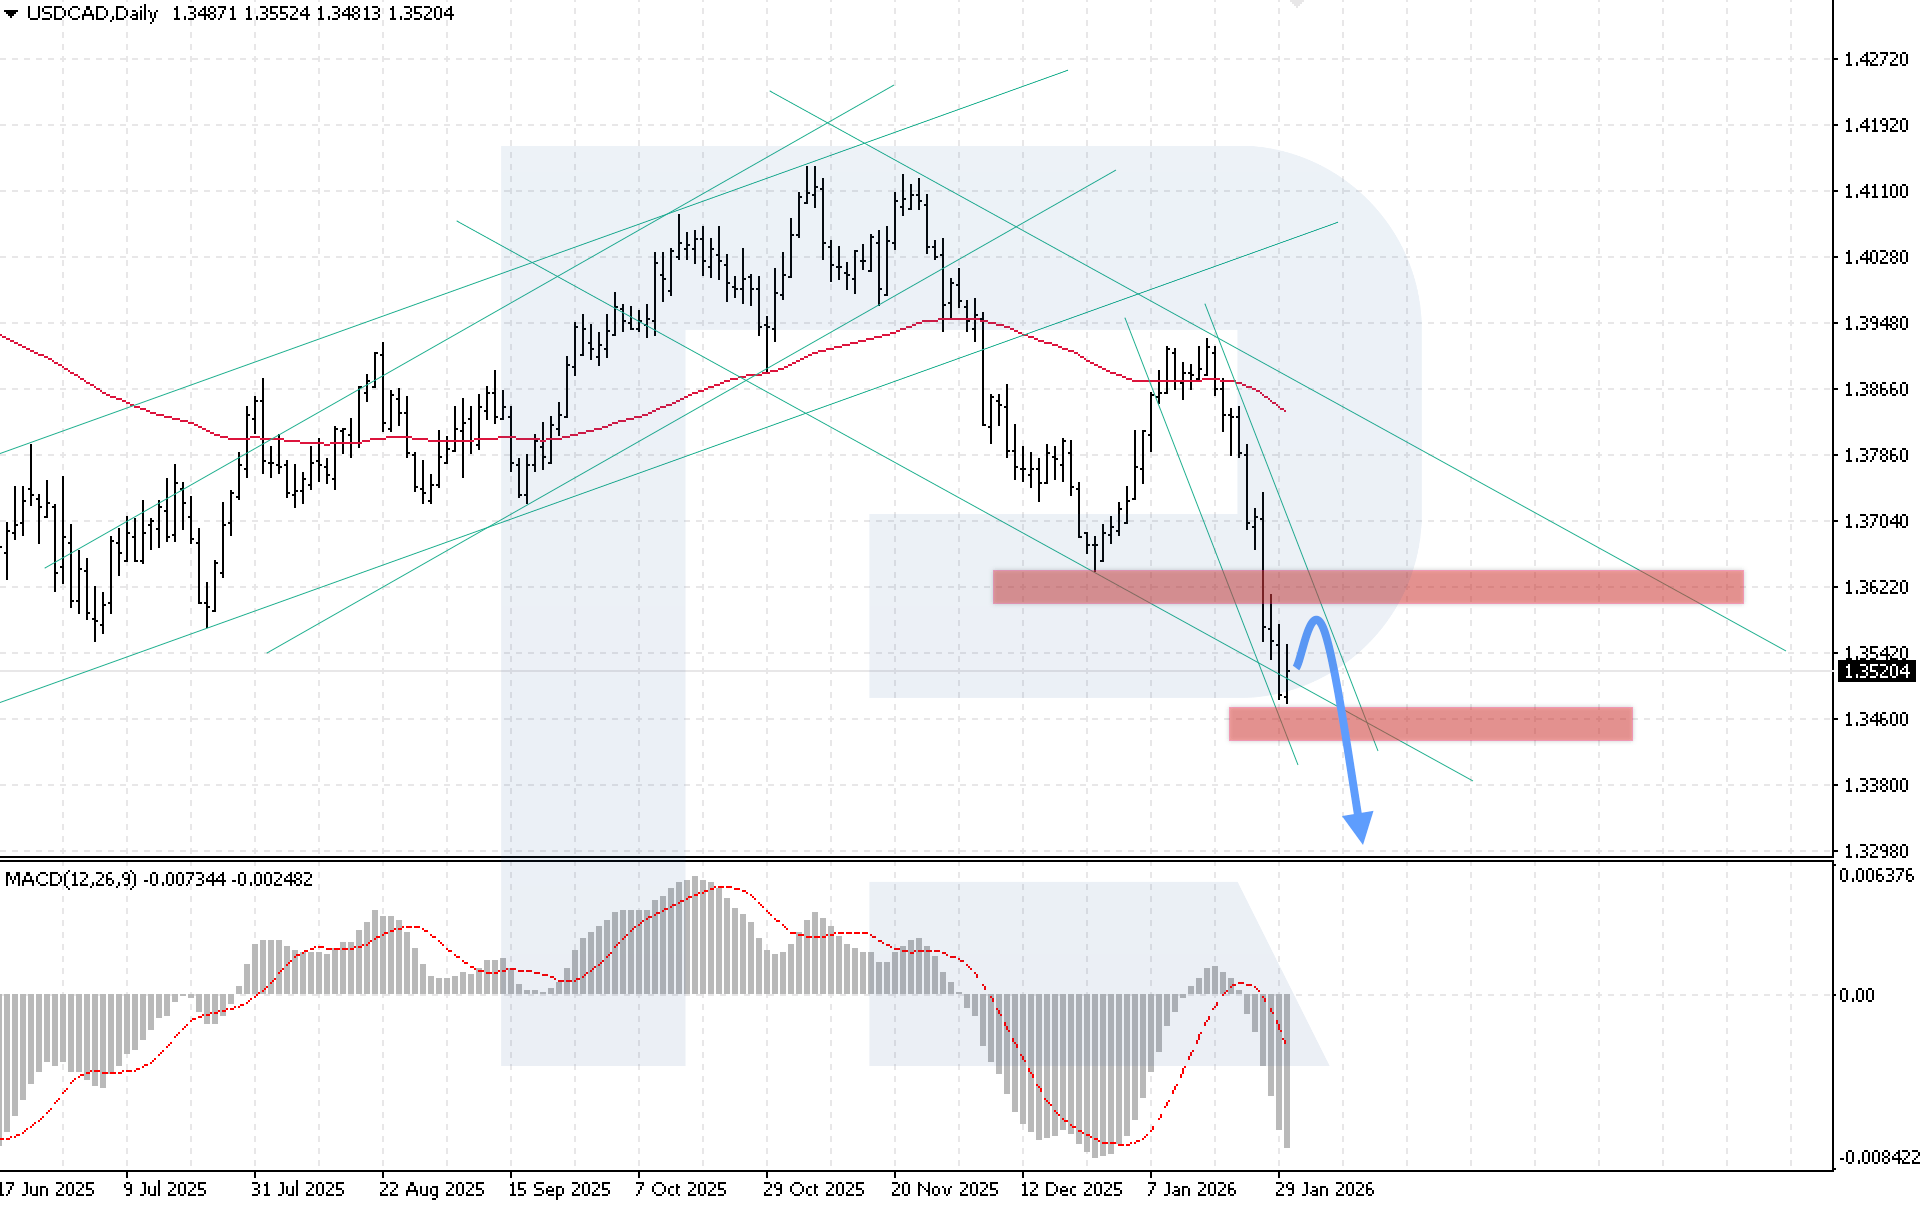
On the daily USDCAD chart, the price found support at the lower boundary of the descending channel. Buyers are still holding the rate above 1.3465. The nearest resistance level is at 1.3625, where the upper boundary of the bearish channel lies. At the start of the trading week, a rebound from this level is expected, followed by a continued decline towards 1.3295.
MACD analysis confirms that the downward momentum remains: the histogram is falling aggressively after crossing the zero line, and sellers’ attempts to consolidate below the lower boundary of the bearish channel indicate increasing bearish pressure. A key condition for the downside scenario to play out this week will be price consolidation below 1.3455.
An alternative scenario becomes relevant if the 1.3625 resistance level is broken. This would signal a return to the bullish channel and could push the rate higher towards 1.3705.
USDCAD forecast scenarios
Bearish scenario (baseline): if bearish pressure persists and quotes consolidate below 1.3455, a full-fledged downtrend is expected to resume, aiming for 1.3295.
Bullish scenario (alternative): if the price decisively breaks above the 1.3625 resistance level, the market will receive a signal for a bullish correction.
XAUUSD forecast
XAUUSD quotes fell by more than 9% on Friday, extending the correction after the previous trading session amid profit-taking. In just the last two days of last week, prices fell by more than 11%. However, near the 4,940 USD level, quotes found support from bulls, so it is still premature to talk about the end of the bullish trend.
The recent rally in gold was driven by high economic and geopolitical uncertainty as well as US dollar weakness. Geopolitical tensions remain high: President Trump urged Iran to negotiate on its nuclear program, while Tehran warned of a possible response – this creates conditions for a bullish momentum in XAUUSD to resume as early as the start of the trading week.
From a monetary policy perspective, Trump said he would announce a candidate for Fed chair on Friday, which also provides additional support for gold demand.
XAUUSD technical analysis
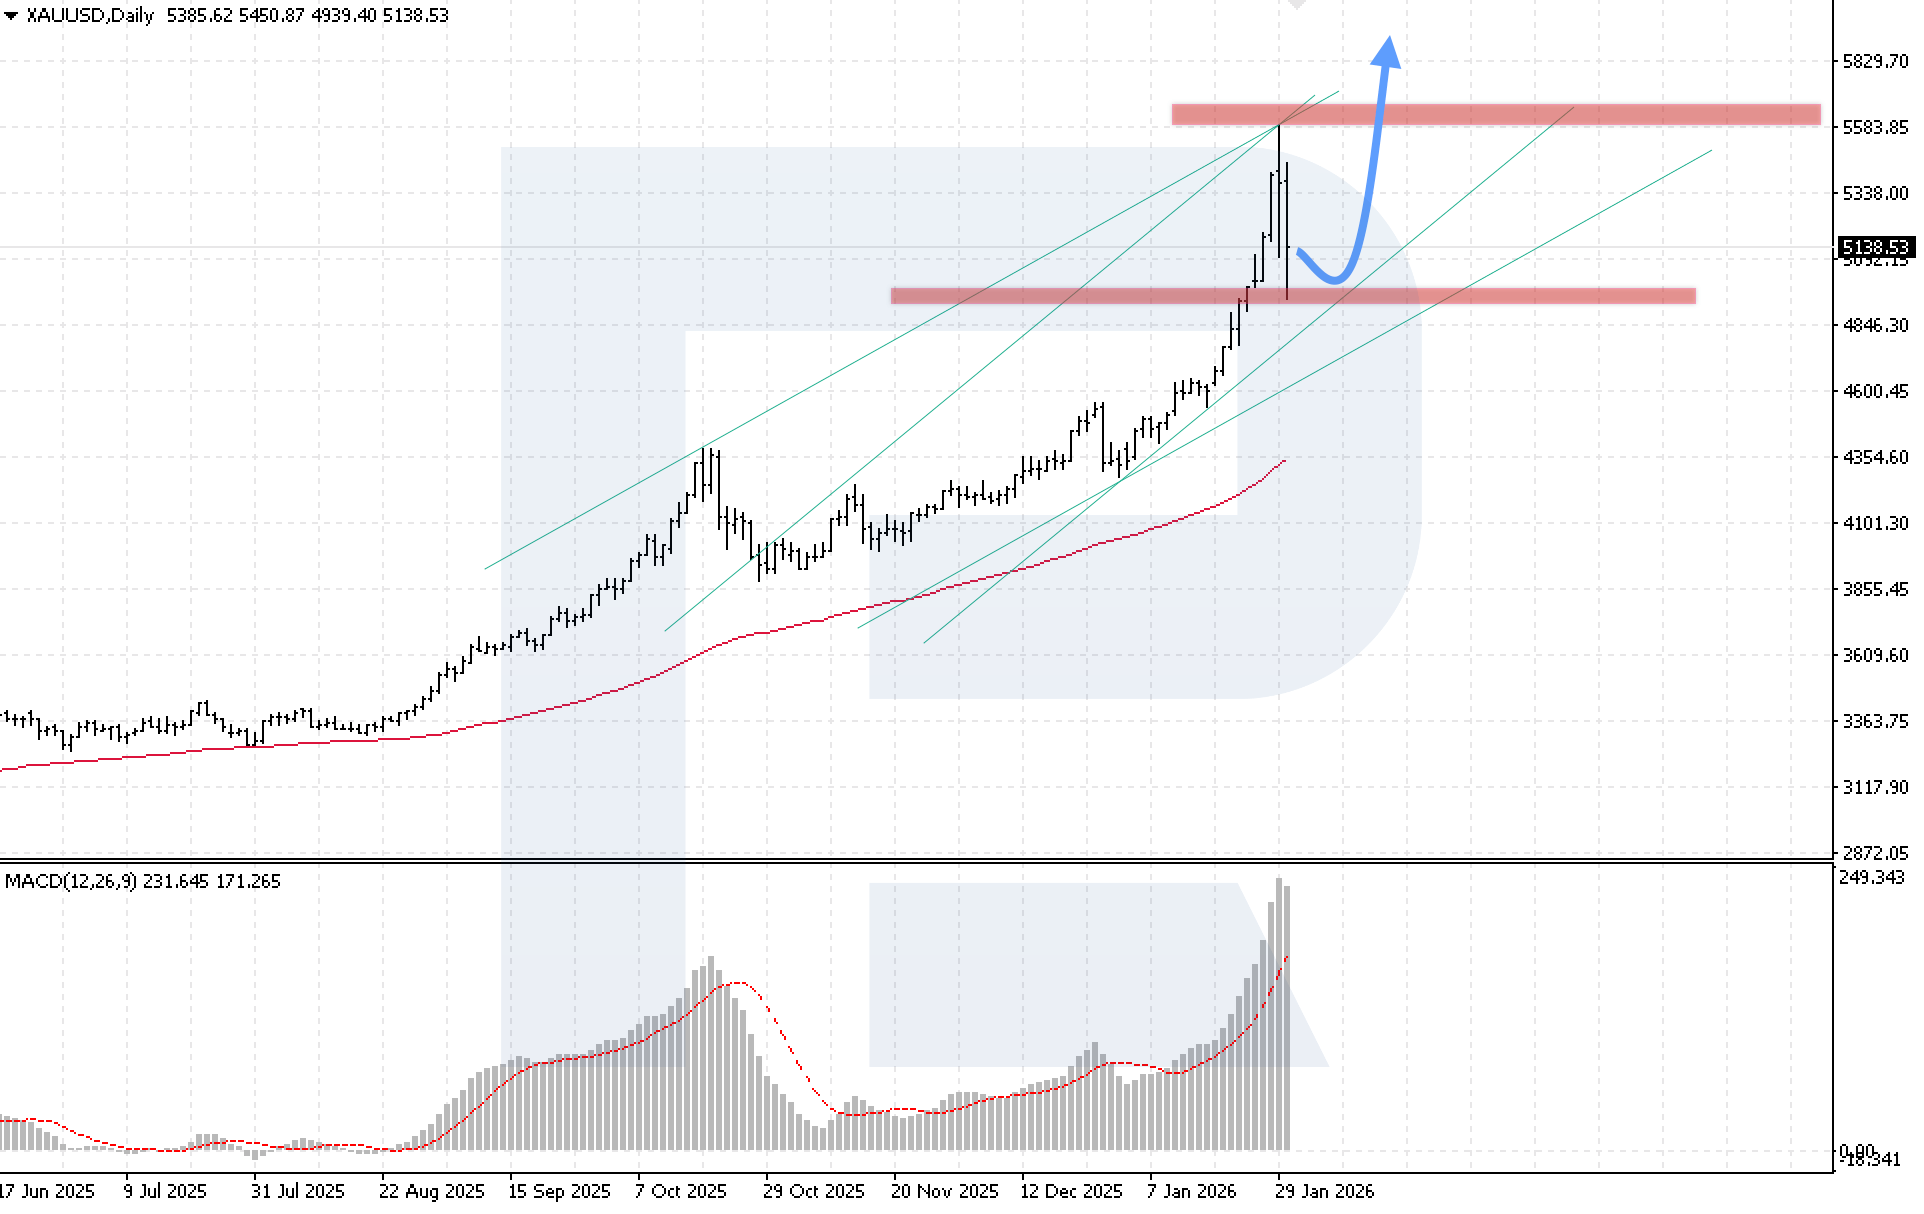
On the daily XAUUSD chart, a corrective wave has formed, but buyers are managing to contain selling pressure and keep prices within the bullish channel, preventing a full-scale sell-off. The key support level is at 4,935 USD. At the start of the trading week, prices are expected to rebound from the lower boundary of the channel and resume their upward momentum, targeting 5,885 USD.
MACD analysis confirms the uptrend remains in place despite the aggressive correction. The histogram has started to decline moderately after a prolonged rise over the last 18 trading sessions, indicating a slowdown rather than a trend reversal. A key condition for the bullish scenario to play out this week will be price consolidation above 5,245 USD.
The alternative scenario will become relevant if the 4,845 USD support level is broken. This would signal a breakout below the lower boundary of the long-term bullish channel and may trigger a deeper and more aggressive correction in the gold market.
XAUUSD forecast scenarios
Bullish scenario (baseline): a rebound from the lower boundary of the bullish channel, followed by upward momentum towards 5,885 USD, remains the priority.
Bearish scenario (alternative): if prices consolidate confidently below 4,845 USD, the current bullish structure will be broken, opening the way for a deeper corrective wave with the formation of a downward impulse.
Brent forecast
Brent crude showed resilience on Friday and continued to rise despite sellers’ attempts to trigger a corrective decline. The market is supported by an expanding geopolitical risk premium and ongoing global instability.
The key factor in tensions remains the worsening relationship between the US and Iran: President Donald Trump urged Tehran to negotiate on its nuclear program, while the Iranian side stated its readiness to take retaliatory measures. This heightens geopolitical risks and creates additional demand for safe-haven assets, including oil.
Additional support over the month came from geopolitical instability in Venezuela, production disruptions in Kazakhstan, and weather-related production shutdowns in the US. Together, these factors are keeping oil prices high and creating the preconditions for the downtrend to end, with the market transitioning into a sustained bullish momentum phase.
Brent technical analysis
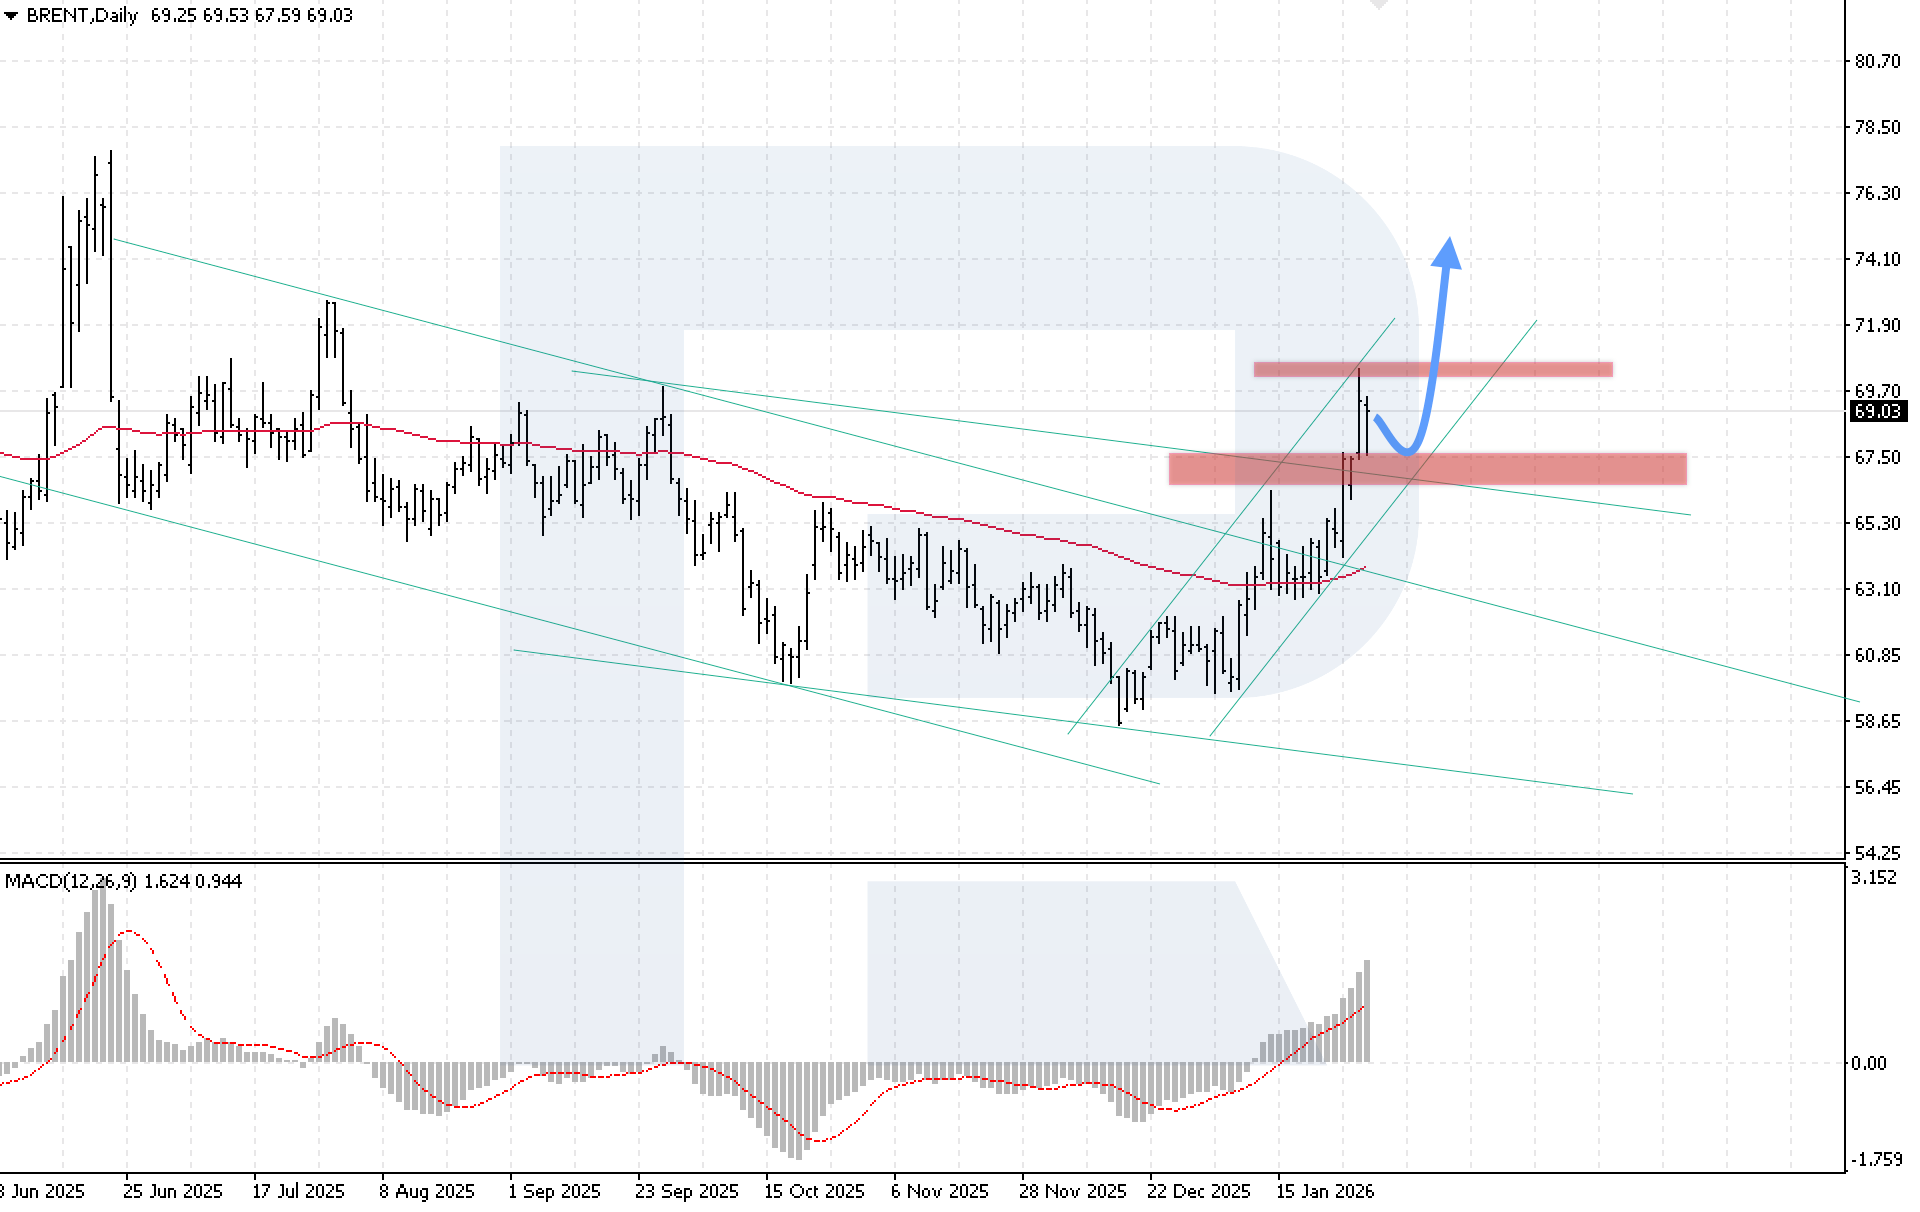
On the daily Brent chart, prices have moved outside the descending channel and received strong support in the 67.50 USD area, indicating the formation of a reversal structure. The nearest key resistance level is at 69.95 USD. At the start of the trading week, there remains potential for a moderate correction with a test of the lower boundary of the emerging bullish channel, after which growth is expected to resume, with a target in the 74.35 USD area.
The MACD indicator confirms the uptrend remains intact: the histogram has been rising confidently for six consecutive trading sessions, reflecting the strength of the current momentum and buyers’ dominance. A key condition for the bullish scenario to play out this week will be price consolidation above 69.95 USD.
The bearish scenario will become relevant if quotes break below the support level and consolidate below 65.25 USD. This would indicate a move below the lower boundary of the bullish channel and may trigger a deeper corrective wave.
Brent forecast scenarios
Bullish scenario (baseline): a breakout and consolidation above 69.95 USD would open the potential for continued growth towards 74.35 USD.
Bearish scenario (alternative): if selling pressure increases and the key 65.25 USD support level breaks, the decline may accelerate to new lows.
Editors’ picks
 EURUSD 2026-2027 forecast: key market trends and future predictions
This article provides the EURUSD forecast for 2026 and 2027 and highlights the main factors determining the direction of the pair’s movements. We will apply technical analysis, take into account the opinions of leading experts, large banks, and financial institutions, and study AI-based forecasts. This comprehensive insight into EURUSD predictions should help investors and traders make informed decisions.
 Gold (XAUUSD) forecast 2026 and beyond: expert insights, price predictions, and analysis
Dive deep into the Gold (XAUUSD) price outlook for 2026 and beyond, combining technical analysis, expert forecasts, and key macroeconomic factors. It explains the drivers behind gold’s recent surge, explores potential scenarios including a move toward 4,500 to 5,000 USD per ounce, and highlights why the metal remains a strong hedge during global uncertainty.
Forecasts presented in this section only reflect the author’s private opinion and should not be considered as guidance for trading. RoboForex bears no responsibility for trading results based on trading recommendations described in these analytical reviews.