Weekly technical analysis and forecast (16–20 February 2026)
This weekly technical analysis highlights the key chart patterns and levels for EURUSD, USDJPY, GBPUSD, AUDUSD, USDCAD, gold (XAUUSD), and Brent crude oil to forecast market moves for the upcoming week (16–20 February 2026).
Major technical levels to watch this week
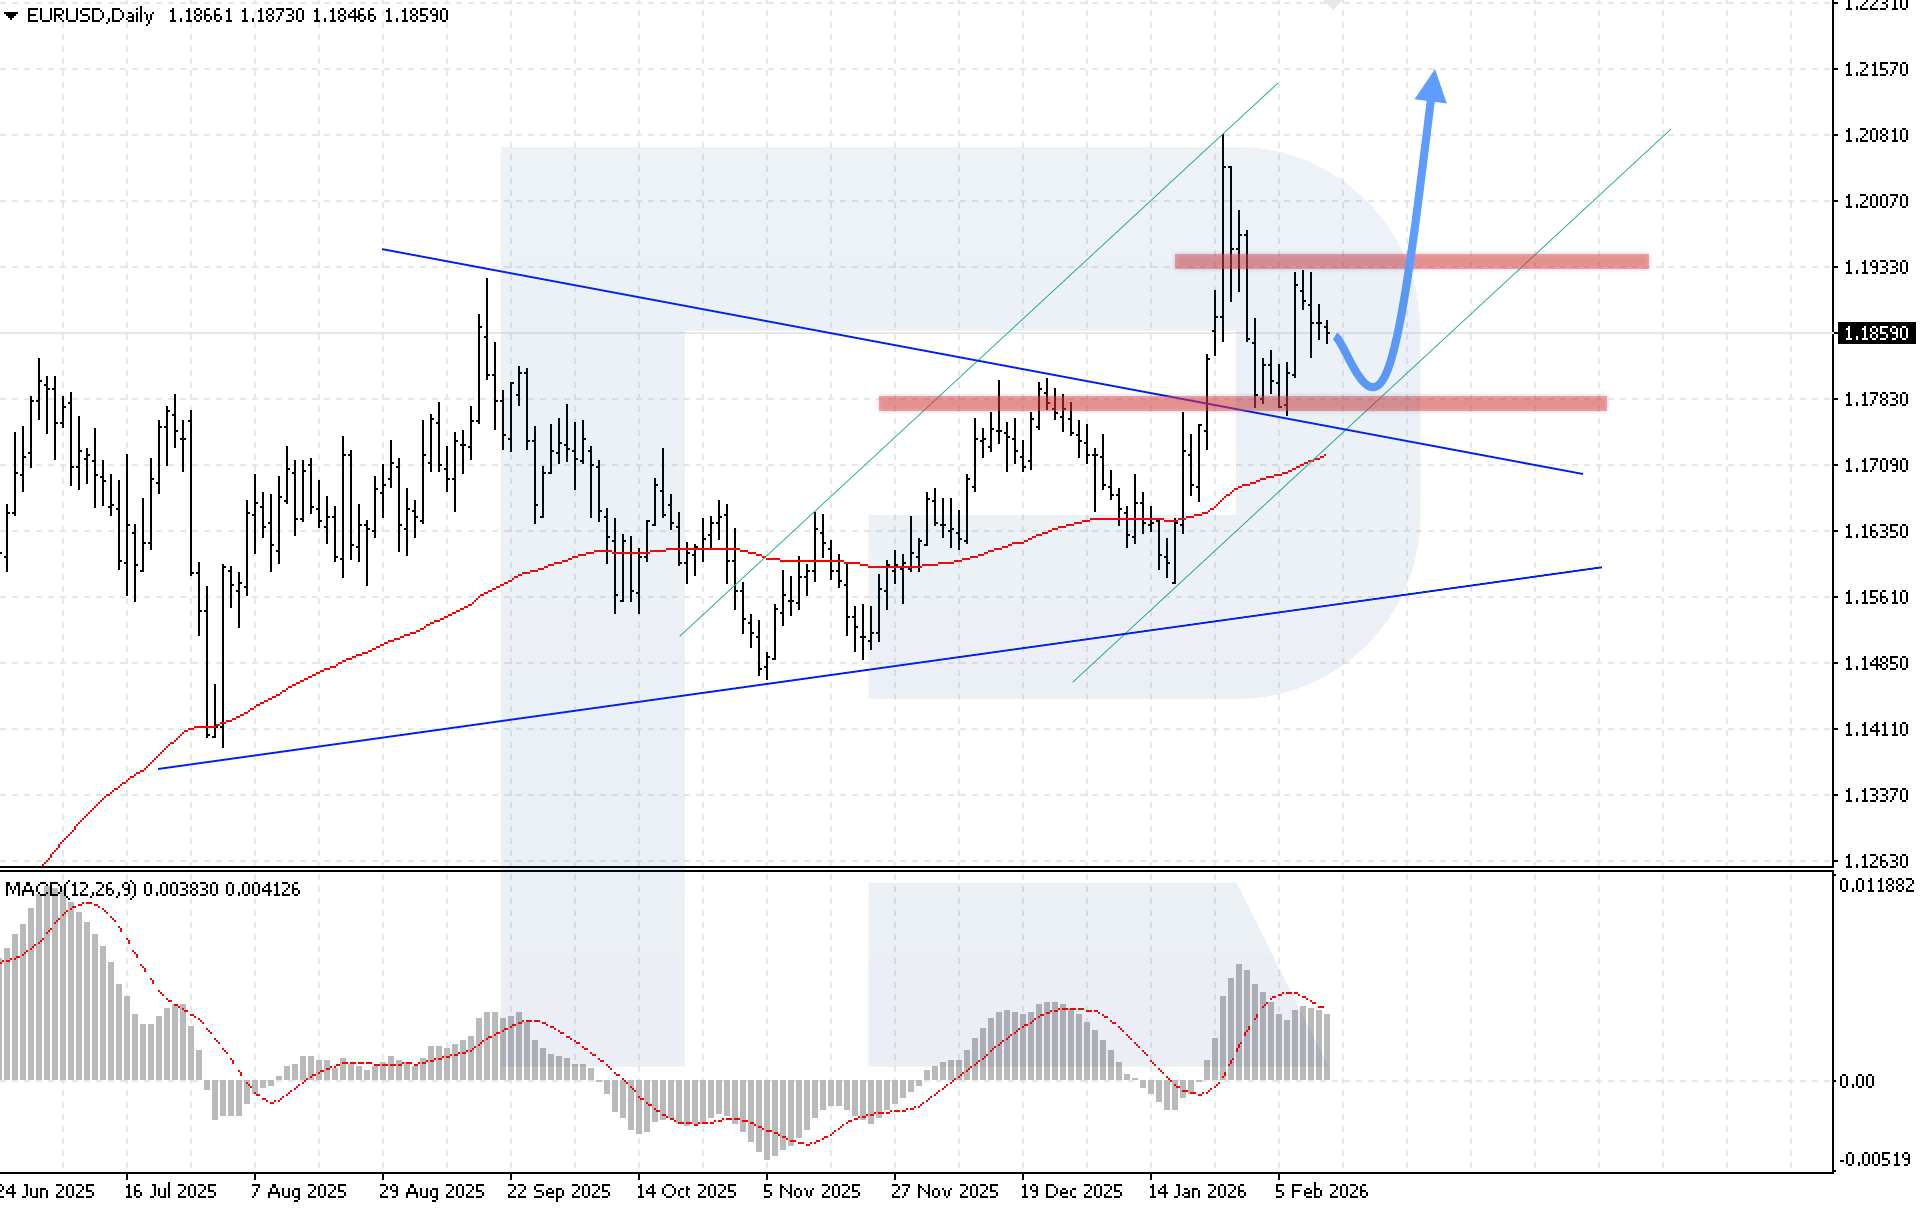
- EURUSD: Support: 1.1805, 1.1565. Resistance: 1.1945, 1.2080
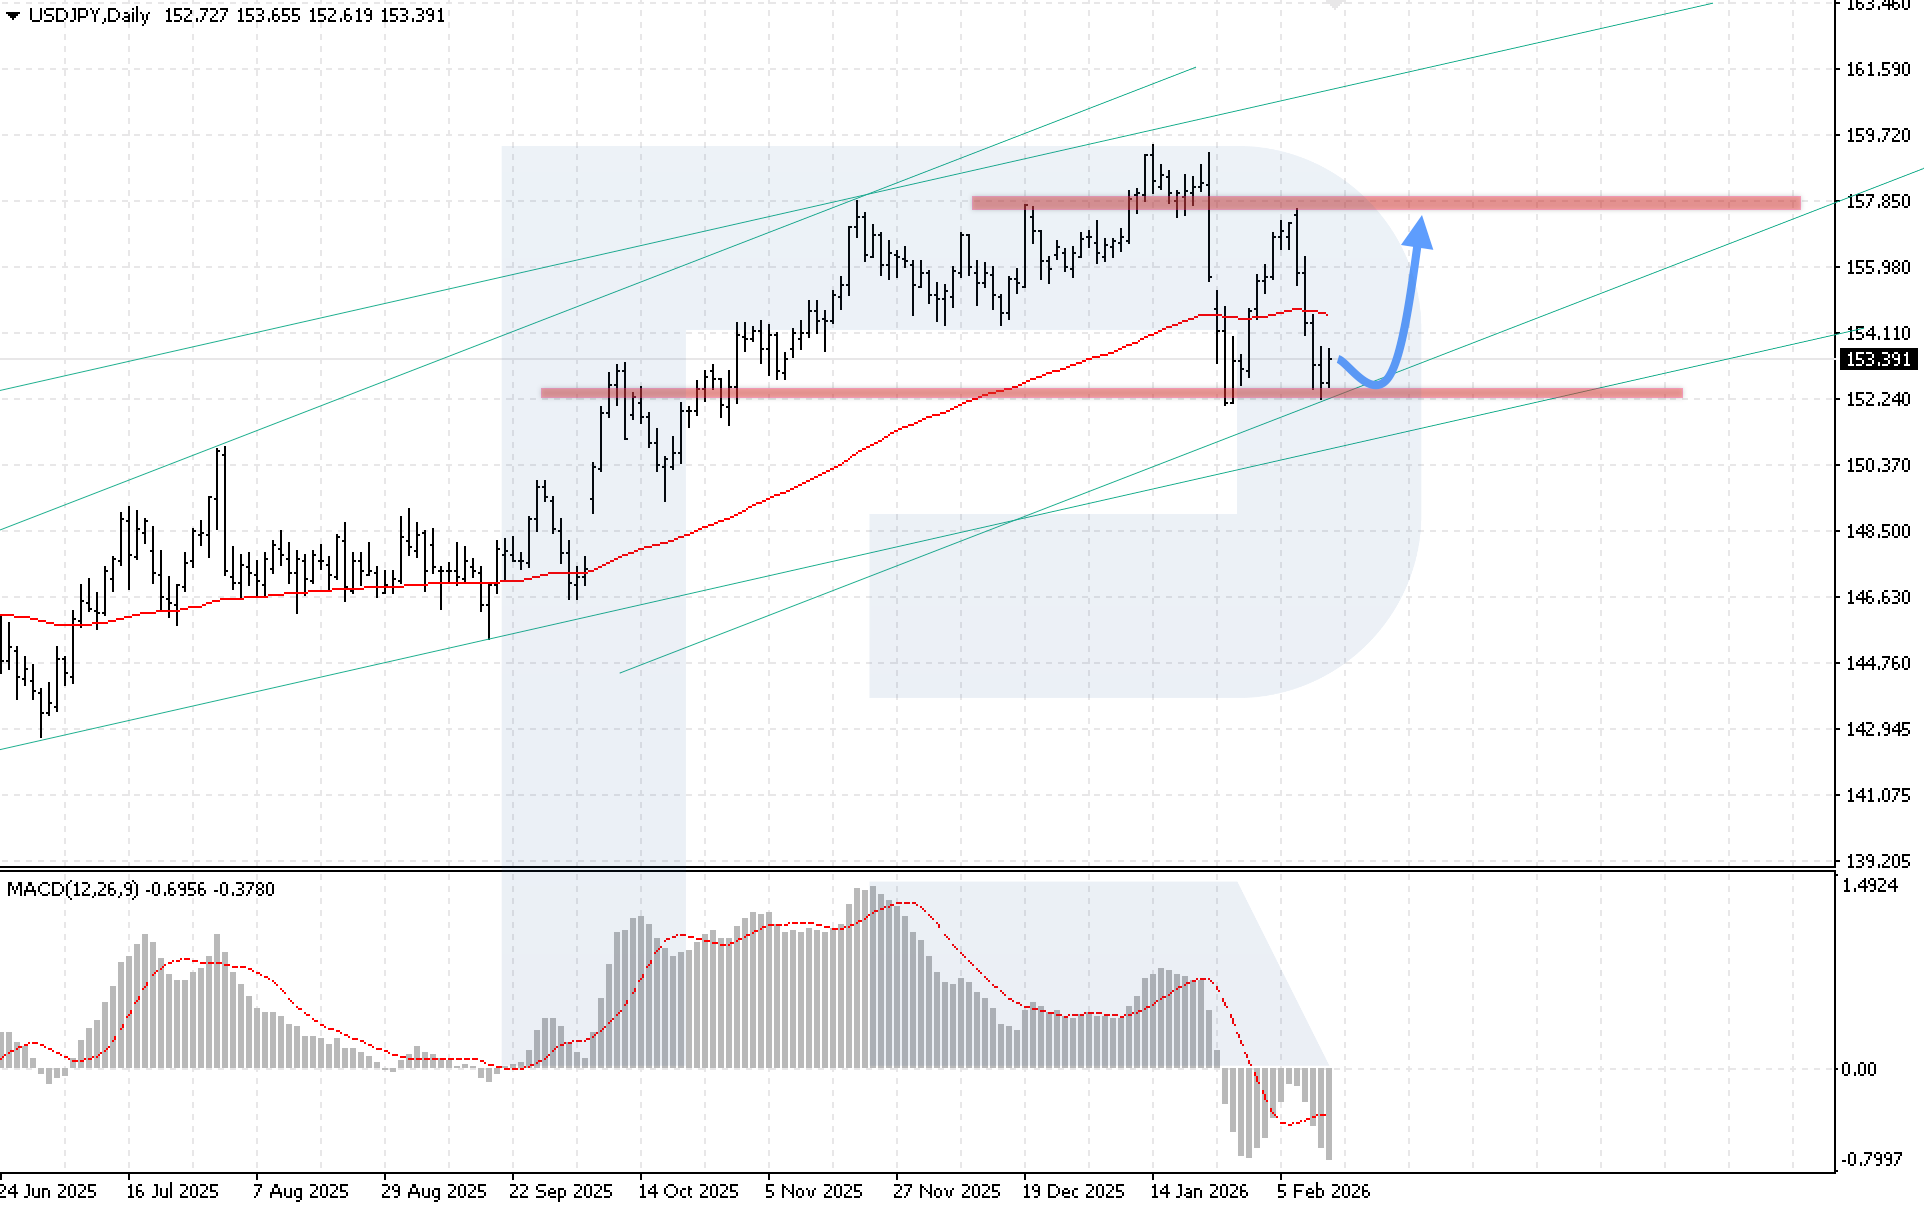
- USDJPY: Support: 152.25, 150.30. Resistance: 154.65, 157.85
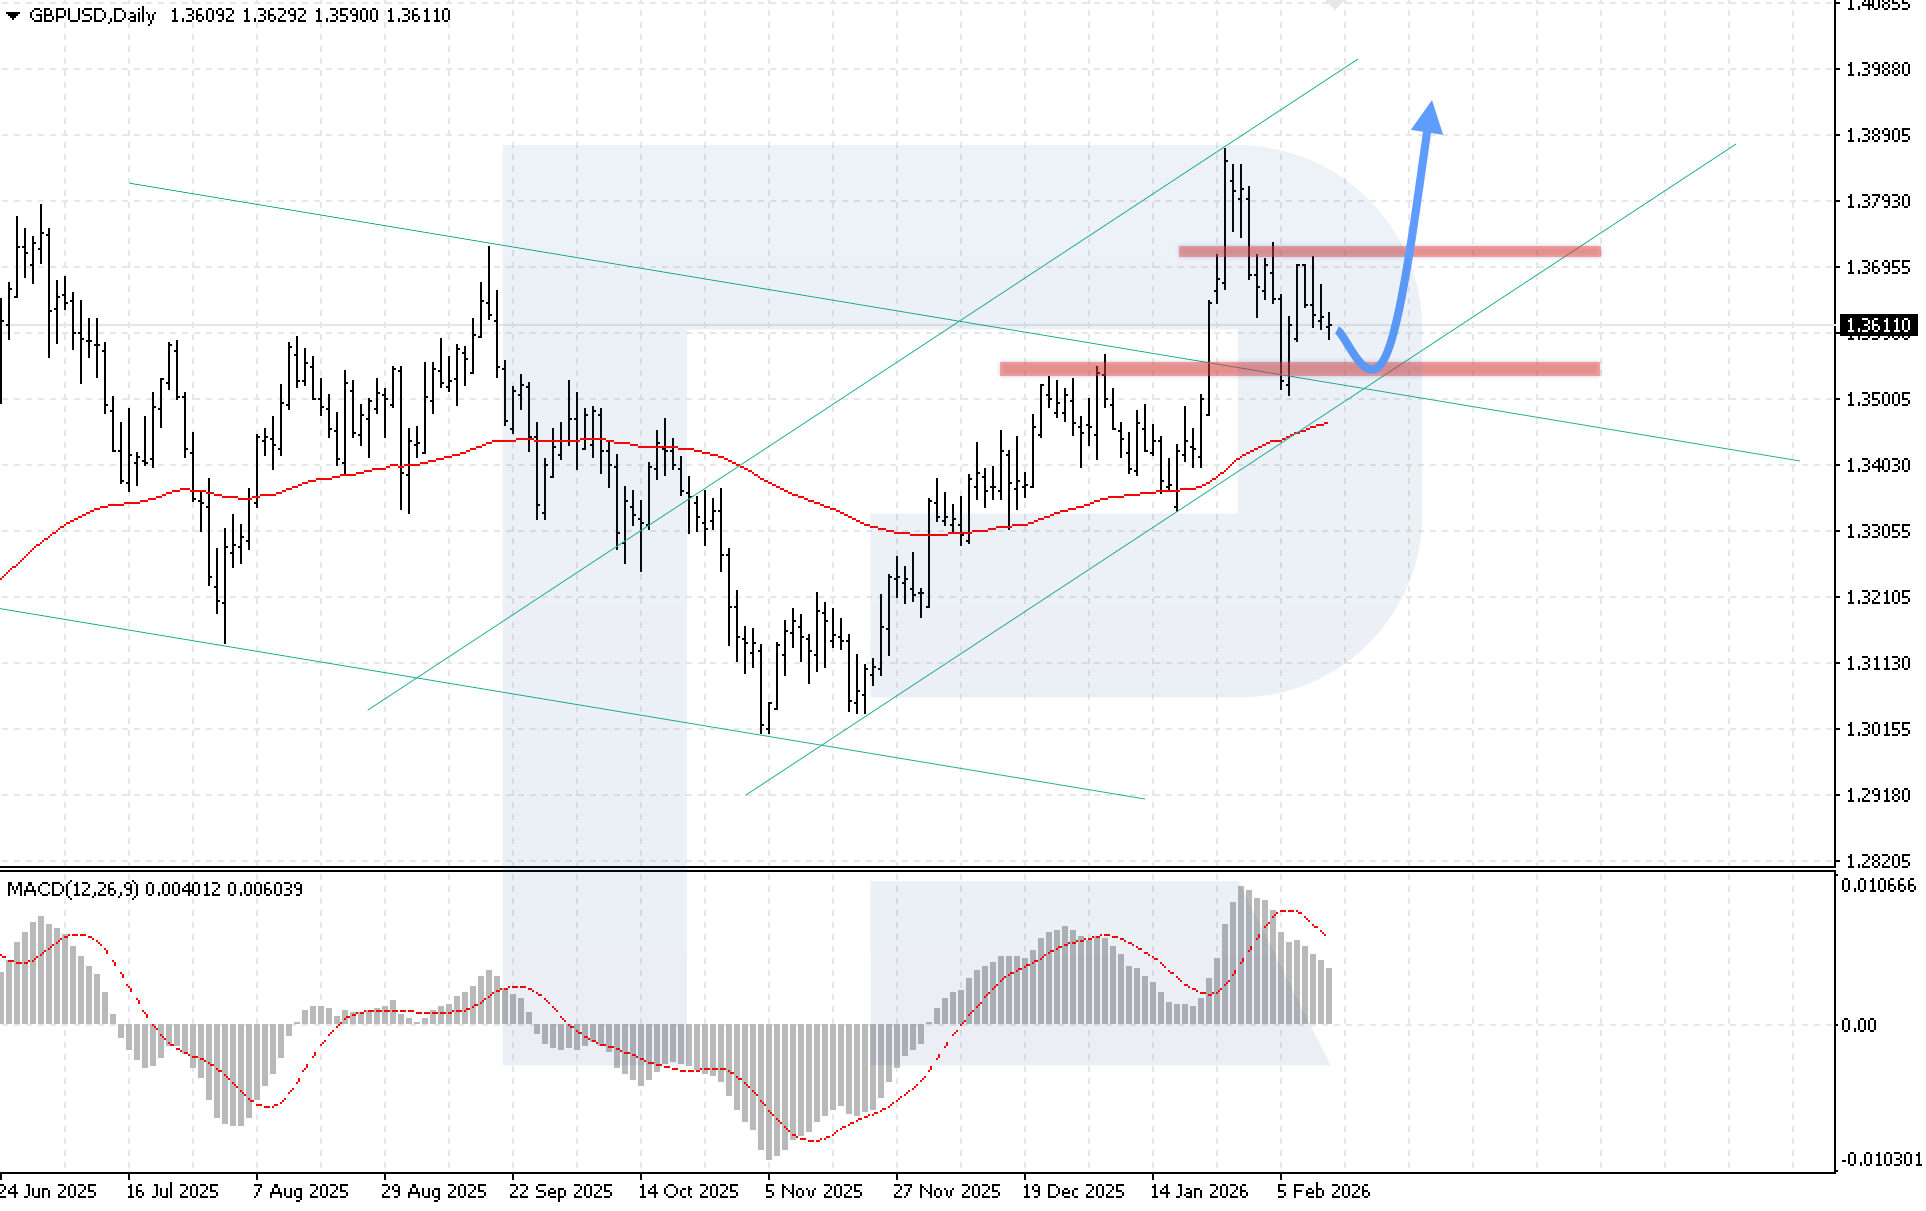
- GBPUSD: Support: 1.3535, 1.3345. Resistance: 1.3695, 1.3885
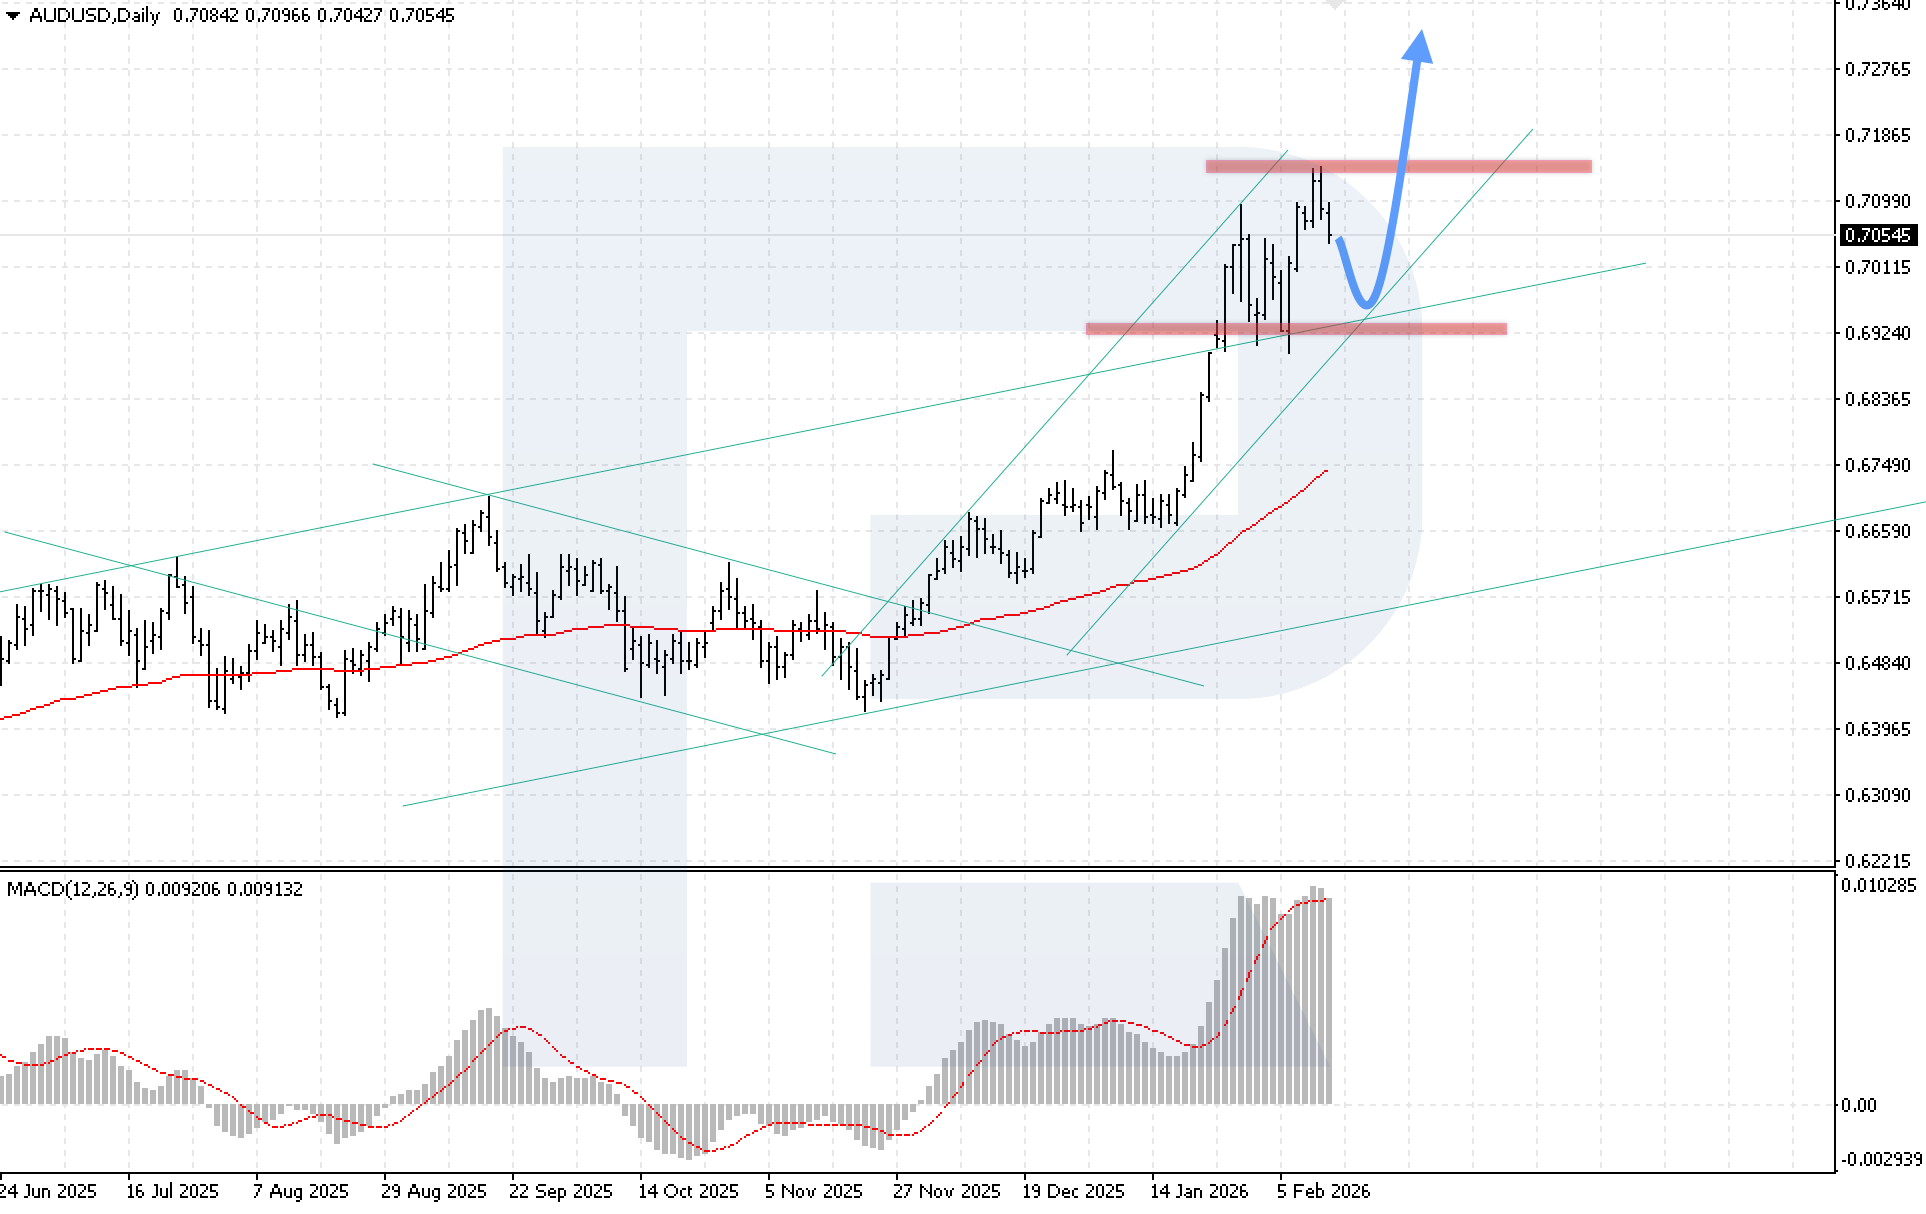
- AUDUSD: Support: 0.6925, 0.6745. Resistance: 0.7125, 0.7315
- USDCAD: Support: 1.3515, 1.3325. Resistance: 1.3715, 1.3855
- Gold: Support: 4,585, 4,365. Resistance: 5,145, 5,435
- Brent: Support: 65.05, 61.90. Resistance: 69.80, 73.65
EURUSD forecast
The EURUSD pair ended the week higher, breaking a two-week losing streak. Buyers are confidently holding the key support level at 1.1805, maintaining control in the market and supporting short-term bullish momentum. However, the euro’s rise was capped by strong US data. Wednesday’s employment figures beat market expectations and reduced the likelihood of an early Federal Reserve rate cut, supporting the US dollar.
According to the US Bureau of Labor Statistics report, the economy added 130 thousand nonfarm jobs in January compared to 50 thousand a month earlier, while economists had expected job growth only in the 55–70 thousand range. Actual data, therefore, significantly exceeded forecasts. An additional factor was that the report’s release was delayed by several days due to last year’s US government shutdown, which increased market volatility at the time of publication. Overall, strong labour market data supported the dollar and temporarily limited EURUSD upside, but holding above the 1.1805 level suggests demand for buying remains.
EURUSD technical analysis
On the daily EURUSD chart, quotes continue to rise after rebounding from the upper boundary of the Triangle pattern and from key support. Buyers are keeping the price within an ascending channel and above the EMA-85, confirming that the bullish momentum remains intact despite a local correction. The current price structure suggests continued growth towards 1.2155 as the Triangle pattern plays out.
MACD indicates a consolidation phase. The histogram is falling, reflecting slowing momentum, while prerequisites for an upward reversal are forming. A breakout above the signal line from below would strengthen buyers’ positions and provide additional confirmation of the uptrend resuming. A key condition for the bullish scenario this week is consolidation above the 1.1935 resistance level. This level coincides with the upper boundary of the Double Bottom reversal pattern. A breakout would open room for accelerated growth.
The alternative scenario will be activated if the 1.1695 support level is broken. In this case, sellers will increase pressure, creating conditions for a decline to 1.1545 and a resumption of a full-fledged downtrend.
EURUSD forecast scenarios
Bullish scenario (baseline): continued bullish momentum after rebounding from the upper boundary of the Triangle pattern, with a target at 1.2155.
Bearish scenario (alternative): if the 1.1695 support level is broken, quotes are expected to return to the Triangle pattern, and a correction may develop with a target at 1.1545.
USDJPY forecast
The USDJPY pair fell throughout last week and reached the key support level at 152.25. Pressure increased as the Japanese yen strengthened. Additional support for the yen came from remarks by Japan’s Prime Minister Sanae Takaichi. She outlined a course towards expanding fiscal policy with a focus on stimulating economic growth without excessive increases in the debt burden. This approach increased investor confidence in Japan’s economic outlook and supported the national currency.
Another factor behind yen strength was verbal intervention by financial authorities. Top currency diplomat Atsushi Mimura said the government remains on high alert to respond to sharp exchange rate swings, despite the yen’s recent strengthening. The market interpreted these comments as a signal of possible intervention in the event of excessive volatility. As a result, the combination of fundamentals and official rhetoric strengthened the yen and pushed USDJPY to test the crucial 152.25 support level.
USDJPY technical analysis
On the daily USDJPY chart, quotes bounced off the 152.25 support levelfor the second time, increasing the likelihood of a Double Bottom reversal pattern forming. A repeated rebound from the same level indicates steady demand and improves the odds of a recovery rally. If the bullish scenario is realised, the move could develop within a Double Bottom formation with a potential target near the key resistance level at 157.85.
MACD confirms signs of a reversal. The histogram has slowed its decline noticeably, and a bullish divergence has formed, indicating easing selling pressure and a gradual recovery in momentum. A key condition to confirm the upside scenario this week will be consolidation above the 155.05 resistance level. This mark coincides with a return above the EMA-85 and would be a technical signal in favour of continued growth.
The alternative scenario will be activated if the price breaks below the 152.25 support level. Such a signal would indicate a move below the lower boundary of the bullish channel and create conditions for a more aggressive decline.
USDJPY forecast scenarios
Bullish scenario (main): a rebound from the lower boundary of the bullish channel at 152.45 will open the potential for growth with a target at 157.85.
Bearish scenario (alternative): if quotes fall and break below 152.25, a deeper decline will become more likely, with a target at 148.15.
GBPUSD forecast
The GBPUSD pair is moving within a correction phase, but buyers continue to hold the price above the key support level at 1.3565, maintaining the potential for stabilisation and renewed demand. The pound came under pressure from weaker-than-expected UK growth data. According to the preliminary estimate, the UK economy grew by only 0.1% in Q4 2025 versus the previous three months, while analysts had forecast 0.2% growth.
For the full year 2025, GDP rose by 1.3%, marking the weakest annual expansion pace since Q2 2024, reinforcing investor doubts about the durability of the recovery. Growth was uneven. The manufacturing sector rose by 1.2% in October–December, while construction contracted by 2.1%. The services sector, which makes up the bulk of the economy, showed no growth and remained unchanged.
GBPUSD technical analysis
On the daily GBPUSD chart, the market continued to decline, but buyers are holding the price above the upper boundary of the previously broken descending channel, indicating an attempt to maintain control. Although quotes briefly dipped below the key support level at 1.3525, bulls quickly brought the price back above that level, confirming demand. This week, renewed upward pressure is expected, with upside potential towards 1.3925 if buyers maintain support.
MACD reflects a correction phase: the histogram is declining, signalling slowing momentum. At the same time, the absence of a bearish divergence indicates sellers have not yet gained a sustainable advantage, and the baseline bullish scenario remains in force. A key condition for the bullish scenario will be consolidation above the local resistance level at 1.3705. This signal would confirm the recovery of bullish momentum and increase the likelihood of a move towards the target at 1.3925.
The alternative scenario becomes relevant if the price breaks below the channel’s lower boundary and consolidates below 1.3465. In this case, the risk of a decline to 1.3305, followed by a test of the EMA-85, will increase.
GBPUSD forecast scenarios
Bullish scenario (main): if the price rebounds from the lower boundary of the bullish channel, an attempt to resume growth towards 1.3925 is expected.
Bearish scenario (alternative): a decline below 1.3465 will cancel the upside scenario and form a new downward wave.
AUDUSD forecast
The AUDUSD pair has been rising for the sixth consecutive trading week, showing steady bullish momentum. The Australian dollar is supported by the RBA’s hawkish rhetoric. Governor Michele Bullock said the Board is ready to raise interest rates further if inflation pressure persists. She stressed that any inflation rate above 3% remains unacceptable, thereby strengthening expectations that tight monetary policy will be maintained.
Additional support for the Australian dollar came from a consumer survey showing that inflation expectations in February rose to 5%, the highest level since mid-2025. Higher expectations strengthen the case for a longer period of high rates. Actual inflation data also points to persistent price pressure. In December 2025, Australia’s annual inflation accelerated to 3.8% from 3.4% in November, exceeding the market forecast of 3.6% and remaining above the 2–3% target range set by the Reserve Bank of Australia.
AUDUSD technical analysis
On the daily AUDUSD chart, quotes are correcting after a failed attempt to break above the 0.7125 resistance level. Despite the pullback, buying pressure remains significant. The price is holding comfortably above the EMA-85, indicating that the medium-term bullish momentum remains intact. This week, renewed growth is likely following a rebound from the lower boundary of the bullish channel and a subsequent move towards 0.7335.
MACD confirms a correction phase. The histogram is falling after reaching a local peak, reflecting slowing momentum. At the same time, buyers have neutralised previously formed bearish divergences, further highlighting the strength of the prevailing trend and reducing the risk of a deep correction. A key condition for the bullish scenario is consolidation above 0.7125. This is the key resistance level, and a breakout would confirm the market’s readiness to continue higher.
The alternative scenario will unfold if the 0.6905 support level is broken. Consolidation below the lower boundary of the bullish channel would create conditions for a decline towards 0.6745 as part of a Double Top reversal pattern.
Text 12
Bullish scenario (baseline): a rebound from the channel’s lower boundary at 0.6965 would indicate a continued rise towards 0.7335.
Bearish scenario (alternative): a breakout below the support level, followed by consolidation below 0.690,5 would generate a signal for a bearish correction in the pair.
USDCAD forecast
The USDCAD pair is trending higher. Buyers have defended the 1.3515 support level twice, preventing the price from consolidating below this level, which has strengthened the short-term bullish bias. Pressure on the Canadian dollar increased after strong US labour market data supported the US dollar. At the same time, Canadian data was mixed.
According to Statistics Canada, the economy lost 24,800 jobs in January, while economists had expected a modest increase in employment. At the same time, the unemployment rate fell to 6.5%, the lowest level since late 2024. However, the drop in unemployment was largely technical. The rate fell amid a significant decline in the labour force participation rate, meaning fewer Canadians were actively looking for work. This distorted the overall labour market picture and does not indicate a sustainable improvement. Such data restrains expectations that the Bank of Canada will return to tightening monetary policy in the near term.
USDCAD technical analysis
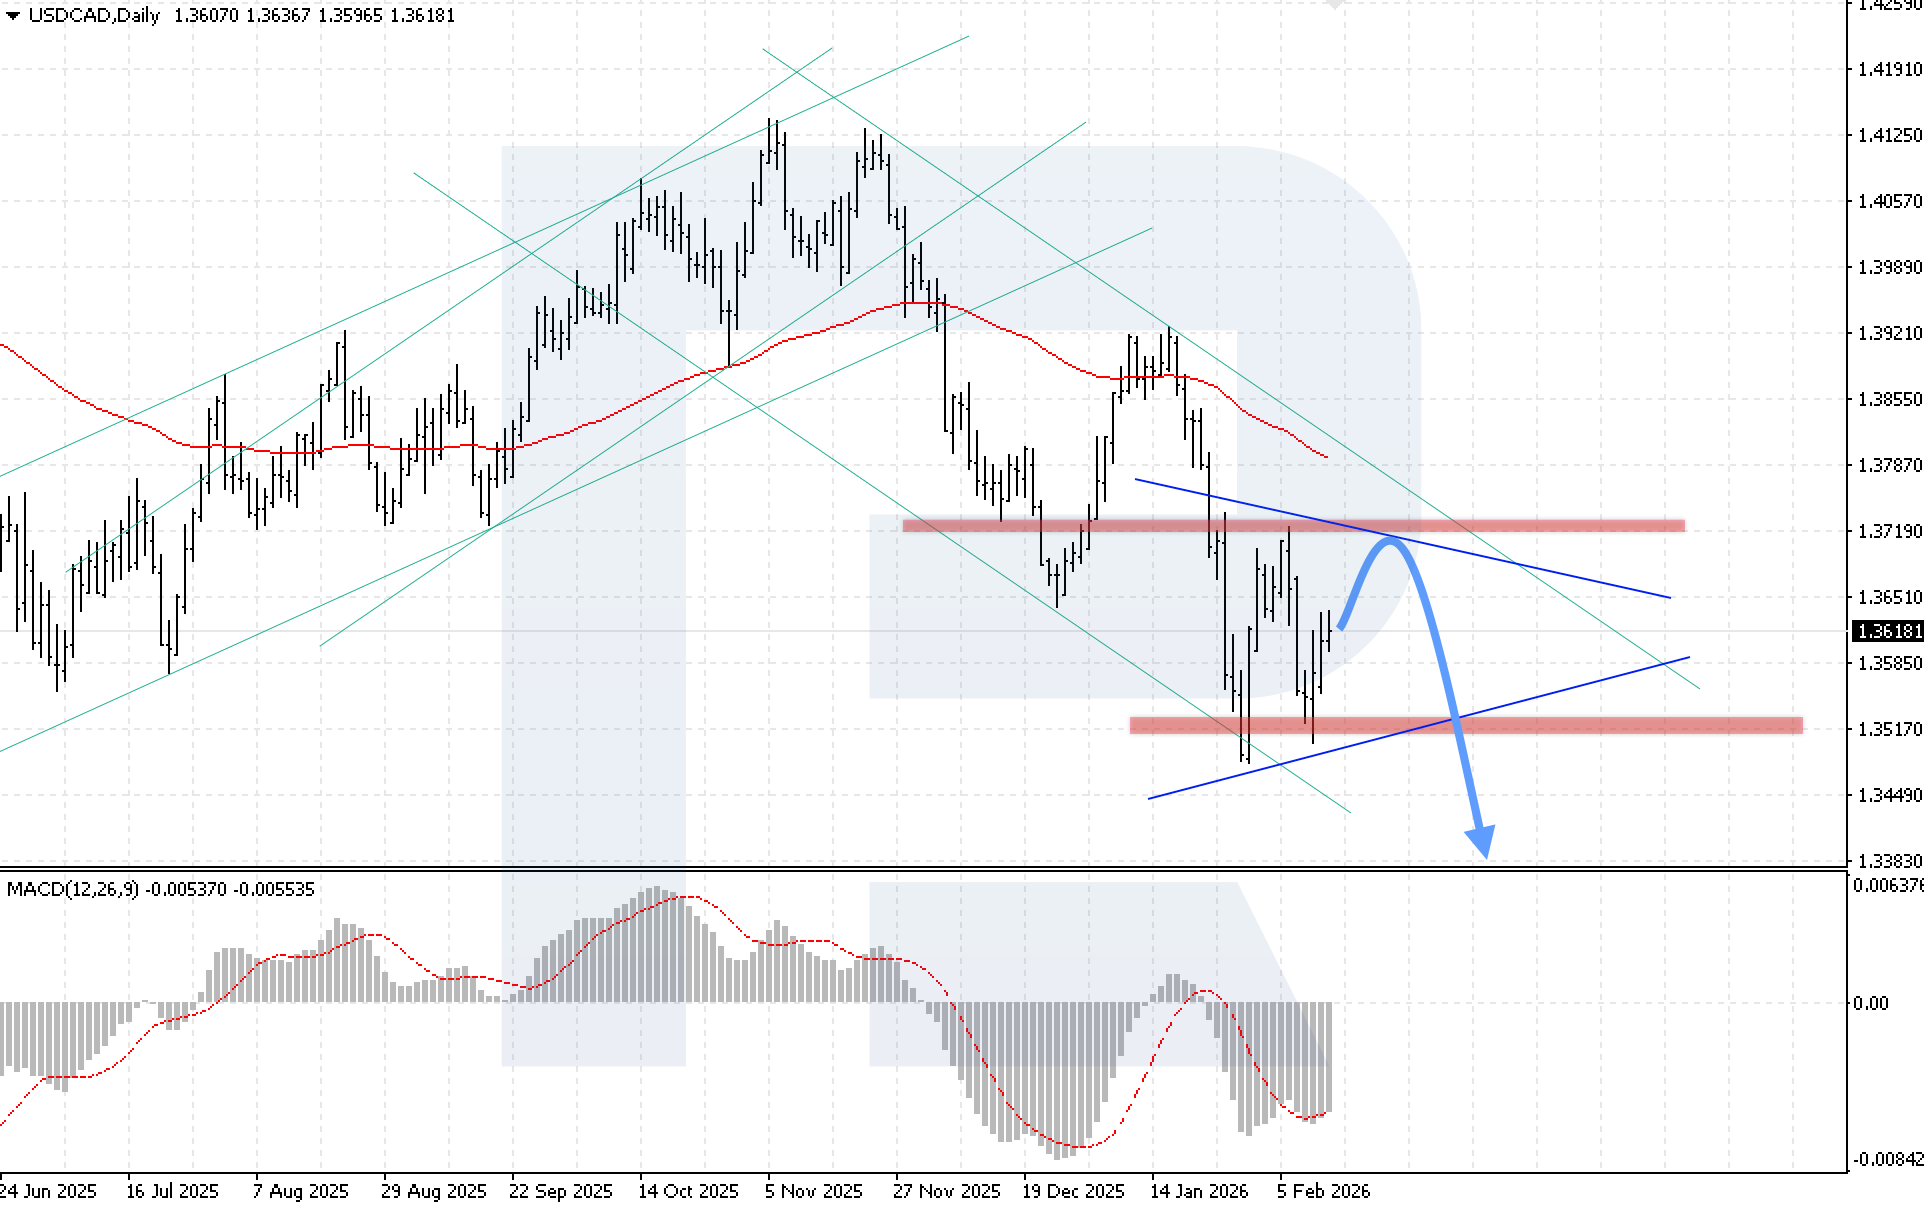
On the daily USDCAD chart, quotes are correcting after rebounding from the support level, while the potential for a Triangle pattern remains. Key resistance is located at 1.3715. The weekly outlook suggests a test of the pattern’s upper boundary, followed by a decline towards 1.3385.
MACD confirms the dominance of buying pressure and points to a likely short-term rise early in the week. The histogram continues to increase, and a bullish divergence has formed, supporting expectations of a temporary strengthening of the US dollar. A key condition for the downside scenario is consolidation below 1.3505. Such a breakout would confirm a move below the lower boundary of the Triangle pattern and strengthen the signal for further decline, with targets to the downside.
The alternative scenario will come into play if the 1.3715 resistance level is broken. This would indicate a breakout above the upper boundary of the descending channel, cancel the Triangle formation, and open the door for continued upward movement.
USDCAD forecast scenarios
Bearish scenario (main): if the price rebounds from the upper boundary of the Triangle pattern at 1.3715, a full-fledged bearish momentum is expected to resume with a target at 1.3385.
Bullish scenario (alternative): if the upper boundary of the Triangle pattern is decisively broken and the price consolidates above 1.3715, the market will receive a signal for growth.
XAUUSD forecast
XAUUSD ended last week lower. Buyers failed to break above the key resistance level at 5,095, which limited price upside.
Gold remains fundamentally supported by steady demand from central banks, despite Thursday’s sharp drop. The People’s Bank of China has been increasing its gold reserves for 15 consecutive months, demonstrating a long-term accumulation strategy. In Q4 2025, global central banks, remaining key market participants, significantly increased gold purchases. These actions strengthen the precious metal’s long-term bullish fundamentals and support its appeal as a store-of-value instrument.
Thus, despite the short-term decline, long-term fundamental factors continue to bolster gold, retaining the potential for a price recovery.
XAUUSD technical analysis
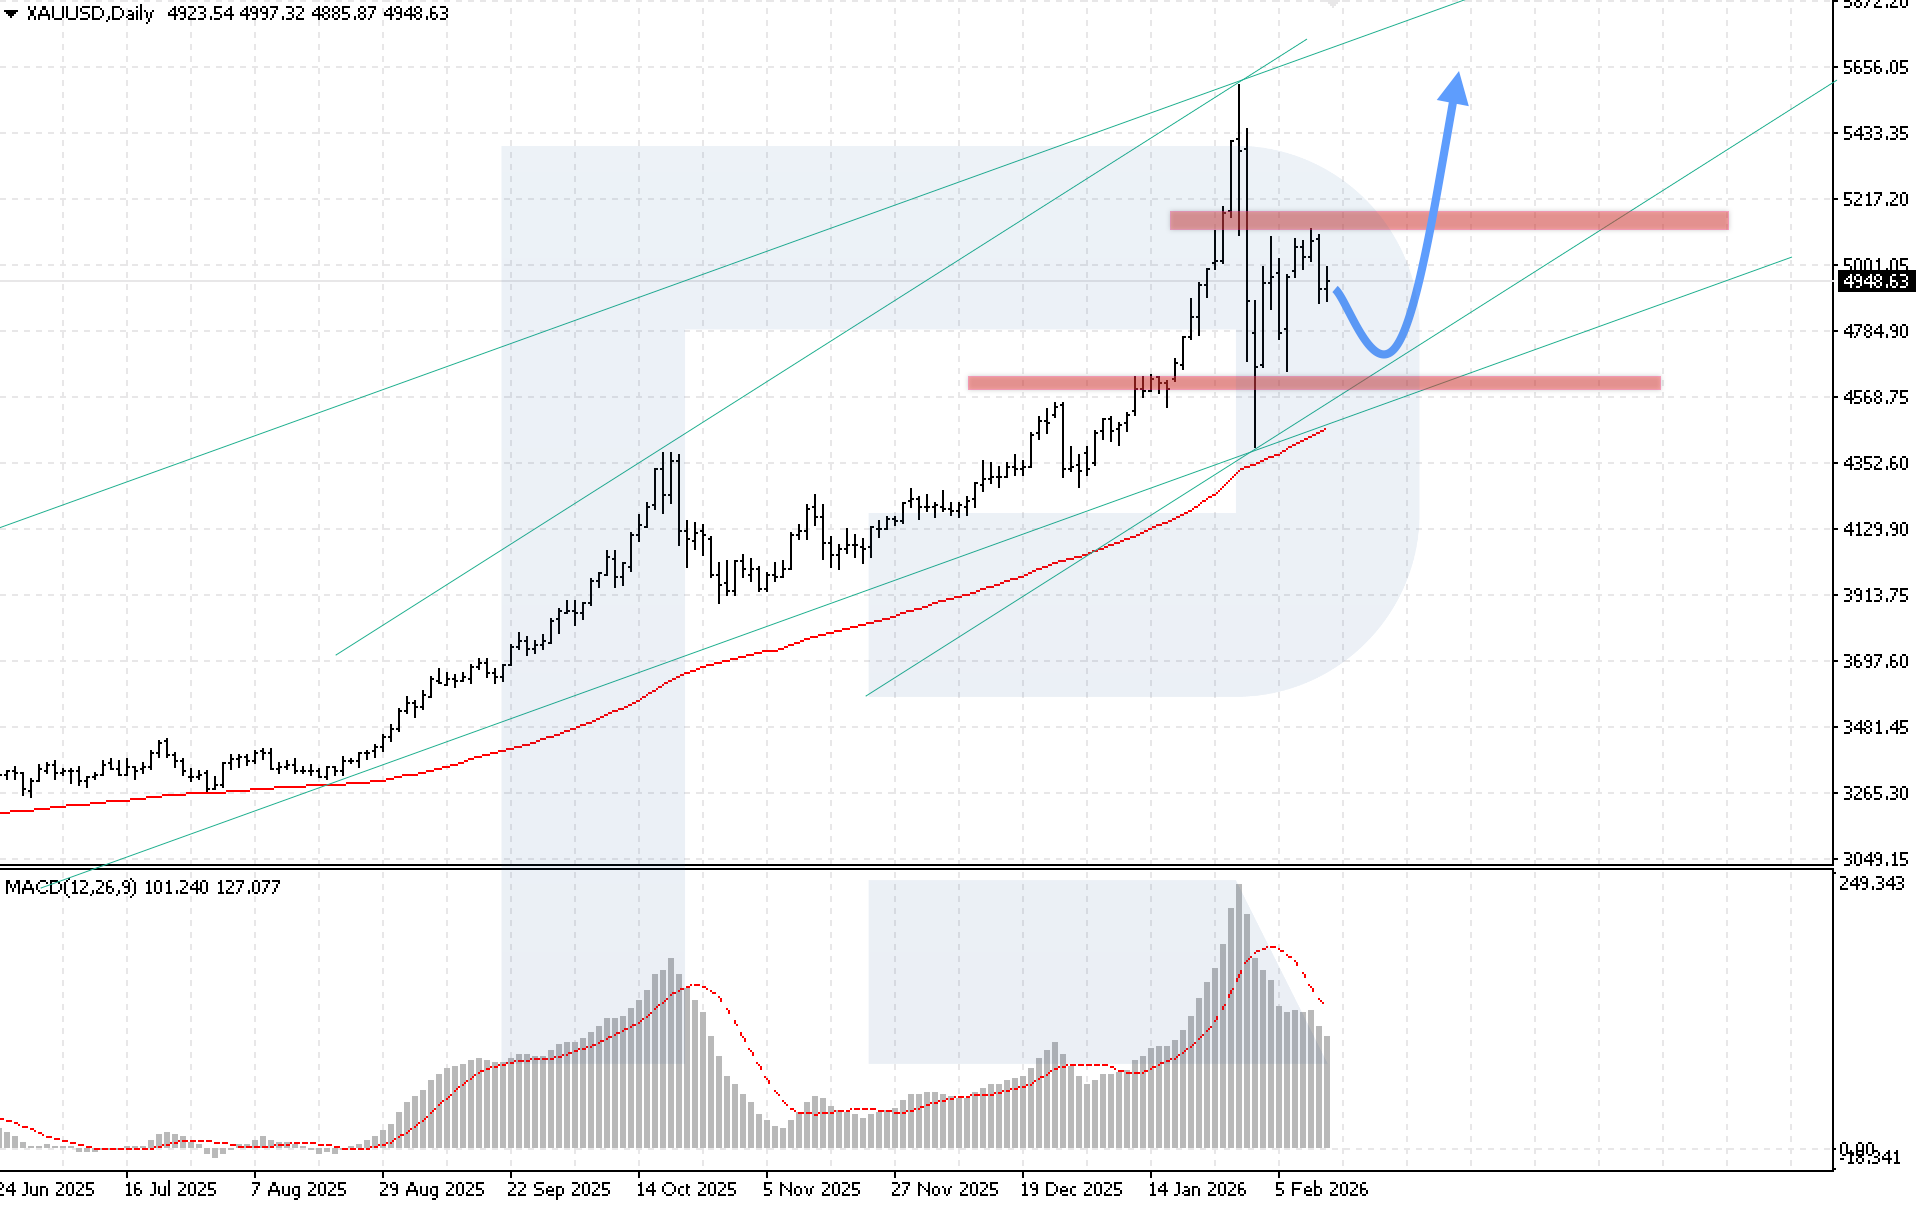
On the daily XAUUSD chart, quotes are correcting after rebounding from the key resistance level, while remaining within the bullish channel and above the EMA-85. At the start of this week, prices could dip to the channel’s lower boundary before recovering and rising towards 5,655 USD.
MACD confirms the correction phase. The histogram continues to decline after a brief pause, reflecting slowing momentum and pointing to continued consolidation. A key condition for the bullish scenario is consolidation above 5,125 USD. A breakout of this level would confirm the upper boundary of the Double Bottom reversal pattern and open the potential for further growth within the pattern.
The alternative scenario will unfold if the lower boundary of the bullish channel is broken and prices consolidate below 4,425 USD. Such a signal would indicate a move outside the long-term channel and a breakout below the EMA-85, creating conditions for a deeper and more aggressive correction in the gold market.
XAUUSD forecast scenarios
Bullish scenario (main): the potential remains for prices to resume growth after rebounding from the lower boundary of the bullish channel, with a target at 5,655 USD.
Bearish scenario (alternative): in the event of an aggressive decline with prices consolidating below 4,425 USD, the potential opens for a deeper drop in gold prices.
Brent forecast
Brent prices fell last week after six weeks of steady gains. The 69.85 USD resistance level proved too strong for bulls, limiting further price appreciation.
Pressure on the market increased amid concerns about an oversupply. The International Energy Agency confirmed that in 2026, the market is likely to face a supply surplus of just over 3.7 million barrels per day, a record annual average figure. In addition, the agency lowered its forecast for global oil demand for the current year.
Geopolitical factors also influenced the situation. Donald Trump said talks with Iran could drag on for a month, reducing the likelihood of short-term military action that could disrupt oil supplies.
Brent technical analysis
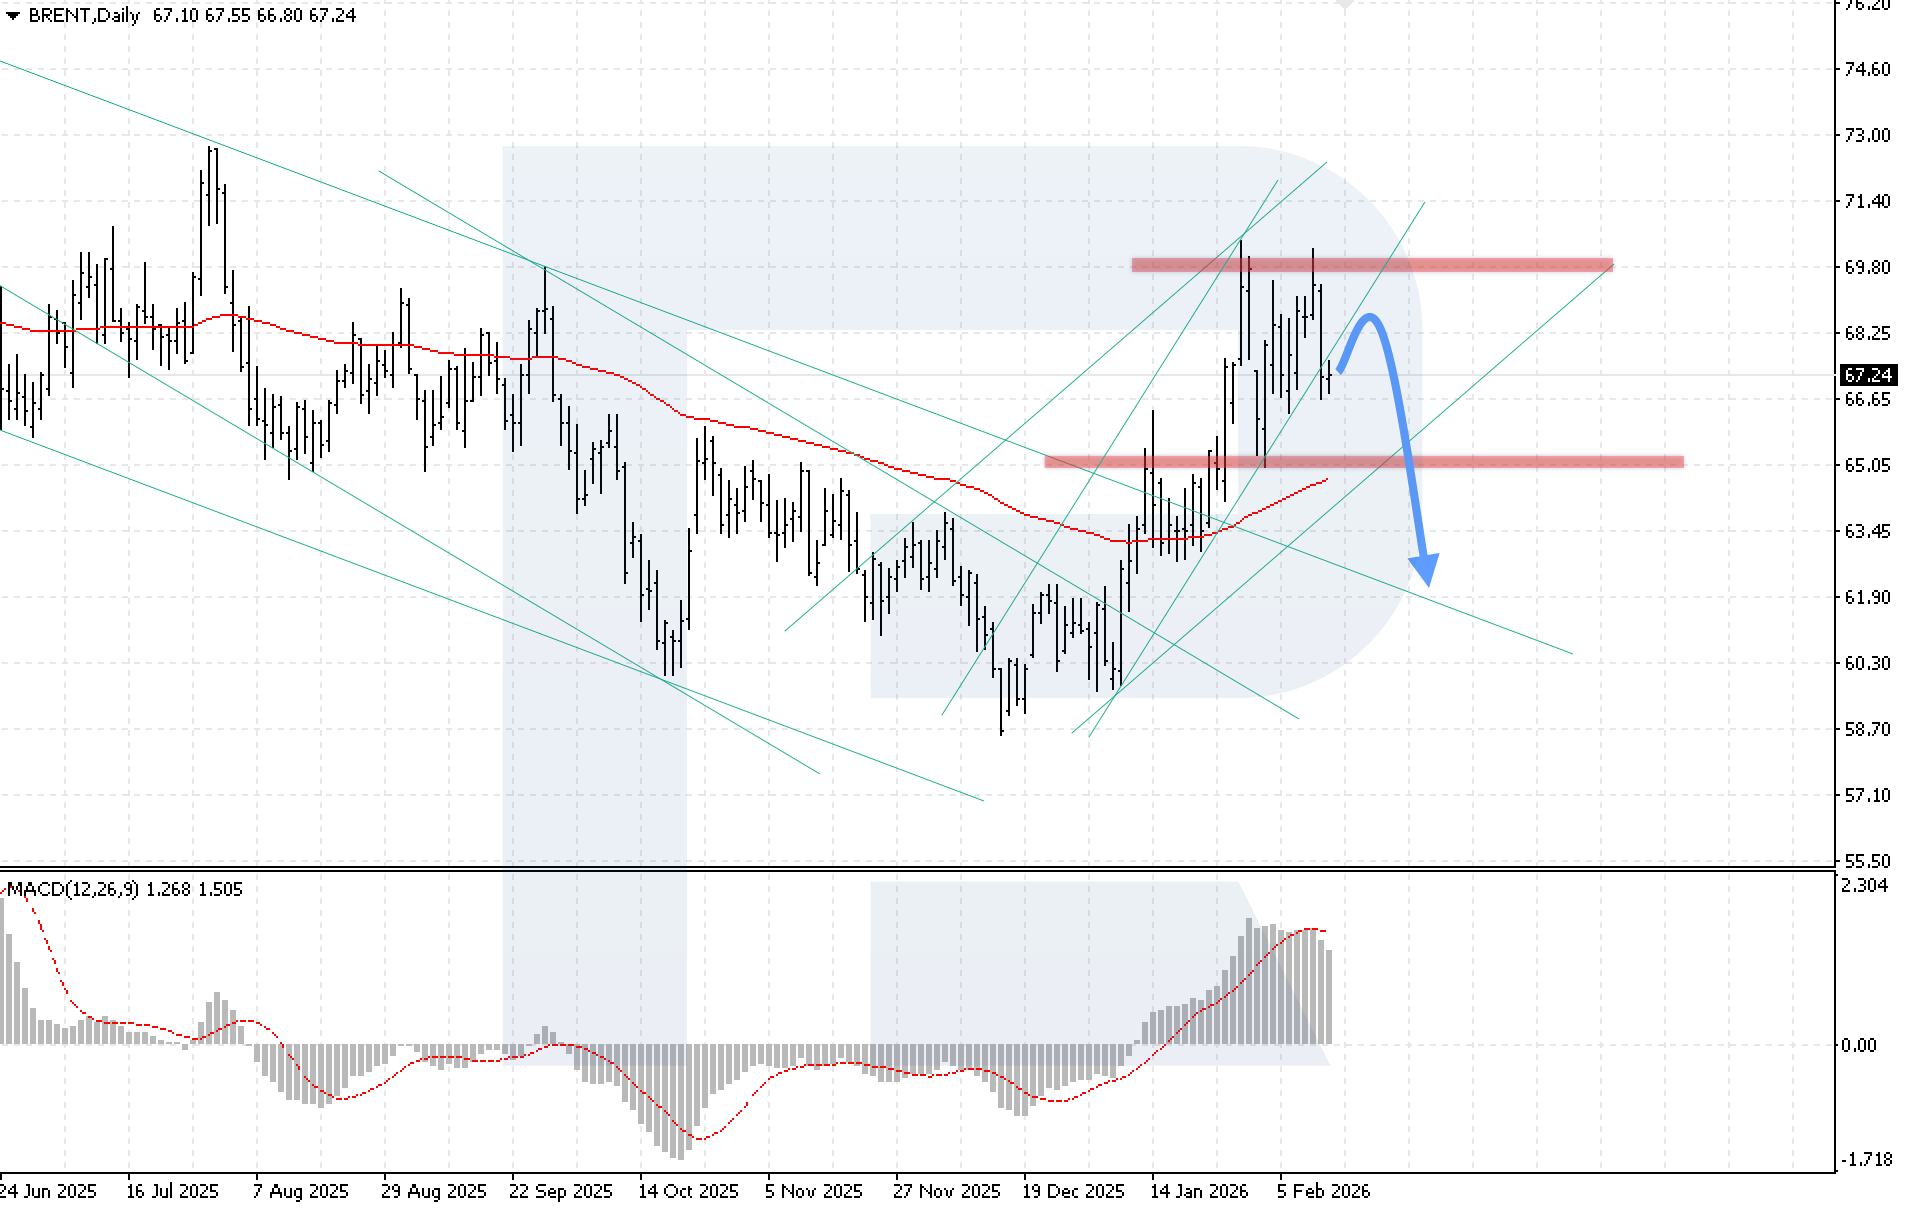
On the daily Brent chart, quotes have consolidated below the lower boundary of the bullish channel, indicating increasing selling pressure. Prices tested the resistance level twice and are now declining. The Brent outlook suggests a rebound from the lower boundary of the bullish channel at 65.05 USD, which would complete a Double Top pattern and create potential for a further drop towards 62.05 USD.
MACD confirms a consolidation phase. The histogram is declining after reaching a peak, and the signal line has moved outside the histogram, forming a sell signal. A key condition for the bearish scenario this week is consolidation below 65.05 USD.
The bullish scenario in the Brent outlook will be activated if the resistance level is broken, with prices consolidating above 69.85 USD. This would confirm a breakout above the upper boundary of the reversal pattern and open the door for continued growth towards 75.05 USD.
Brent forecast scenarios
Bearish scenario (main): a successful rebound from the lower boundary of the bullish channel would open the potential for the decline to continue towards 62.05 USD.
Bullish scenario (alternative): in the event of aggressive growth and price consolidation above 69.85 USD, oil quotes are expected to resume their upward trajectory.
Editors’ picks
 EURUSD 2026-2027 forecast: key market trends and future predictions
This article provides the EURUSD forecast for 2026 and 2027 and highlights the main factors determining the direction of the pair’s movements. We will apply technical analysis, take into account the opinions of leading experts, large banks, and financial institutions, and study AI-based forecasts. This comprehensive insight into EURUSD predictions should help investors and traders make informed decisions.
 Gold (XAUUSD) forecast 2026 and beyond: expert insights, price predictions, and analysis
Dive deep into the Gold (XAUUSD) price outlook for 2026 and beyond, combining technical analysis, expert forecasts, and key macroeconomic factors. It explains the drivers behind gold’s recent surge, explores potential scenarios including a move toward 4,500 to 5,000 USD per ounce, and highlights why the metal remains a strong hedge during global uncertainty.
Forecasts presented in this section only reflect the author’s private opinion and should not be considered as guidance for trading. RoboForex bears no responsibility for trading results based on trading recommendations described in these analytical reviews.