Weekly technical analysis and forecast (2–6 March 2026)
This weekly technical analysis highlights the key chart patterns and levels for EURUSD, USDJPY, GBPUSD, AUDUSD, USDCAD, gold (XAUUSD), and Brent crude oil to forecast market moves for the upcoming week (2–6 March 2026).
Major technical levels to watch this week
- EURUSD: Support: 1.1720, 1.1655. Resistance: 1.1845, 1.1920
- USDJPY: Support: 155.35, 154.35. Resistance: 156.95, 157.50
- GBPUSD: Support: 1.3445, 1.3315. Resistance: 1.3585, 1.3685
- AUDUSD: Support: 0.7025, 0.6875. Resistance: 0.7165, 0.7305
- USDCAD: Support: 1.3635, 1.3505. Resistance: 1.3725, 1.3865
- Gold: Support: 5,070, 4,875. Resistance: 5,235, 5,405
- Brent: Support: 71.05, 67.15. Resistance: 74.85, 78.85
EURUSD forecast
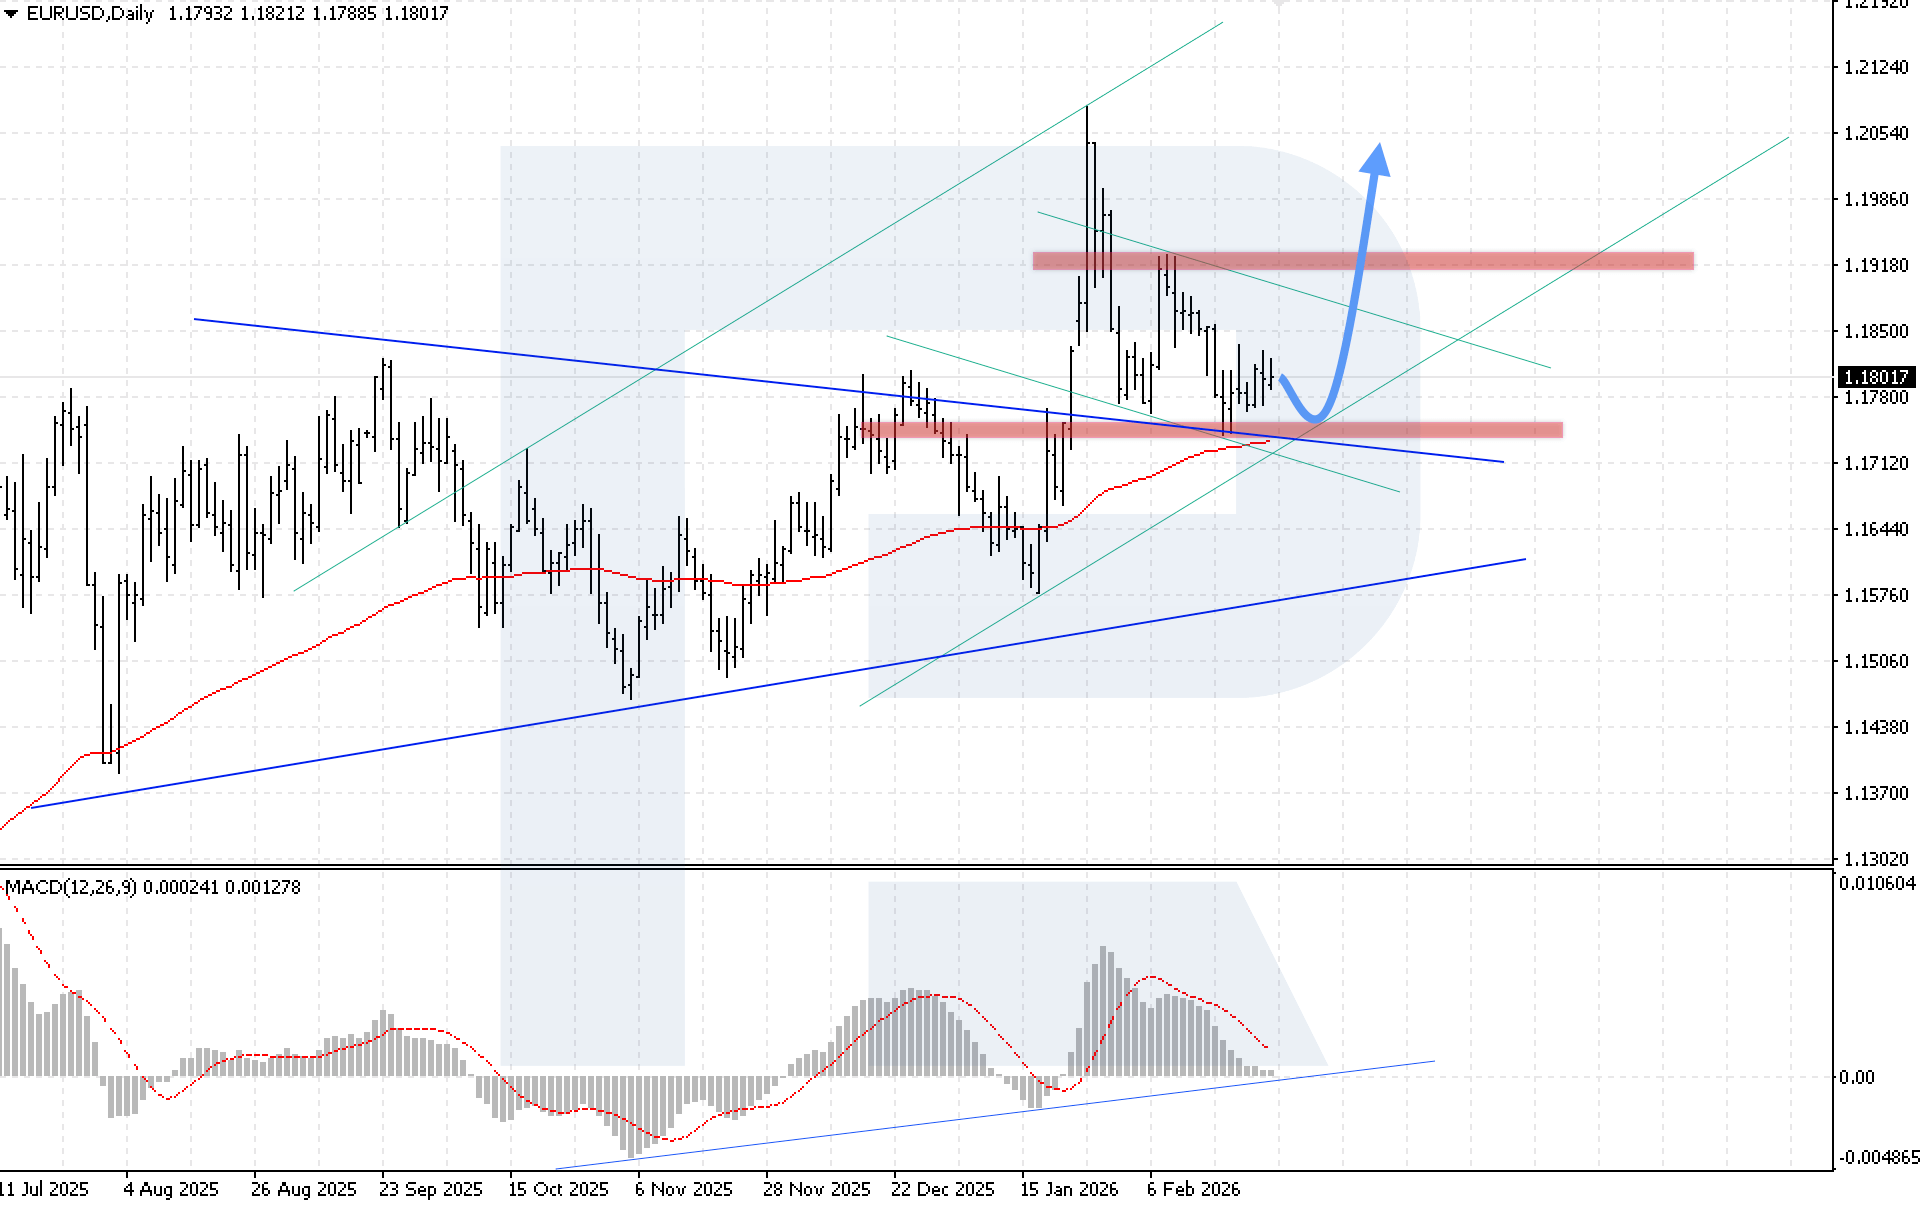
The EURUSD pair ended the week with moderate gains. Bulls are keeping prices above the key 1.1770 support level and above the upper boundary of the Triangle pattern, which increases the chances of further upside this week.
Markets estimate the likelihood of an ECB rate cut by December at only 30%. ECB President Christine Lagarde noted that core inflation is expected to be near the 2% target over the medium term, while food inflation is projected to be slightly above 2% later this year. She added that the regulator will monitor exchange rate fluctuations but does not plan direct intervention in the currency market.
Market participants are also closely watching signals from Federal Reserve officials. Chicago Fed President Austan Goolsbee allowed for the possibility of rate cuts if inflation slows further. At the same time, Federal Reserve governor Steven Miran supports the idea of a full one-percentage-point rate cut in 2026.
EURUSD technical analysis
On the daily EURUSD chart, the pair rebounded from the support leve near the EMA-85, increasing the importance of the current support zone. Despite the ongoing correction that has lasted for several weeks, the pair retains upside potential towards 1.1985 as the Triangle pattern begins to play out.
MACD indicates a consolidation phase, but its readings have reached a support line, suggesting a possible reversal may be near. A key condition for the bullish scenario this week is consolidation above 1.1875. This would confirm a breakout above the upper boundary of the corrective channel and open the door for further EURUSD recovery.
The alternative scenario will be activated if the price breaks below the 1.1695 support level. In this case, selling pressure would intensify, and prices may return to the Triangle pattern, potentially creating prerequisites for a decline towards 1.1545 and invalidating the current pattern.
EURUSD forecast scenarios
Bullish scenario (baseline): renewed bullish pressure and a return to growth are expected if the pair breaks above the local resistance level while holding the lower boundary of the bullish channel at 1.1720; the upside target is 1.2035.
Bearish scenario (alternative): a breakout below the lower boundary of the long-term bullish channel at 1.1695 would signal a resumed downward move in the pair.
USDJPY forecast
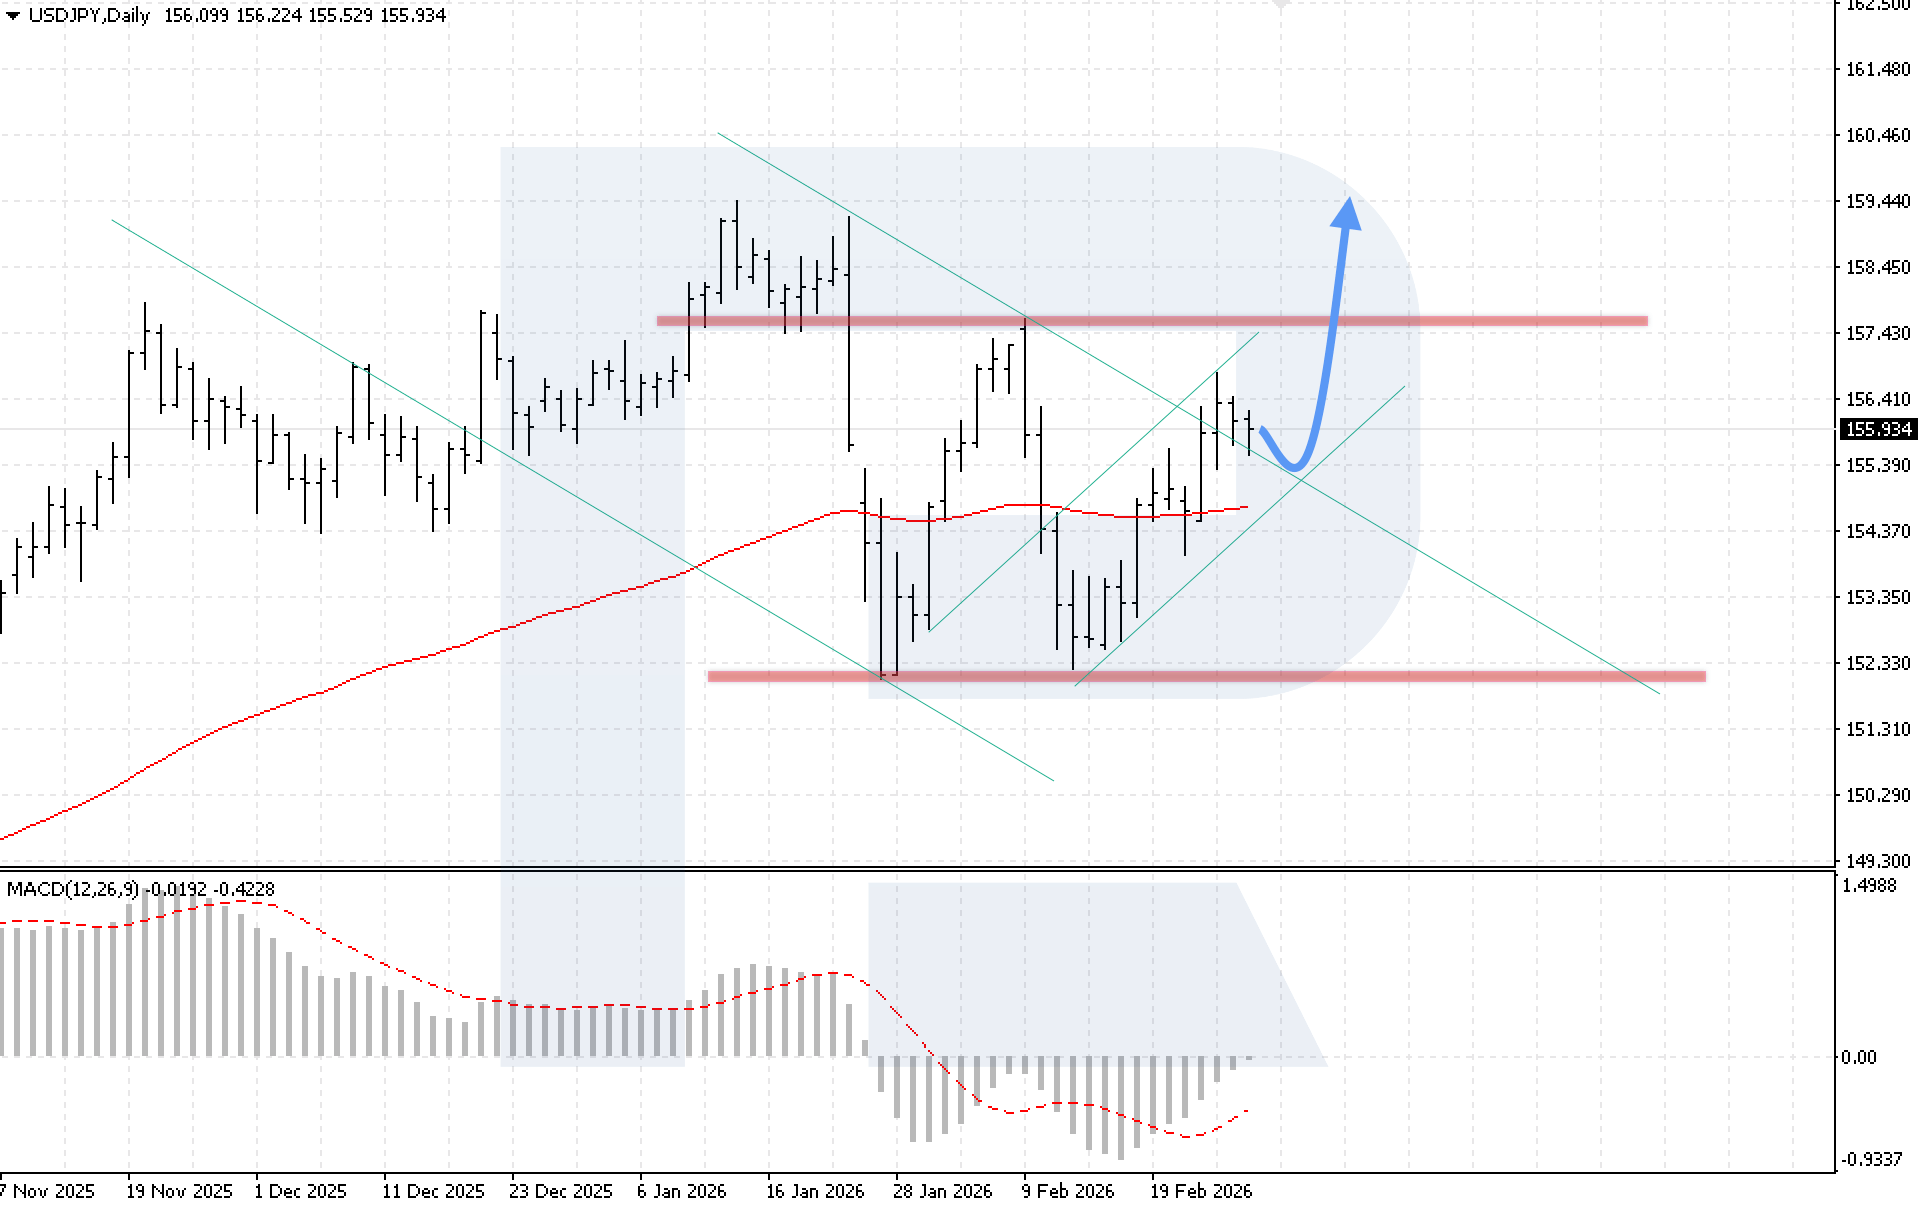
The USDJPY pair is ending its second consecutive week of gains. Buyers are actively testing the 156.85 resistance level. The Japanese yen remains under pressure amid uncertainty over Bank of Japan policy.
A hawkish board member, Hajime Takata, called for further rate hikes and for signalling that the price-stability goal is close to being achieved. BoJ Governor Kazuo Ueda noted that the regulator will carefully assess incoming economic data at the March and April meetings before making rate decisions, leaving room for a near-term hike.
At the same time, Tokyo inflation slowed to its lowest level in more than a year, supporting expectations that the BoJ may delay an immediate rate increase. The combination of these factors creates conditions for further gains in USDJPY.
USDJPY technical analysis
On the daily USDJPY chart, prices are showing moderate growth and remain within the formation of a Double Bottom reversal pattern. Buyers are holding the price above the EMA-85, strengthening bullish positions and supporting upward momentum.
MACD confirms positive dynamics: the histogram is rising steadily and has almost reached the zero line, signalling weakening bearish pressure and a possible strengthening of the upward move. A key condition to confirm the bullish scenario this week is consolidation above the 158.05 resistance level. This would indicate a breakout above the upper boundary of the Double Bottom pattern and open the way to a move in line with the pattern signal, with targets at higher levels.
The alternative scenario will unfold if the price breaks below the 154.45 support level. In this case, quotes would move outside the bullish channel, adding to selling pressure and creating risks of a decline towards the lower boundary of the Double Bottom pattern.
USDJPY forecast scenarios
Bullish scenario (main): a breakout above the upper boundary of the Double Bottom reversal pattern with consolidation above 157.75 would indicate stronger upside towards 159.45.
Bearish scenario (alternative): if prices fall and break below the lower boundary of the reversal pattern with consolidation below 152.05, the probability of a deeper decline increases.
GBPUSD forecast
The GBPUSD rate is falling for the second consecutive week, reflecting rising pressure on the British currency. The pound came under pressure amid growing political uncertainty in the UK. Investors fear that possible reshuffles in government could lead to expanded fiscal stimulus and higher public spending, increasing the burden on the budget and negatively affecting the pound’s performance.
An additional pressure factor was an unexpected drop in the consumer confidence index in February amid rising unemployment. Deteriorating household sentiment increases the risks of slower economic activity and cooling domestic demand. Weak labour data and continued easing inflation pressure are strengthening expectations of monetary easing. Market participants are increasingly pricing in the probability of BoE rate cuts, which adds to pressure on the GBPUSD pair and keeps the risk of further weakness.
GBPUSD technical analysis
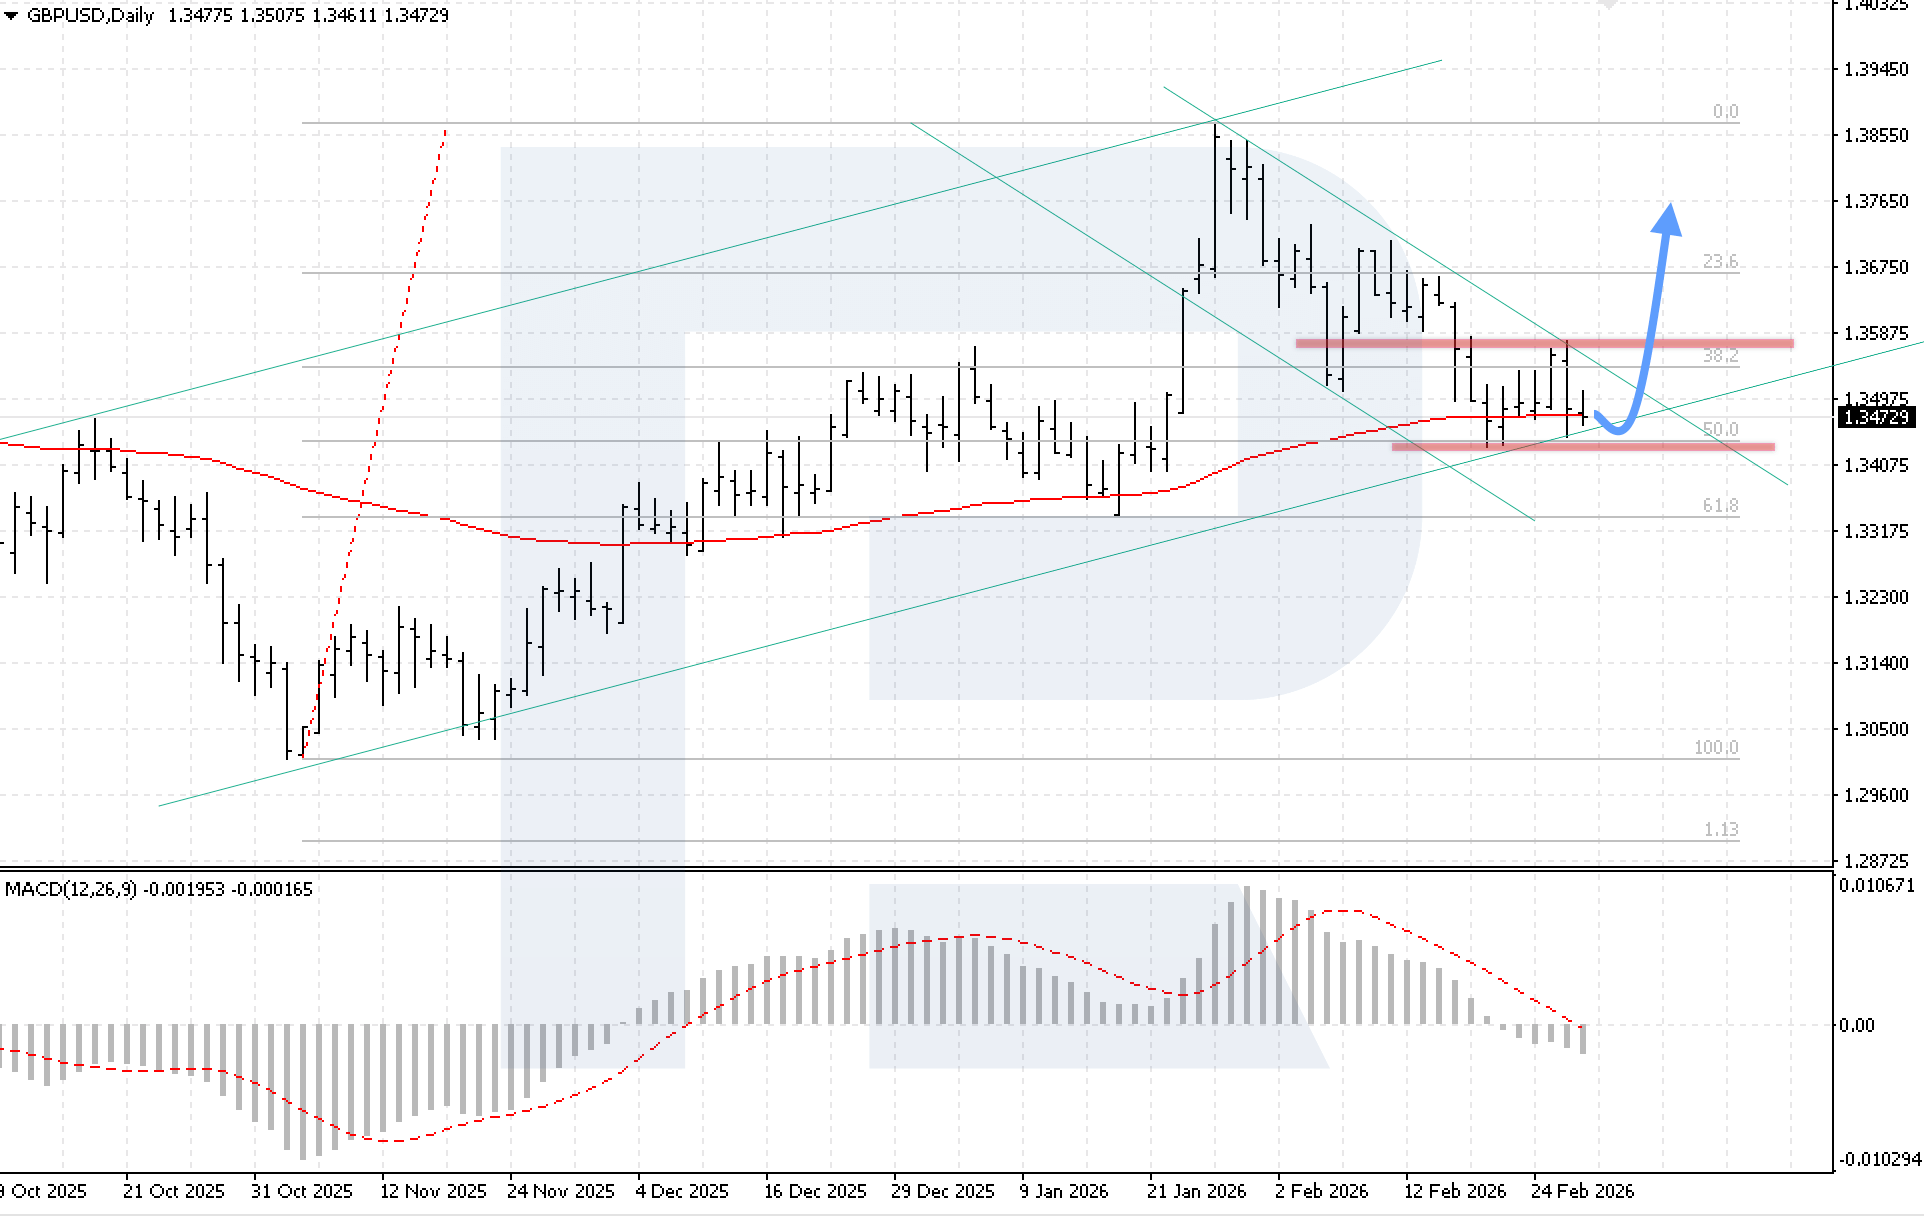
On the daily GBPUSD chart, prices continue to hold above the EMA-85, remaining within the long-term bullish channel. The market is attempting to form a new upward wave, with a renewed bullish impulse likely this week, targeting the area around 1.3765.
MACD reflects a correction phase: the histogram is falling after a slowdown and has already crossed the zero line, indicating a temporary weakening of bullish momentum. A key condition for the upside scenario is consolidation above the local resistance level at 1.3605. This would confirm a breakout above the upper boundary of the Double Bottom reversal pattern and point to the end of the correction with a move out of the descending channel.
The alternative scenario will unfold if the price breaks below the channel’s lower boundary and consolidates below 1.3365. In this case, the risk of a deeper correction increases, with potential downside towards 1.3245 after a move outside the long-term bullish channel.
GBPUSD forecast scenarios
Bullish scenario (main): with a breakout above the upper boundary of the descending corrective channel and consolidation above 1.3605, bullish momentum is expected to renew.
Bearish scenario (alternative): a decline is expected if the lower boundary of the bullish channel is broken and the price consolidates below 1.3365.
AUDUSD forecast
The AUDUSD pair has been rising for eight consecutive weeks, holding near local resistance and reaching new multi-year highs. The strengthening of the Australian currency reflects investor confidence in the resilience of the domestic economy and rising expectations of a more hawkish stance by the Reserve Bank of Australia.
Markets currently estimate the likelihood of a rate hike in May at around 80% after a sharp acceleration in inflation in January. These expectations provide fundamental support for further AUDUSD gains. Meanwhile, RBA Governor Michele Bullock emphasised that, given the current balance in the economy, the regulator should remain patient. Such rhetoric somewhat restrains expectations of an aggressive tightening cycle.
The market may have already partially priced in potential rate hikes. Nevertheless, persistent expectations of tighter policy continue to keep the AUDUSD pair supported near its highs.
AUDUSD technical analysis
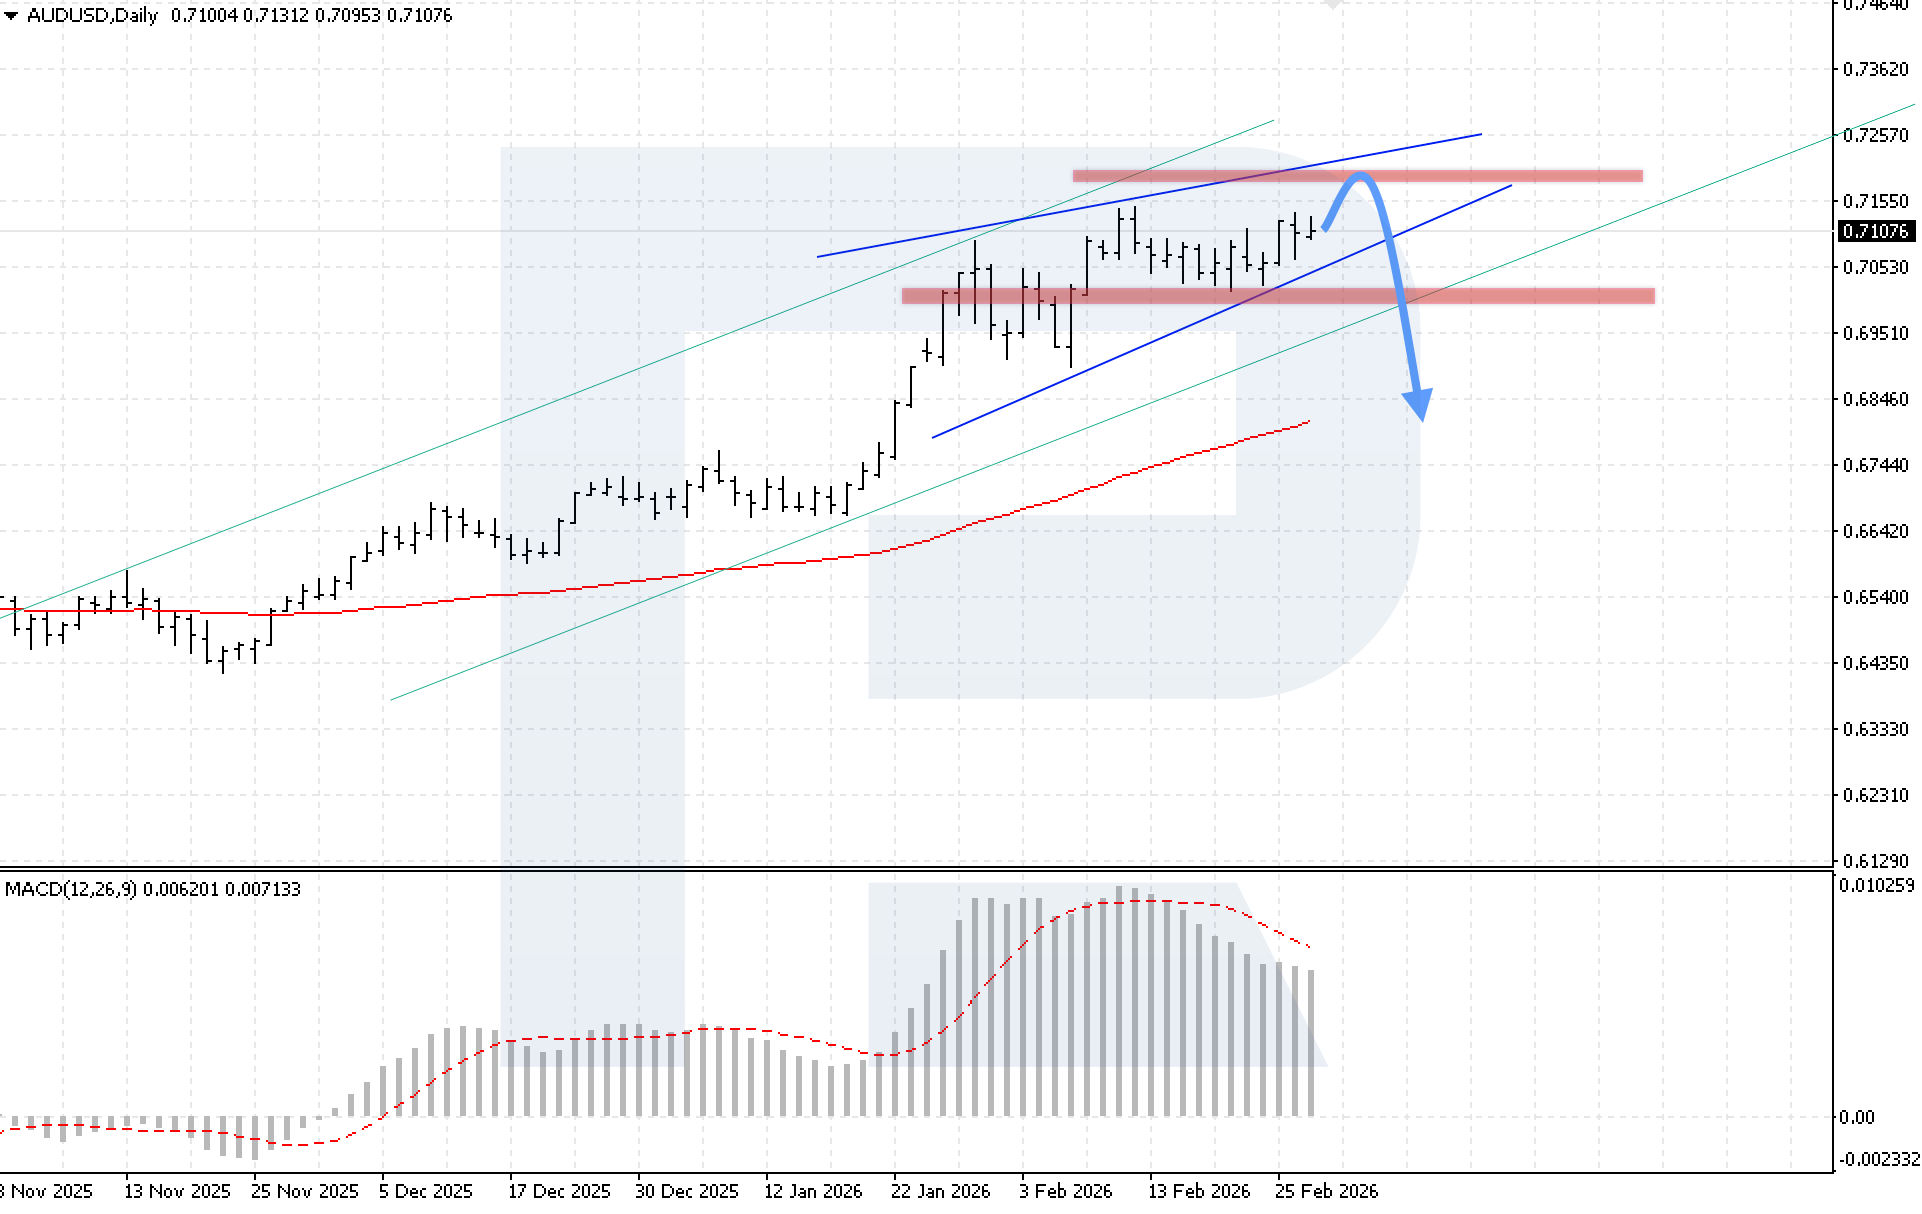
On the daily AUDUSD chart, prices have approached the 0.7145 resistance level. Despite continued buying pressure, prerequisites are forming for the emergence of a Wedge reversal pattern. Completion of such a pattern could signal the risk of a subsequent decline with a potential target at 0.6835.
MACD confirms a phase of slowing momentum: the histogram is declining after reaching a local peak, reflecting weakening upward momentum. If the price rises further, a bearish divergence may form, increasing the risks of a bearish correction. A key condition for the downside scenario is consolidation below 0.7035. This would indicate a breakout below the Wedge’s lower boundary and open the way for a downside move towards lower targets.
The alternative scenario will be activated if the 0.7185 resistance level is broken. This would confirm a breakout above the pattern’s upper boundary and create conditions for continued growth towards 0.7375.
AUDUSD forecast scenarios
Bearish scenario (baseline): a rebound from the upper boundary of the Wedge reversal pattern, with the price consolidating below 0.7035, would indicate the start of a decline towards the target of 0.6835.
Bullish scenario (alternative): a breakout above the resistance level with consolidation above 0.7185 would signal continued growth towards 0.7375, cancelling the reversal pattern.
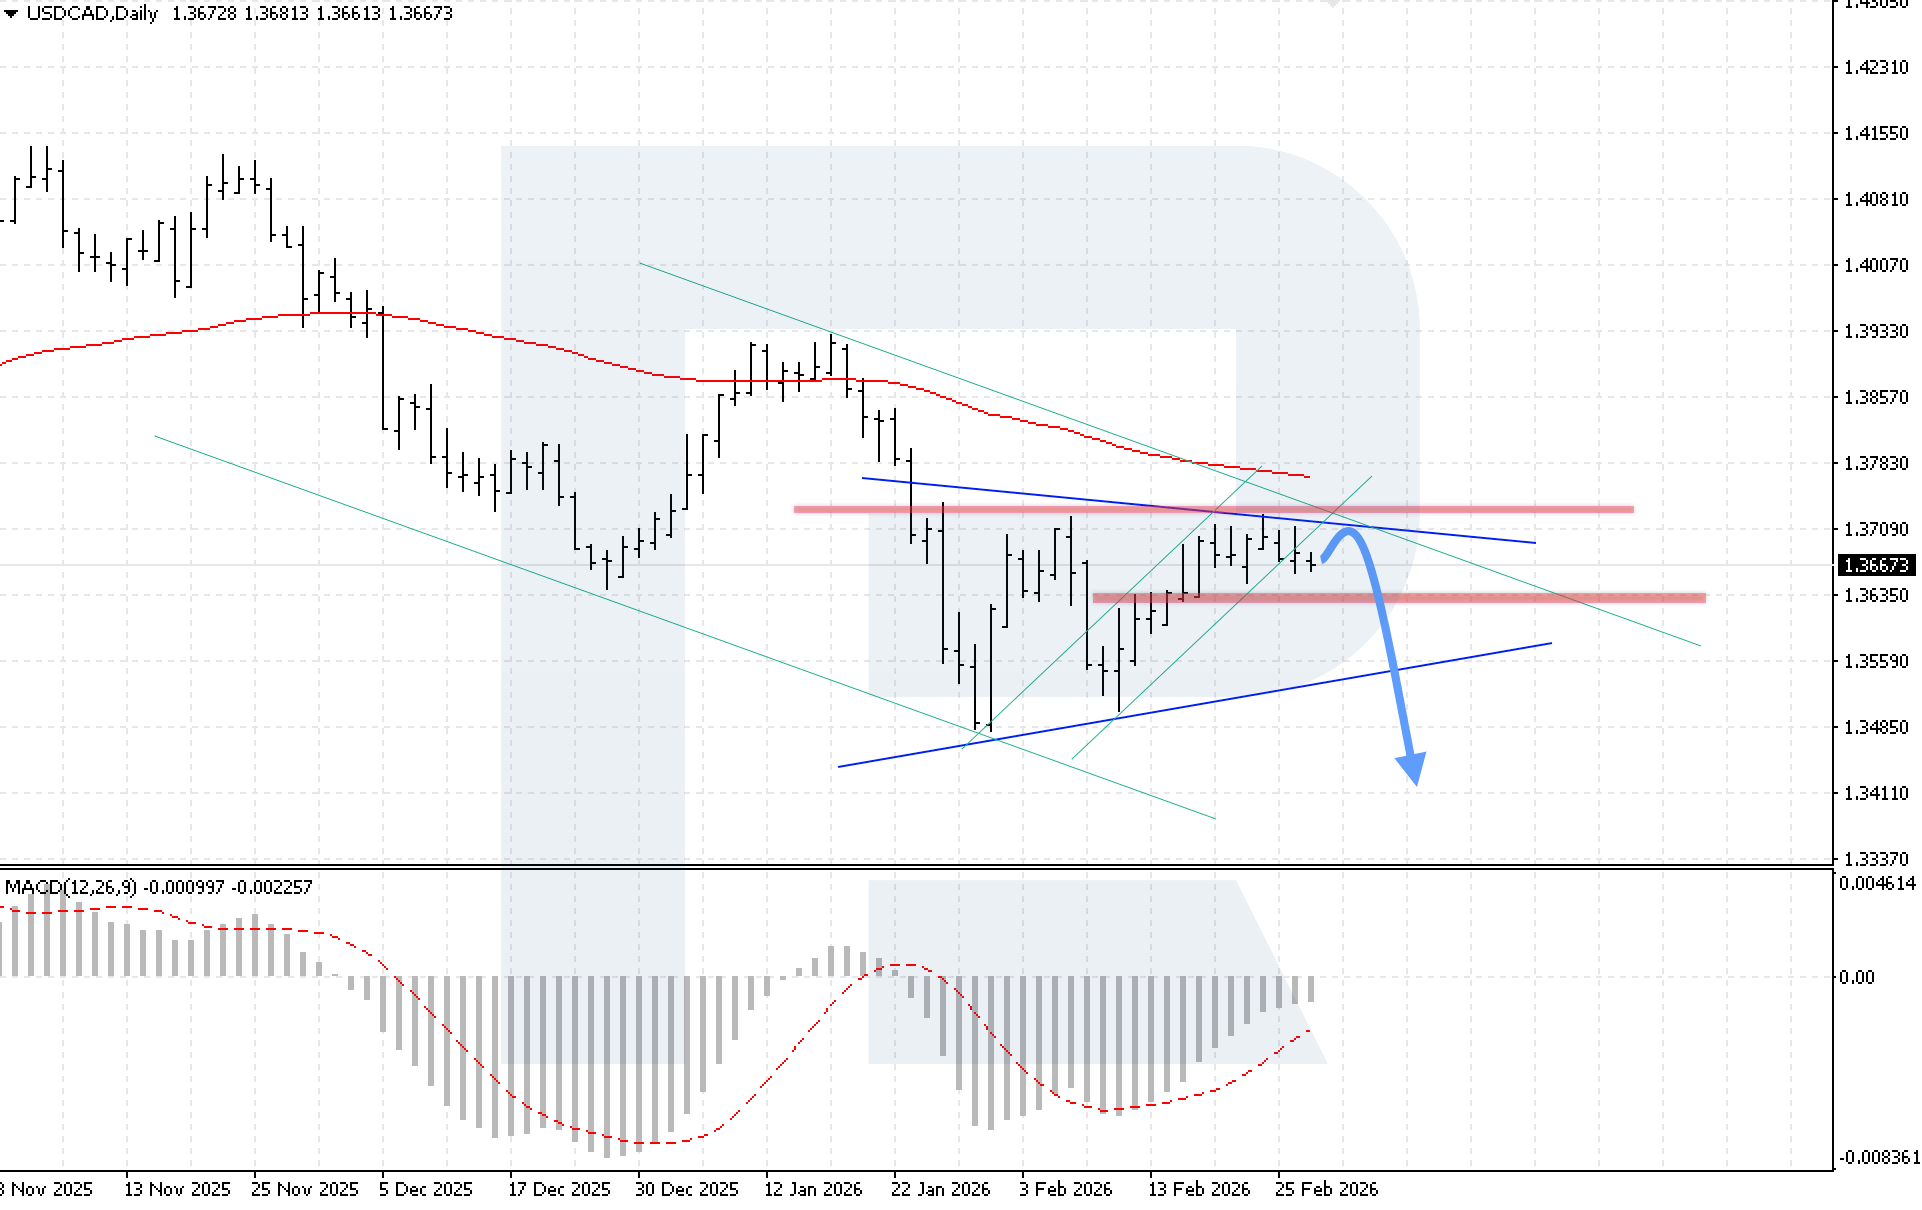
USDCAD forecast
The USDCAD pair ended the week in a correction phase. Sellers continue to hold the key resistance level at 1.3715, limiting the upward momentum. Pressure on the Canadian dollar increased amid a combination of external trade risks and signs of slowing inflation in Canada. Renewed trade tensions pose additional risks to the country’s economy.
Another negative factor was inflation data. In January, the CPI slowed to 2.3%, fuelling expectations that the Bank of Canada could shift from a pause to monetary easing. Weaker inflation pressure reduces the need for the regulator to maintain a tight stance. The fundamental backdrop still favours the US dollar. As long as trade risks persist and the market prices in the probability of rate cuts in Canada, the USDCAD pair retains potential for further growth. However, buyers’ failure to consolidate above 1.3715 increases the likelihood of a deeper correction in the short term.
USDCAD technical analysis
On the daily USDCAD chart, prices continue to move within a Triangle pattern. After testing the upper boundary of the pattern and the resistance level, buying pressure has weakened noticeably, increasing the risk of a corrective decline. A pullback towards 1.3415 remains a priority scenario for the weekly outlook.
MACD confirms a slowdown in bullish momentum: the histogram has stopped rising and is starting to decline, reflecting weaker buying activity. A key condition for the downside scenario is consolidation below 1.3635, which would indicate a breakout below the intermediate support level. An additional signal would be a move below 1.3535, the level of the Triangle’s lower boundary, confirming a deeper decline.
The alternative scenario will unfold if the 1.3765 resistance level is broken. This would mean a breakout out of the Triangle pattern and open the door for continued growth towards higher targets.
USDCAD forecast scenarios
Bearish scenario (main): after a rebound from the Triangle’s upper boundary at 1.3715, selling pressure is expected to intensify, with a downside target at 1.3415.
Bullish scenario (alternative): if prices rise strongly and break above the Triangle pattern’s upper boundary, this would signal continued upside.
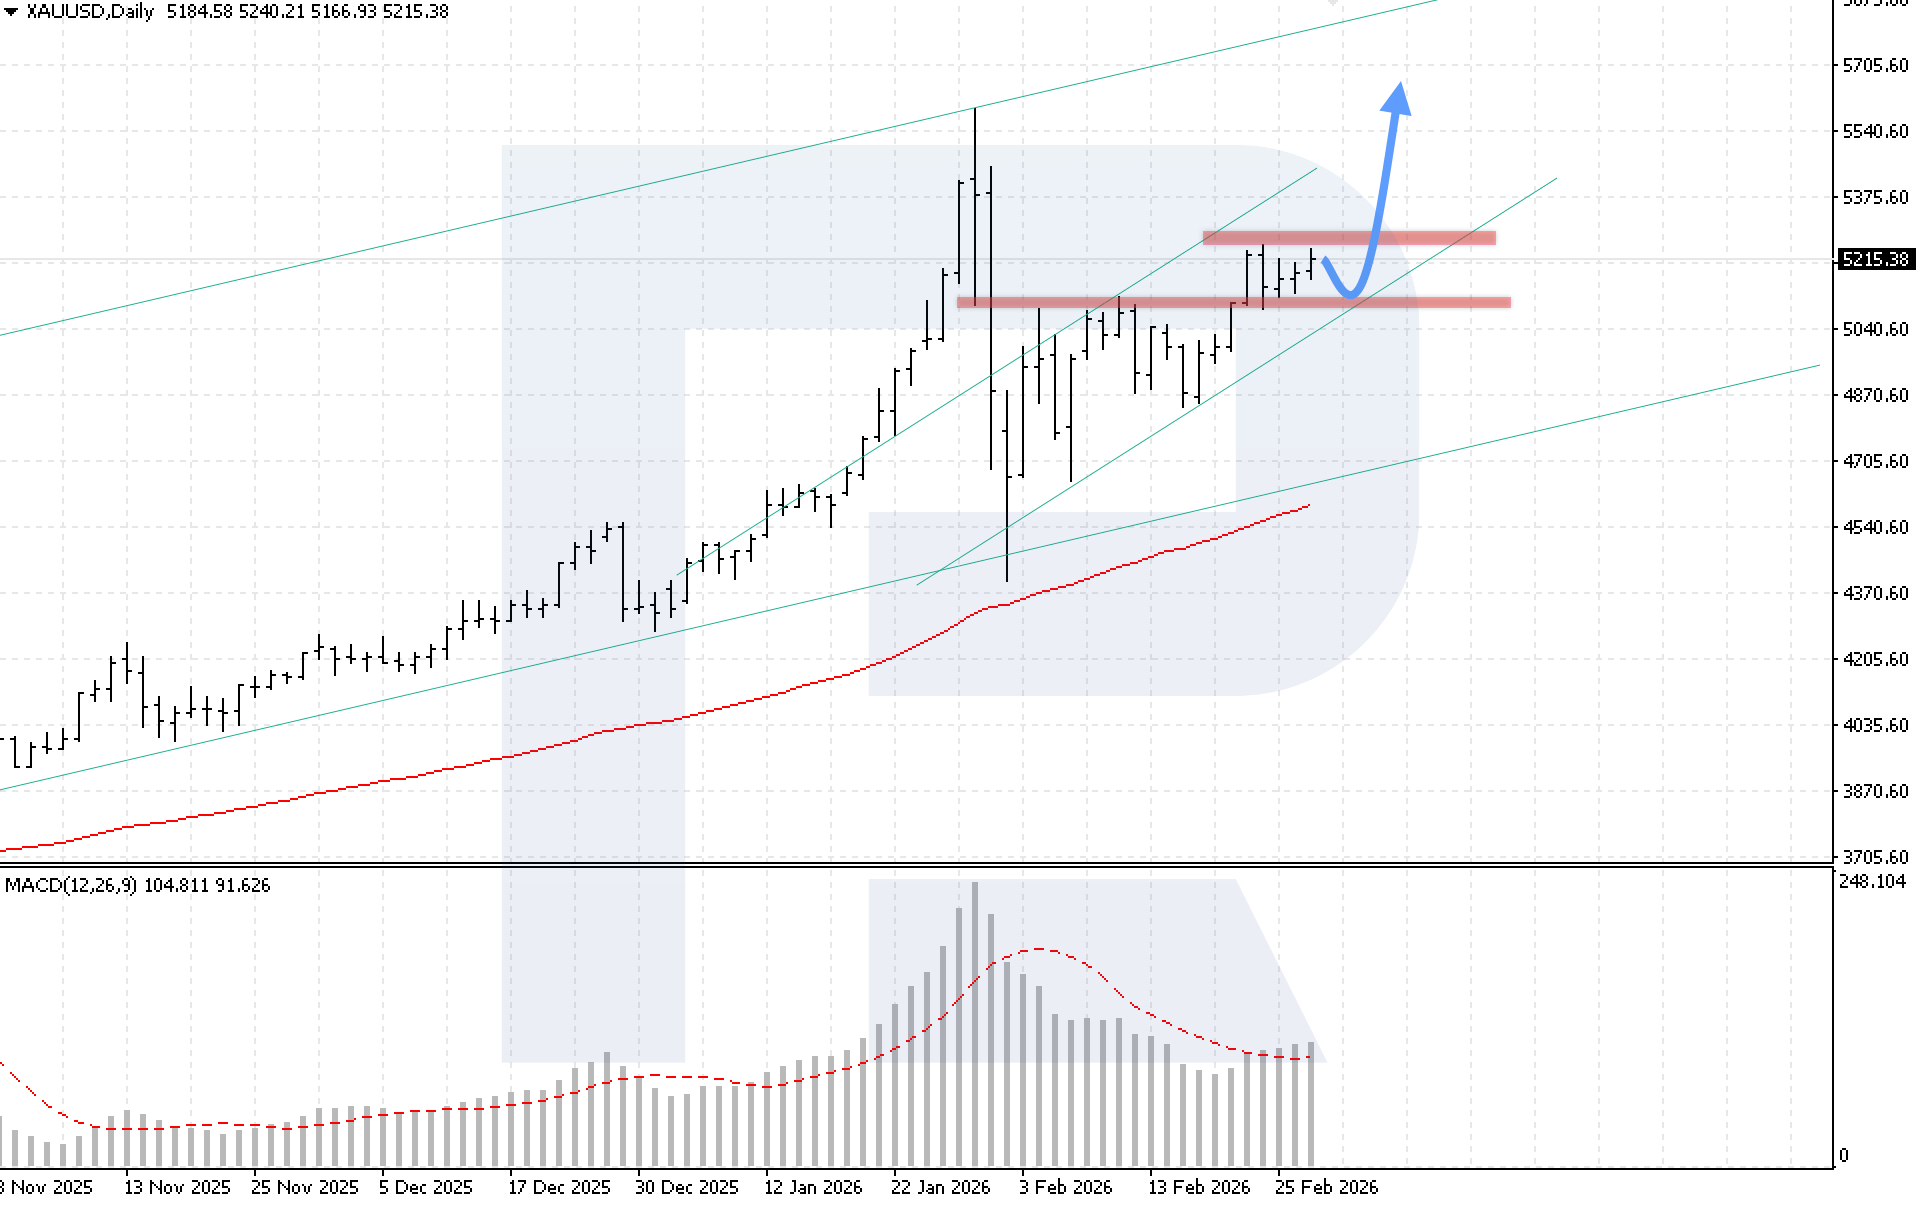
XAUUSD forecast
XAUUSD quotes have been rising for the third consecutive week, but buyers have not yet been able to break through the strong resistance level at 5,105. The situation remains uncertain amid a combination of geopolitical risks and the outlook for the Federal Reserve's monetary policy.
The minutes of the January FOMC meeting showed a split among policymakers, with some participants pointing to the possibility of rate hikes if inflation remains high, which limits demand for gold. Federal Reserve Governor Steven Miran also lowered expectations for rate cuts this year, citing stronger-than-expected economic data.
Despite the current uncertainty, the bullish trend remains in place, and gold still has good chances to continue its upward trajectory.
XAUUSD technical analysis
On the daily XAUUSD chart, bullish pressure is increasing. Buyers are actively testing the nearest resistance level at 5,220 USD, while quotes remain within an ascending channel. At the start of the week, continued growth remains likely, with a target at 5,625 USD.
MACD confirms the end of the correction phase: the histogram has been rising for several consecutive sessions, and the signal line has moved below the histogram, forming a bullish signal. A key condition for the upside scenario is consolidation above 5,220 USD. This would confirm the continuation of the uptrend within the long-term channel.
The alternative scenario will be activated if prices break the channel’s lower boundary and consolidate below 5,045 USD. Such a signal would indicate a move outside the long-term ascending channel and could trigger a deep correction.
XAUUSD forecast scenarios
Bullish scenario (main): a breakout above the key resistance at 5,220 USD would open the strong upside potential. The MACD signal serves as confirmation of the bullish scenario.
Bearish scenario (alternative): if prices rebound from the key resistance level and then fall below 5,045 USD, the potential will open for the bearish correction in gold to continue.
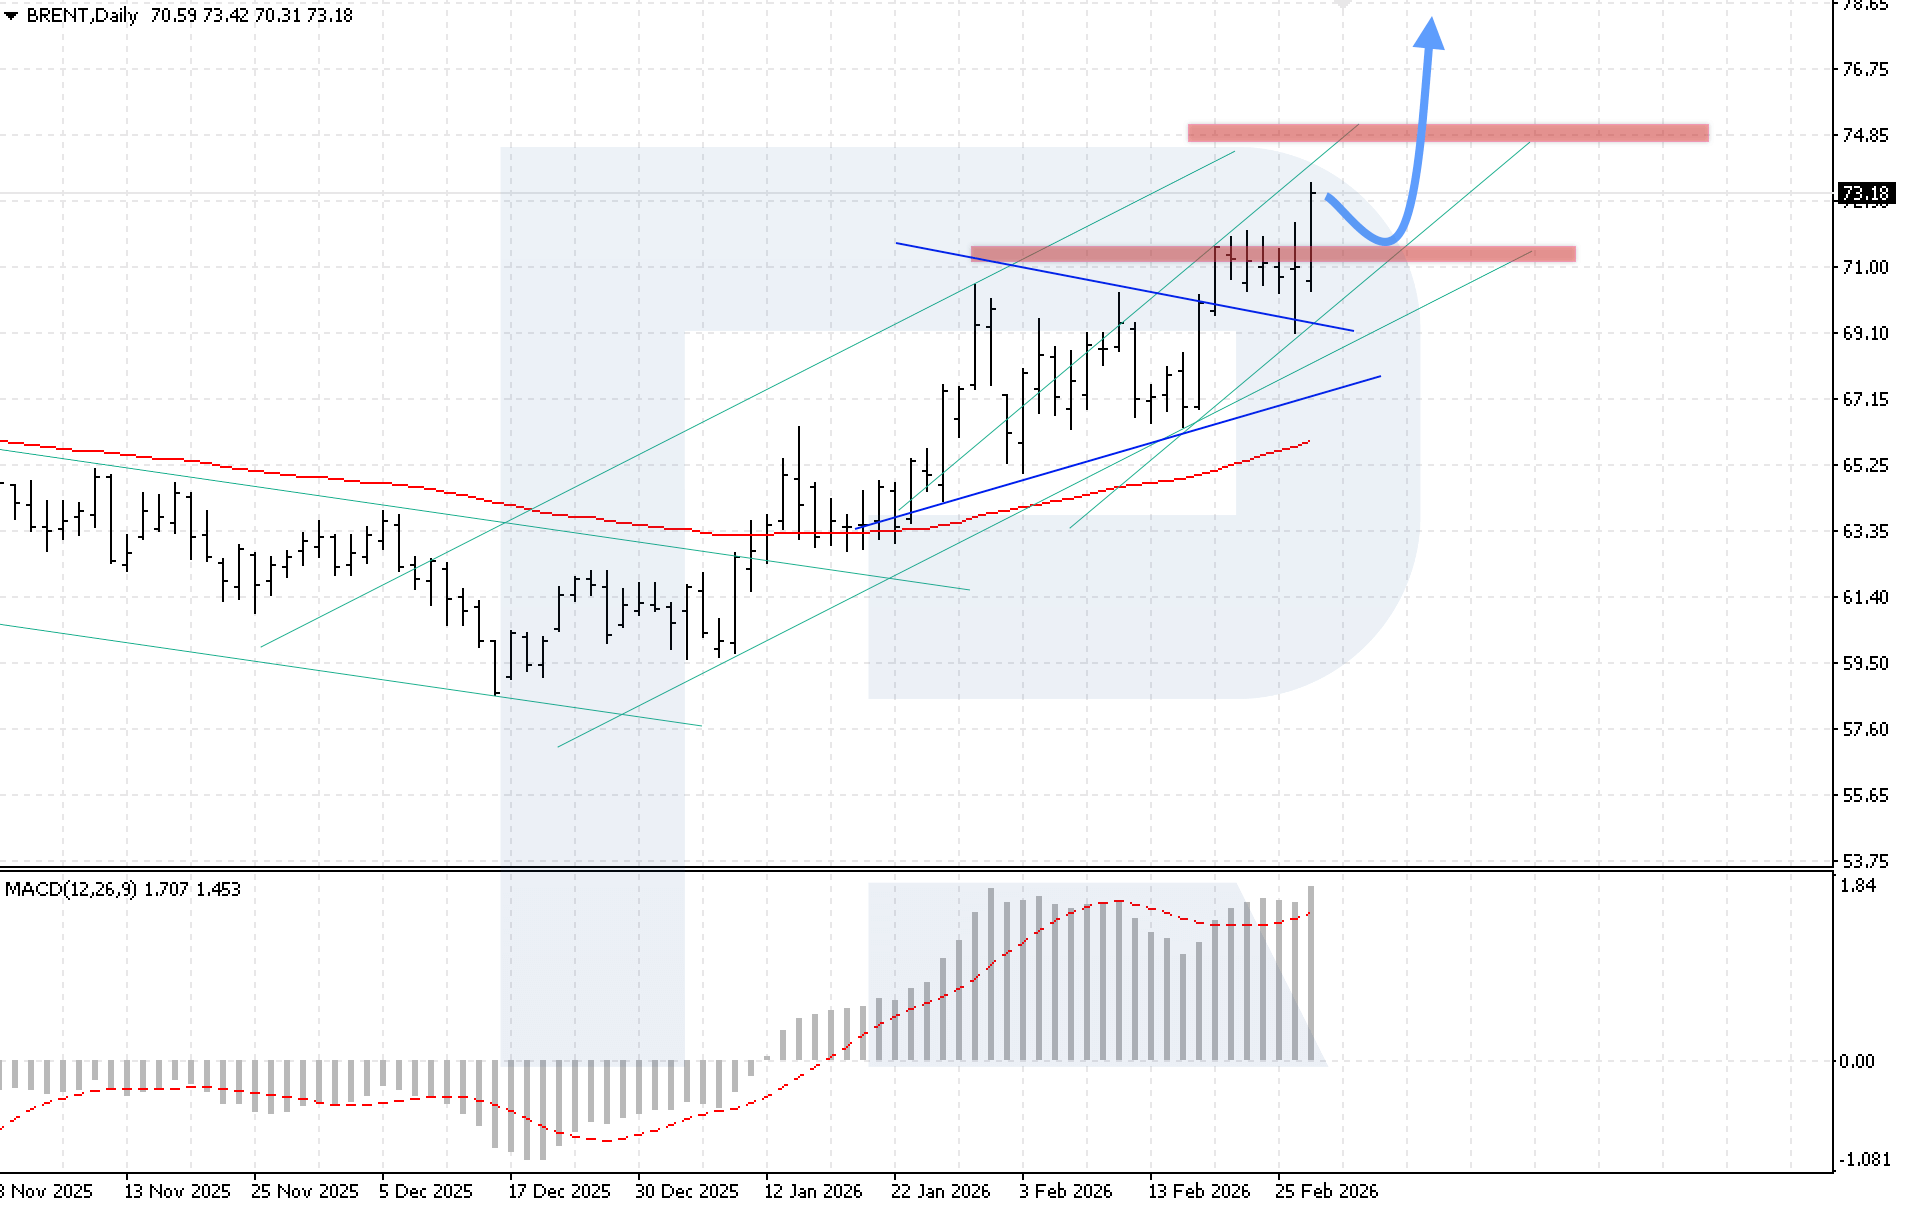
Brent forecast
Brent quotes continue to rise after breaking above the upper boundary of the Triangle pattern. The market received support from the US and Iran agreeing to continue negotiations next week. Iran described the latest meetings in Geneva as showing notable progress, but sources reported disappointment among US officials with the outcome of the talks.
Risks in the market remain, as Iran said it will not allow all enriched uranium to be exported, and a large concentration of US troops in the Middle East increases the threat of escalation. Against this backdrop, geopolitical factors and expectations of renewed negotiations support further Brent gains and make the medium-term oil outlook even more bullish.
Brent technical analysis
On the daily Brent chart, prices have consolidated above the key resistance level and have not yet fully completed the Triangle pattern, indicating a high probability of continued growth this week with a target at 78.00 USD.
MACD confirms the uptrend phase: the histogram is rising actively, and buyers have overcome a bearish divergence, increasing bullish pressure. However, the risk of a new bearish divergence forming remains. A key condition for the bullish scenario this week is consolidation above 74.85 USD.
The bullish scenario will be invalidated if prices break below the support level and then consolidate below 69.05 USD. This would confirm a move below the lower boundary of the long-term bullish channel and open the way to a deeper correction.
Brent forecast scenarios
Bullish scenario (main): If prices rebound from the lower boundary of the bullish channel at 71.35 USD, the potential opens for continued growth with a target at 78.00 USD.
Bearish scenario (alternative): If prices decline and break the lower boundary of the bullish channel with consolidation below 68.05 USD, the downward move is expected to continue.
Editors’ picks
 EURUSD 2026-2027 forecast: key market trends and future predictions
This article provides the EURUSD forecast for 2026 and 2027 and highlights the main factors determining the direction of the pair’s movements. We will apply technical analysis, take into account the opinions of leading experts, large banks, and financial institutions, and study AI-based forecasts. This comprehensive insight into EURUSD predictions should help investors and traders make informed decisions.
 Gold (XAUUSD) forecast 2026 and beyond: expert insights, price predictions, and analysis
Dive deep into the Gold (XAUUSD) price outlook for 2026 and beyond, combining technical analysis, expert forecasts, and key macroeconomic factors. It explains the drivers behind gold’s recent surge, explores potential scenarios including a move toward 4,500 to 5,000 USD per ounce, and highlights why the metal remains a strong hedge during global uncertainty.
Forecasts presented in this section only reflect the author’s private opinion and should not be considered as guidance for trading. RoboForex bears no responsibility for trading results based on trading recommendations described in these analytical reviews.