Weekly technical analysis and forecast (23–27 March 2026)
This weekly technical analysis highlights the key chart patterns and levels for EURUSD, USDJPY, GBPUSD, AUDUSD, USDCAD, gold (XAUUSD), and Brent crude oil to forecast market moves for the upcoming week (23–27 March 2026).
Major technical levels to watch this week
- EURUSD: Support: 1.1540, 1.1440. Resistance: 1.1630, 1.1666
- USDJPY: Support: 157.65, 152.06. Resistance: 160.00, 162.61
- GBPUSD: Support: 1.3117, 1.2947. Resistance: 1.3415, 1.3510
- AUDUSD: Support: 0.6970, 0.6945. Resistance: 0.7025, 0.7080
- USDCAD: Support: 1.3680, 1.3530. Resistance: 1.3777, 1.3955
- Gold: Support: 4,520, 4,300. Resistance: 4,850, 5,050
- Brent: Support: 100.00, 93.00. Resistance: 113.20, 116.00
EURUSD forecast
The coming week in the currency market is unfolding against a backdrop of elevated geopolitical and macroeconomic uncertainty, with growing demand for safe-haven assets and a stronger US dollar remaining the main driver of currency movement. The escalation of the conflict in the Middle East has intensified pressure on the European economy through higher energy prices and weaker investment expectations. Against this backdrop, the euro continues to face pressure from the dollar. According to the latest macroeconomic reviews, the EURUSD pair fell in March to its lowest levels in the past seven months and is trading near the 1.1411 area.
Weak investor sentiment in the eurozone adds to pressure on the euro, reflecting growing concern about the region's economic health and the consequences of geopolitical risks for European industry and energy.
Monetary policy also remains a key factor. The European Central Bank maintains a cautious stance, and most economists expect the deposit rate to remain around 2% throughout 2026. Eurozone economic growth remains moderate, while inflation is gradually stabilising near the target level.
At the same time, the US Federal Reserve continues to maintain relatively hawkish rhetoric amid persistent inflation and strong US macroeconomic data. The yield differential between US and European bonds supports the dollar and increases pressure on the EURUSD pair. Overall, the fundamental backdrop remains largely in favour of the dollar, especially amid elevated geopolitical uncertainty and higher commodity prices.
EURUSD technical analysis
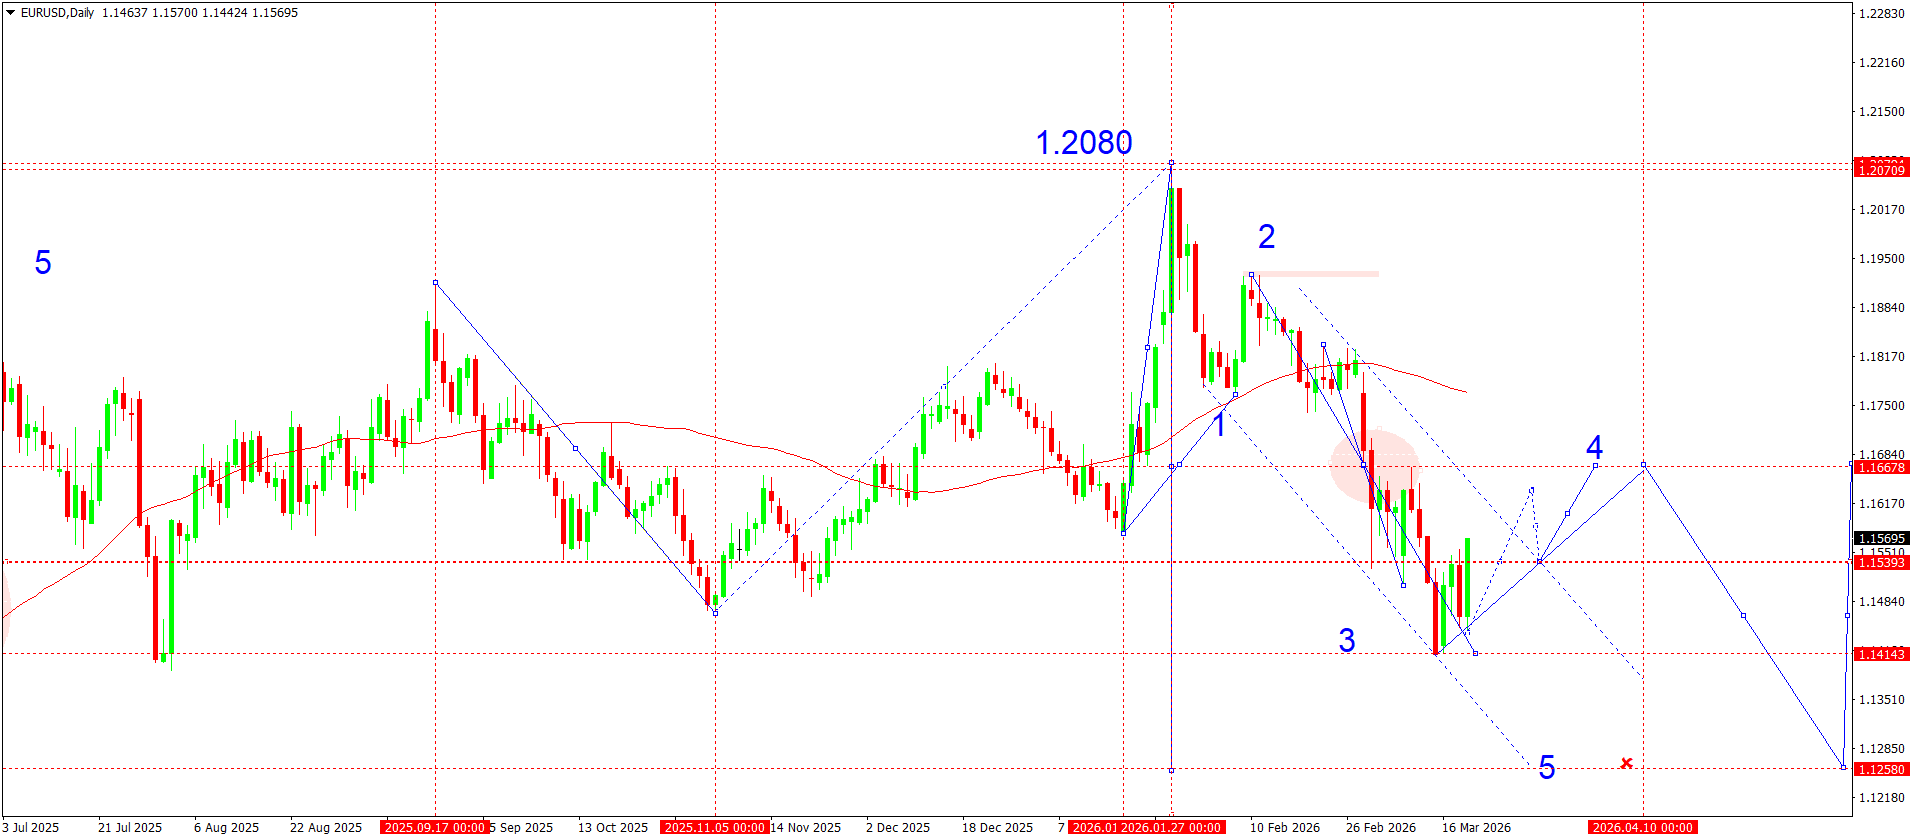
On the daily EURUSD chart, after forming a local high at 1.2080, the market completed the growth phase and shifted into a downward impulsive structure. From that high, a downward wave has formed, which is now developing as an Elliott impulsive structure.
The first downward wave formed a sharp impulse lower to 1.1762. After that, the market formed the second corrective wave, which tested the resistance area near 1.1920 and failed to consolidate above the channel midline. This confirms that the downtrend remains intact.
The price then continued to move lower and formed the structure of the third downward wave to 1.1414. At present, the market has formed a consolidation range around 1.1540 and broken above it. From the perspective of wave structure, the current phase corresponds to the completion of the third wave, and the market may now form the fourth corrective wave with a return to the 1.1666 area. This zone coincides with previous support and resistance levels and may act as a point of temporary market stabilisation.
After the corrective phase is completed, the market is likely to form the final fifth downward wave, with the potential target for this wave in the 1.1260 area, where the next medium-term support zone is located. This structure is also confirmed by the direction of the price channel and persistent downward momentum.
EURUSD forecast scenarios
Bullish (baseline): if the market breaks through the 1.1540–1.1530 area and consolidates above 1.1540, a deeper correction may develop with growth towards 1.1666.
Bearish (alternative): continued downtrend with a downward wave towards the 1.1260 area.
USDJPY forecast
The USDJPY currency pair will end the week near the highs of recent months, trading around the 159.00–159.70 area. The main driver of movement in the currency market remains the combination of geopolitical factors, commodity market dynamics, and expectations regarding the monetary policy of the world’s major central banks. The most significant impact on the yen comes from higher energy prices and increased global uncertainty linked to the conflict in the Middle East. Rising tensions have increased demand for the US dollar as a safe-haven asset, which is putting pressure on the currencies of energy-importing countries, including Japan.
An additional factor remains the divergence in central bank monetary policy. The Federal Reserve maintains relatively hawkish rhetoric, as inflation risks remain persistent and expectations of imminent rate cuts are gradually diminishing. Against this backdrop, US Treasury yields remain elevated, supporting demand for the US dollar.
In Japan, the situation looks more complex. The Bank of Japan is gradually normalising monetary policy after decades of an ultra-loose stance, but the pace of tightening remains limited because of risks to the economy. Recent data showed real wages rising for the first time in more than a year, which may support further rate hikes. However, the weaker yen and higher energy prices are creating additional pressure on the economy, as Japan is almost entirely dependent on oil imports.
Market participants are also paying close attention to the risk of currency intervention. The USDJPY pair has already moved close to the psychologically important 160.00 area, where the Japanese authorities previously carried out active intervention. Representatives of Japan’s Ministry of Finance have already stated their readiness to respond to excessive FX volatility, which may limit further yen weakness.
USDJPY technical analysis
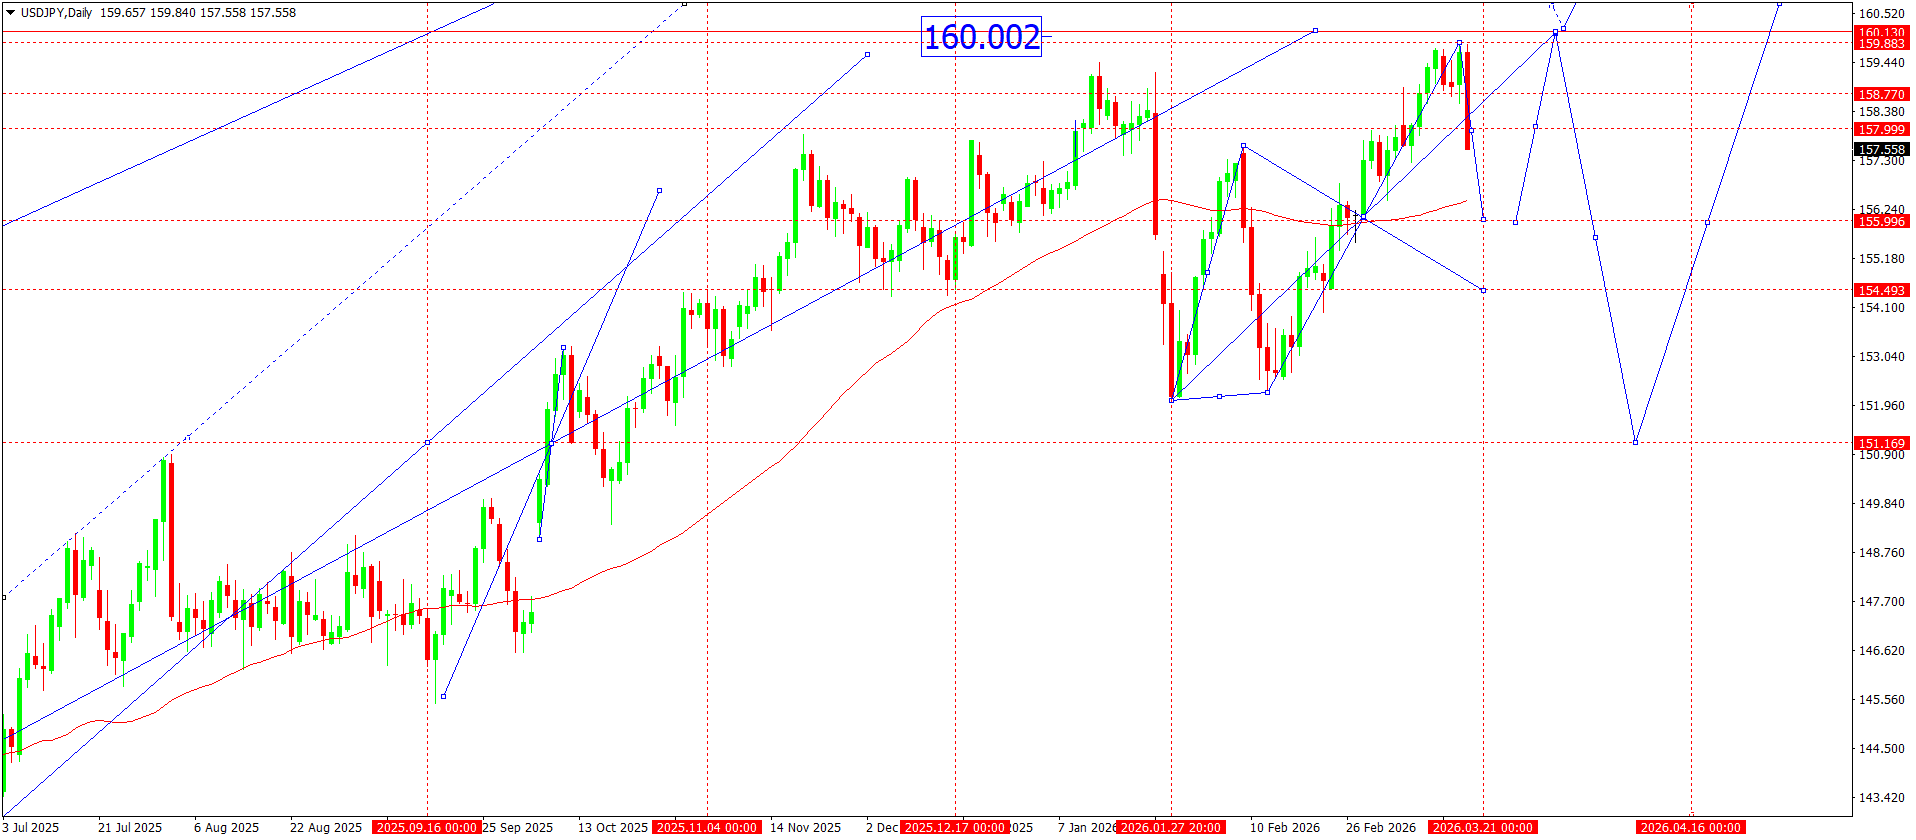
From a technical perspective, the daily USDJPY chart continues to show a firm uptrend. The price continues to move within an ascending channel that formed after the reversal from the 152.00 area. The last correction formed a local base, after which the market began to build a new growth structure. At the moment, the price is testing the interim resistance area around 159.80–160.00, where an important level aligned with previous highs is located.
The current structure points to the formation of an upward wave with potential for continued growth. After the local correction is completed, the market may form another growth wave towards the 160.00 area, which acts as a key pivot point in the short term. Consolidation above this level will open the way to the next medium-term target near 162.61, which is marked on the chart as the upper boundary of the potential wave structure.
At the same time, it is important to take into account the higher volatility near 160.00. This area may act as a profit-taking zone and trigger a corrective move. If a pullback develops, the nearest support level lies around 157.65, where the local consolidation area and the short-term rising channel line are located. A deeper correction may take the market towards 152.06, where a key reversal point formed previously.
Thus, the market structure remains predominantly bullish, but the approach towards the area of possible intervention by the Japanese authorities increases the probability of sharp corrective moves.
USDJPY forecast scenarios
Bearish (baseline): a correction from the 160.00 area followed by a decline to 157.65.
Bullish (alternative): if the market breaks 160.00 and consolidates above it, an upward wave towards 162.61 may develop.
GBPUSD forecast
The fundamental backdrop for the GBPUSD pair over the coming week remains tense and is largely determined by the combination of monetary policy from the major central banks and geopolitical factors. The key event for the market will be the so-called ‘central bank week’, when the Federal Reserve and the Bank of England will make interest rate decisions almost simultaneously. These events traditionally generate elevated volatility in the currency market and shape the main medium-term expectations of investors.
Another factor of instability remains the geopolitical situation in the Middle East. Higher tensions in the region have led to higher energy prices and stronger demand for the US dollar as a safe-haven asset. Against the backdrop of spikes in oil prices, investors have once again started buying the US currency more actively, which has put pressure on sterling.
UK economic data also remain mixed. Economic growth remains weak – GDP is showing virtually no momentum, while unemployment is gradually rising. At the same time, inflation remains above the Bank of England’s target, which complicates monetary policy decisions. As a result, uncertainty remains in the market about the timing of possible rate cuts.
Another risk factor may be higher inflation pressure because of expensive energy. Economists warn that if the Middle East conflict escalates further, inflation in the UK may accelerate again, which would potentially delay the Bank of England’s easing cycle.
On the US dollar side, the labour market remains strong and inflation indicators remain firm. Recent US inflation data confirms that the Fed is maintaining a cautious stance regarding rate cuts, which supports demand for the US currency.
GBPUSD technical analysis
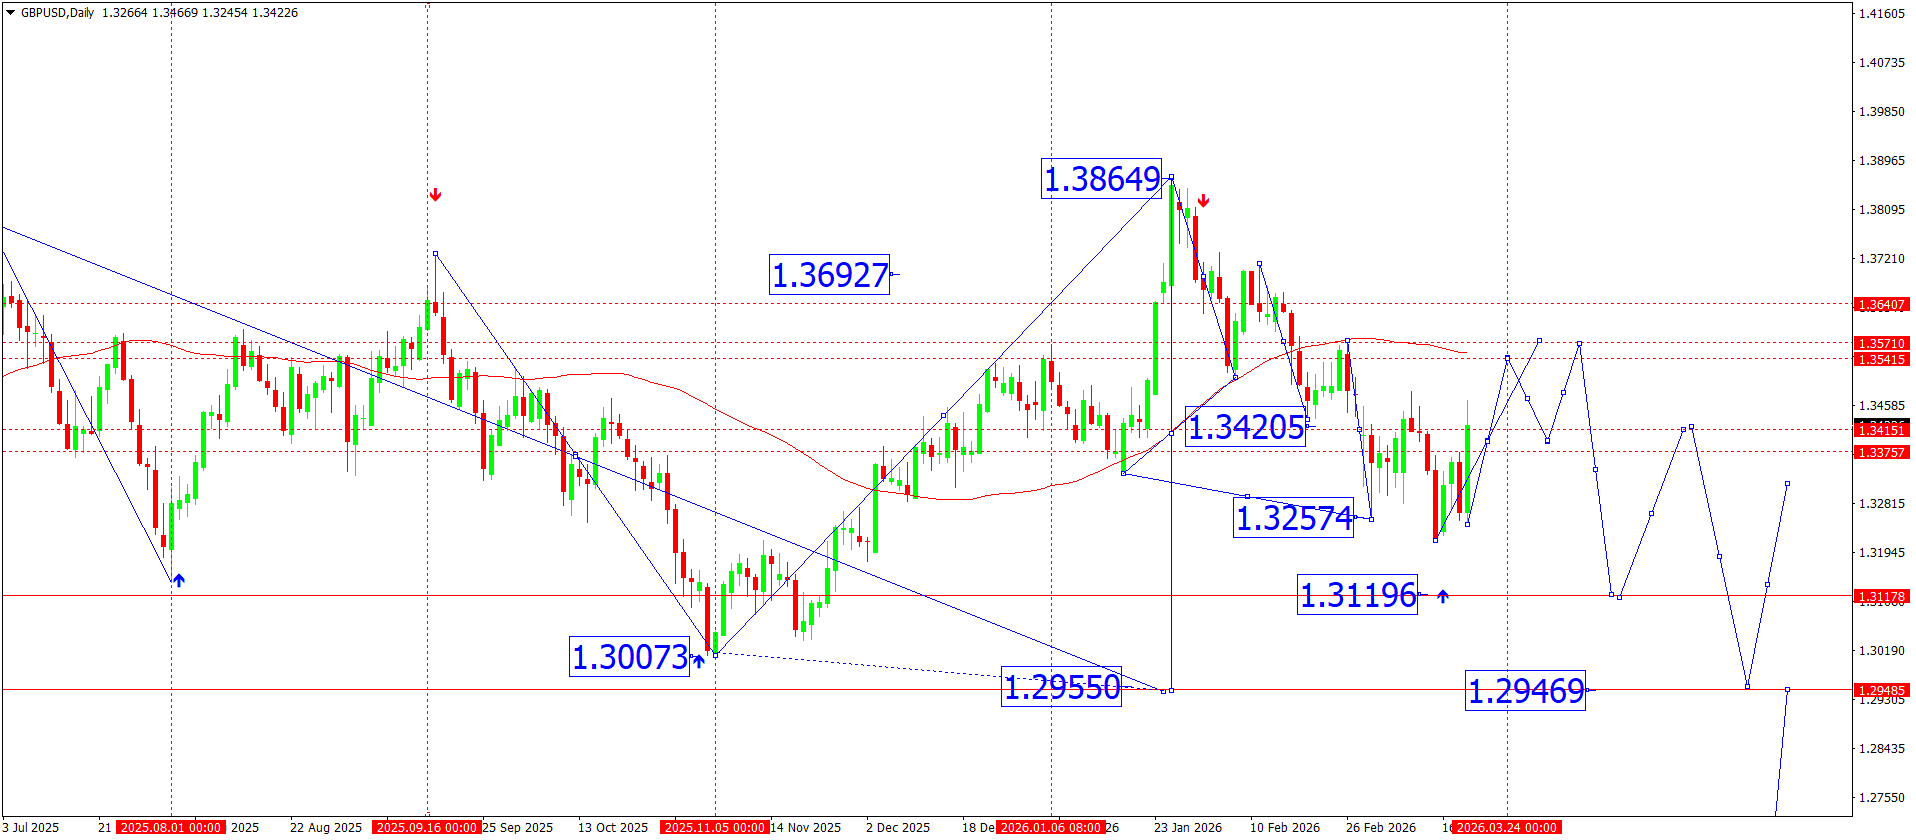
On the daily GBPUSD chart, the market completed the formation of an upward wave structure with a peak near 1.3864. After reaching that level, a downward wave phase began, which gradually transformed into downward momentum.
The first key target of the decline was reached in the 1.3510 area, where an interim consolidation zone formed. However, the market failed to hold below this mark and corrected back to 1.3710. Selling pressure then intensified. As a result, the price continued to decline towards the next significant level at 1.3415, which in the current structure acts as a local pivot point.
The current dynamics point to the formation of a downward wave within a broader structure. From a technical perspective, the market continues to move towards the key support level at 1.3117, a local target of the current momentum.
If this mark is broken, the downward move may accelerate. The next medium-term target will be 1.2946, where the previous reversal impulse zone and a potential new market base are located.
The indicator structure also points to persistent selling pressure. After reversing from the January highs, the market is gradually forming a sequence of lower lows, confirming the first phase after the previous uptrend.
At the same time, short-term corrective rebounds remain possible. If the market returns above 1.3356, it may test the 1.3415 area, where the nearest significant resistance and a potential new selling zone are located.
Thus, the overall technical structure suggests a downtrend, with a possible test of deeper support levels in the coming weeks.
GBPUSD forecast scenarios
Bearish scenario (main): continued downtrend with a target at 1.3117.
Bullish scenario (alternative): if the market consolidates above 1.3355, a rise towards 1.3415 is possible.
AUDUSD forecast
Last week, the dynamics of AUDUSD were shaped by a mixed fundamental backdrop. The main pressure on the Australian dollar continues to come from global monetary policy and commodity market dynamics. The Fed is still maintaining cautious rhetoric regarding the pace of future rate cuts. Fed officials note that inflation in the US is slowing unevenly, which requires the preservation of relatively tight financial conditions. Against this backdrop, the US dollar continues to enjoy firm demand from investors as a safe-haven asset.
Another important factor for the pair remains the dynamics of the Chinese economy, which directly affects the Australian currency. The latest data on China’s industrial sector shows a moderate recovery, but growth remains below expectations. For Australia, this means weaker external demand for commodities, including iron ore and metals. Lower commodity prices traditionally put pressure on the Australian dollar.
At the same time, the Reserve Bank of Australia is maintaining a cautious stance on further monetary policy. The regulator continues to note that inflation in the country is gradually slowing, but remains above target levels. This limits the scope for rapid policy easing and at the same time supports expectations that current interest rates will be maintained. Nevertheless, markets are pricing in the probability of a gradual shift towards looser policy during 2026.
Additional influence on AUDUSD comes from swings in the commodity market and changes in global risk appetite. When demand for safe-haven assets rises, the US dollar receives additional support, whereas stronger interest in risk assets may support the Australian dollar.
AUDUSD technical analysis
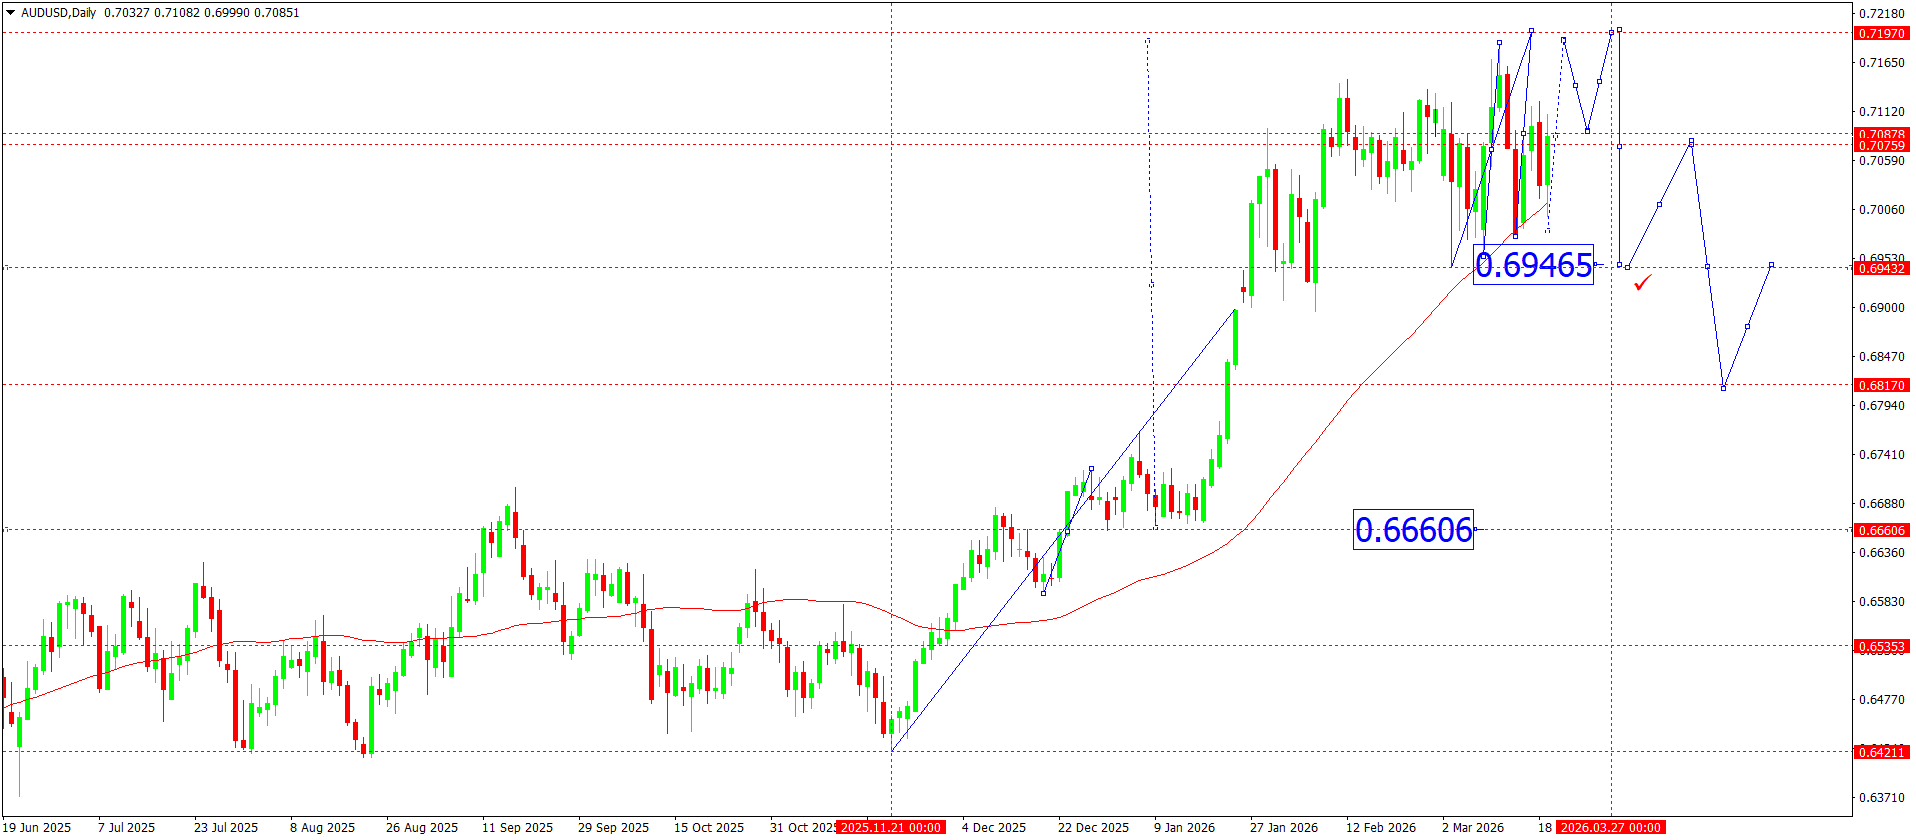
On the daily AUDUSD chart, the market previously formed a steady upward impulsive growth structure starting from the 0.6419 area. This momentum carried the price into the key resistance zone near 0.7186, after which a phase of correction and local consolidation began.
At present, the price is holding above the important technical support at 0.6926, which acts as the local equilibrium centre of the market. This area coincides with the zone of previous breakouts and now acts as a short-term trend pivot point. A decline to this mark can be viewed as a test of the broken level.
The 0.7081 area acts as the nearest resistance within the current range. Several attempts to consolidate above this zone have so far failed to lead to a sustainable continuation of the upmove. This indicates the presence of sellers in the upper part of the range.
From the perspective of wave structure, the market has completed the impulsive growth phase and is now forming a higher-order corrective structure. Within this correction, the price may continue to move towards 0.6975. After that, we consider the probability of the start of an upward move towards 0.7080. We then expect a decline into the deeper support zone at 0.6925. On the chart, a potential longer-term downward structure can be seen towards 0.6777, where the next important support zone and the potential target of the corrective move are located.
A deeper correction may bring the price into the 0.6665 area, which corresponds to the lower boundary of the medium-term range and the previous accumulation zone. This area may act as the key point for forming a new medium-term growth wave.
At the same time, keeping the price above 0.6926 leaves open the possibility of forming a new growth wave within the current ascending channel. In that case, the market may make another attempt to test resistance at 0.7081 and then head towards a retest of the high near 0.7186.
AUDUSD forecast scenarios
Bearish scenario (baseline): a decline from the 0.7081 area with the correction continuing towards 0.6926 and then to 0.6777.
Bullish scenario (alternative): if the market consolidates above 0.7000, a rise towards 0.7080 is possible.
USDCAD forecast
In the currency market, the coming week will unfold against a backdrop of ongoing uncertainty regarding future policy from the Federal Reserve and the Bank of Canada. The main factor for US dollar dynamics remains interest rate expectations and US inflation data. Recent macroeconomic releases show that inflation pressure in the US economy is easing more slowly than the market had expected. This supports expectations that the Fed may keep a tighter monetary policy for longer. Against this backdrop, the dollar remains resilient against most currencies.
For the Canadian dollar, the oil market remains an important factor, as Canada is one of the largest oil exporters. Swings in Brent and WTI prices directly affect export revenue inflows and, accordingly, the exchange rate of the Canadian currency. When oil prices rise, the Canadian dollar usually receives support, whereas weaker commodity prices lead to CAD weakness.
The Bank of Canada has maintained cautious rhetoric in recent months. The regulator notes slower economic activity and a gradual easing of inflation pressure. This strengthens expectations that the BoC may shift to a softer policy earlier than the Fed. The difference in interest rate expectations between the US and Canada remains the key driver for USDCAD.
Additional volatility in the coming week may come from Canadian inflation data, US labour market statistics, and commodity market dynamics. Any signals of a more hawkish Fed stance may support the US dollar, whereas higher oil prices may strengthen the Canadian dollar.
USDCAD technical analysis
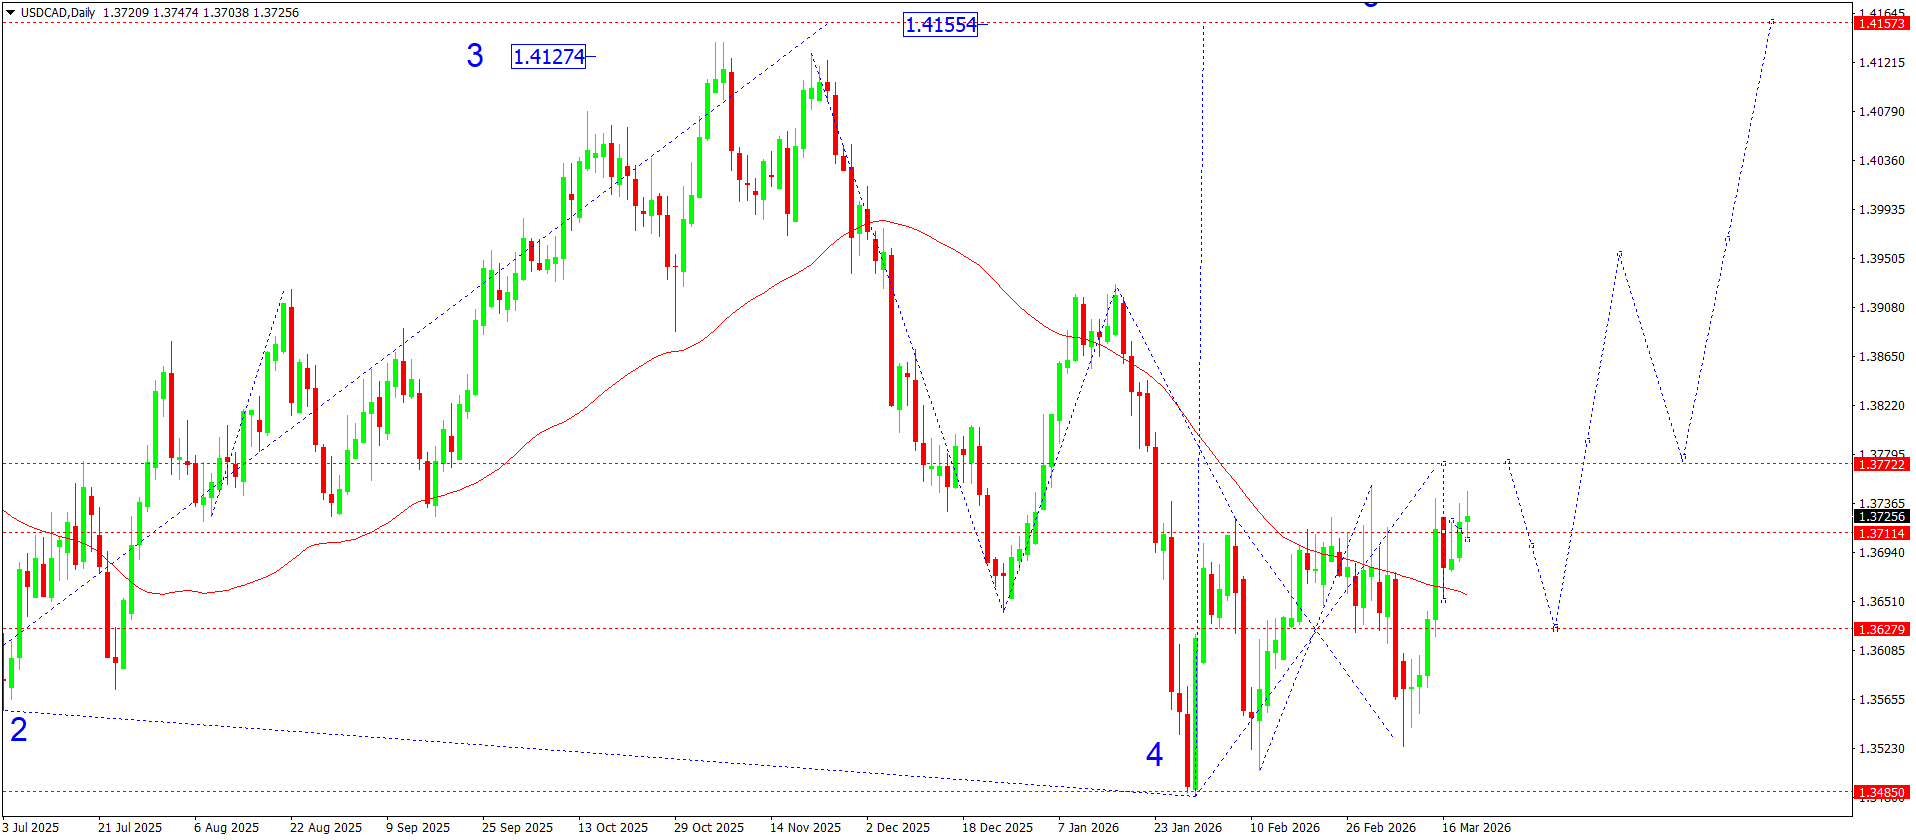
On the daily USDCAD chart, the market previously completed the formation of an upward wave structure with a peak near 1.4124, which corresponds to the top of the third higher-order wave. After that, quotes shifted to the formation of a corrective structure, which ended with a decline to the 1.3485 area, where wave 4 formed.
From that level, the market attempted a recovery. A growth wave to 1.3752 and a decline to 1.3535 were completed. At present, a fifth growth wave is forming towards 1.3777. This is the first target. At the moment, quotes are forming a consolidation range between 1.3740 and 1.3646. This range can be viewed as an accumulation phase before the next impulsive move.
The current structure resembles a narrowing consolidation range, which may act as a preparatory phase for the formation of a new impulsive growth wave. Within Elliott wave structure, the current consolidation may be viewed as the formation of a local corrective structure inside a potential higher-order fifth wave.
From a technical perspective, the key signal for further growth will be a breakout of the 1.3800 area. In that case, the market may form a new upward impulse with a target in the 1.3950 area and then towards the upper boundary of the medium-term move. The main medium-term target for the wave structure is in the 1.4155 area, where the previous high is located.
At the same time, the market’s inability to consolidate above 1.3777 may lead to continued sideways movement inside the current range. If support at 1.3650 is broken, the probability of a deeper correction will increase, with a test of the lower boundary of the structure near 1.34850. This level acts as a key support zone for buyers and may become a reversal point for a new upward wave.
Thus, the current technical picture points to a consolidation phase after the completion of the corrective wave. The probability of a breakout from the range towards the resumption of the medium-term uptrend remains in place.
USDCAD forecast scenarios
Bullish (main): the market may find support at 1.3648 and continue to rise to 1.3777.
Bearish (alternative): a decline to 1.3628 with a possible test of the 1.3485 support level.
XAUUSD forecast
At the end of the second week of March, gold remains highly volatile against a backdrop of macroeconomic factors and geopolitical uncertainty. The main driver of XAUUSD dynamics remains expectations regarding US monetary policy. Market participants continue to assess US macroeconomic data closely, including inflation and labour market figures, which may influence future decisions by the Fed. Recent reports show that inflation pressure remains persistent, forcing investors to revise their expectations about the timing of possible Fed easing.
Additional support for gold comes from ongoing demand for safe-haven assets. Investors continue to factor in geopolitical risks, as well as uncertainty surrounding global economic growth. At the same time, higher US Treasury yields periodically put pressure on precious metals, as they increase the opportunity cost of holding gold. Meanwhile, US dollar dynamics remain the key factor behind short-term fluctuations in XAUUSD. If the dollar continues to correct after its strong rise in previous months, this may provide additional support for gold.
XAUUSD technical analysis
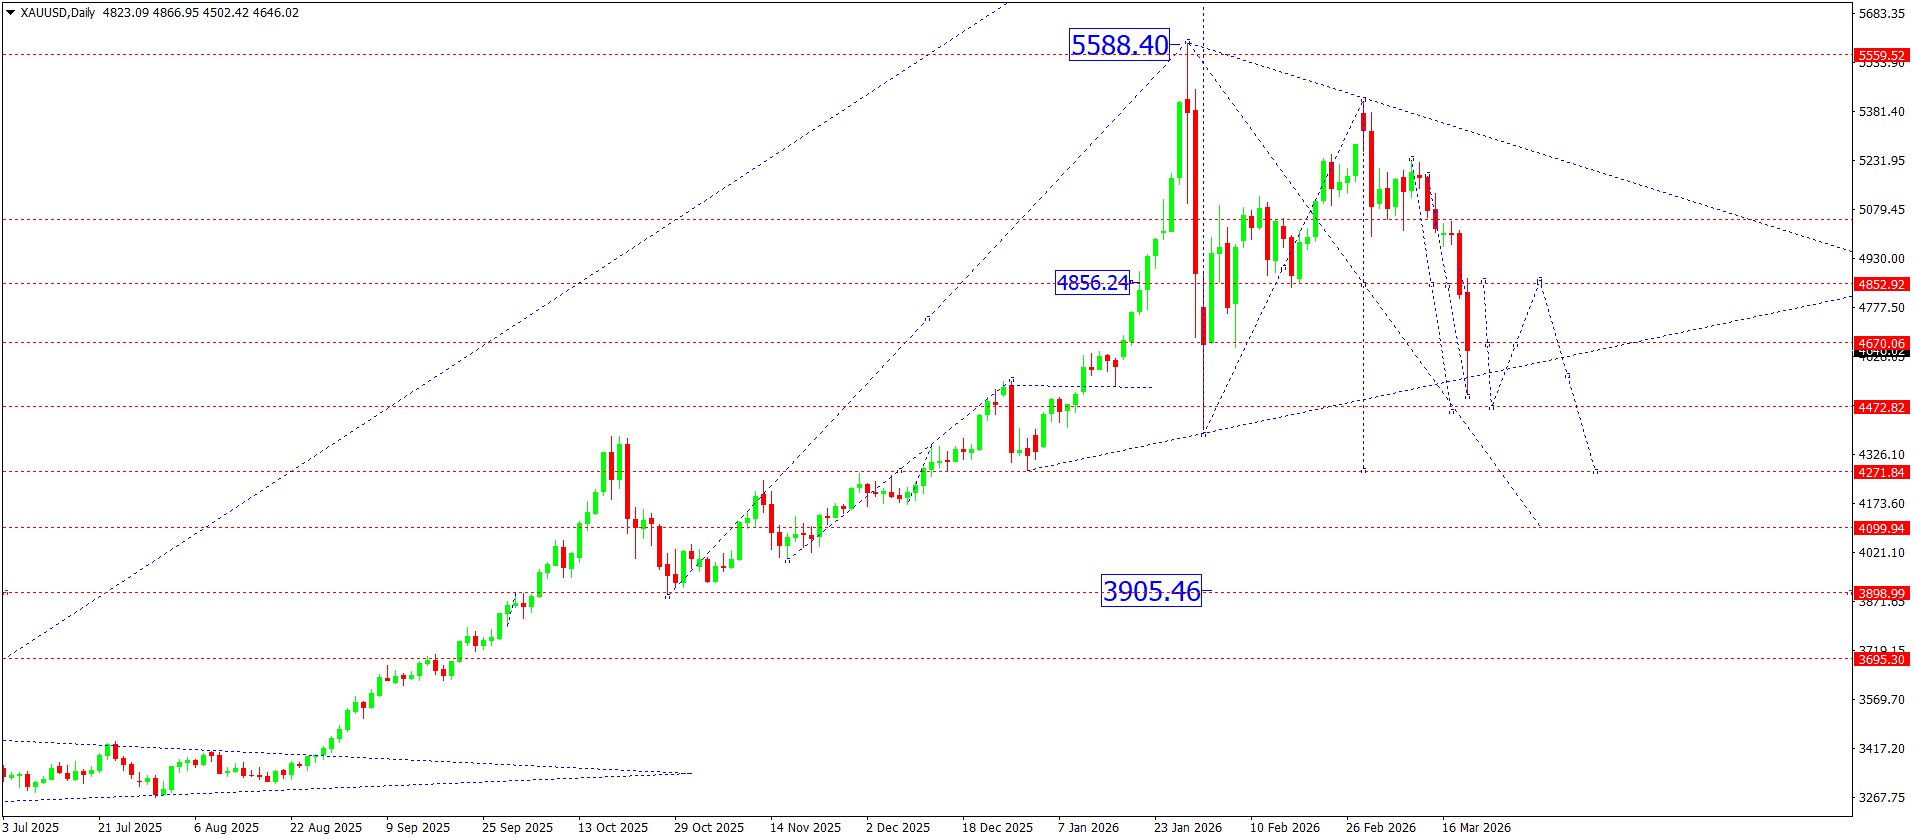
From a technical perspective, on the daily XAUUSD chart the market completed a growth structure to 5,412, after which a corrective phase followed. The correction target stands at 4,949. In practice, a consolidation range can be identified around 4,888. After the correction is completed, it will be relevant to consider the start of the next growth wave towards 5,939.
At present, the market is in a phase of local consolidation in the 4,949–4,888 range, forming a short-term corrective structure.
From the wave structure perspective, it is possible to assume that a corrective phase is forming after the strong upward impulse. The current consolidation may act as accumulation ahead of the next directional move. The market finds support around 4,500, where local reversal points formed previously and where the buyer interest zone is located. If this area holds, the market may form a new growth wave. In the event of upward development, the nearest target may be the 5,000 level.
If market pressure intensifies, a breakout of the 4,997–5,000 area may lead to an extension of the correction lower. In that case, the next downside target may be the zone around 4,270, where an important medium-term trend support area is located.
Bullish (baseline): corrective growth to 4,840 with a possible extension of the move towards 5,050.
XAUUSD forecast scenarios
Bullish scenario (main): corrective growth to 4,840 with a possible extension of the move towards 5,050.
Bearish scenario (alternative): if the market fails to consolidate above 4,550 and continues to decline, movement towards 4,300 and then further towards 4,000 is possible.
Brent forecast
The oil market is ending the current week amid elevated volatility and a persistent upward impulse. The main driver of price action remains the combination of fundamental factors: restricted output policy by OPEC+ countries, geopolitical tension in the Middle East, and gradually improving demand expectations from the world’s largest economies.
The market continues to receive support from the production-cut policy followed by OPEC+ alliance members. The supply restriction keeps a structural deficit in the oil market, especially against the backdrop of seasonal demand recovery in Asia. Another growth factor comes from signs of stabilisation in industrial demand in China, which remains the world’s largest importer of raw materials. Improving macroeconomic expectations in the region are supporting higher energy consumption.
On the other hand, US dollar dynamics continue to affect commodity markets. Investors are closely monitoring the Federal Reserve’s monetary policy. Keeping interest rates relatively high supports the US currency and may partly limit further growth in oil prices. Nevertheless, at present, the fundamental balance of supply and demand remains in favour of buyers.
Oil is also supported by risks of supply disruptions and continued uncertainty in global energy logistics. Together, these factors form a positive fundamental backdrop for the oil market over the coming week.
Brent technical analysis
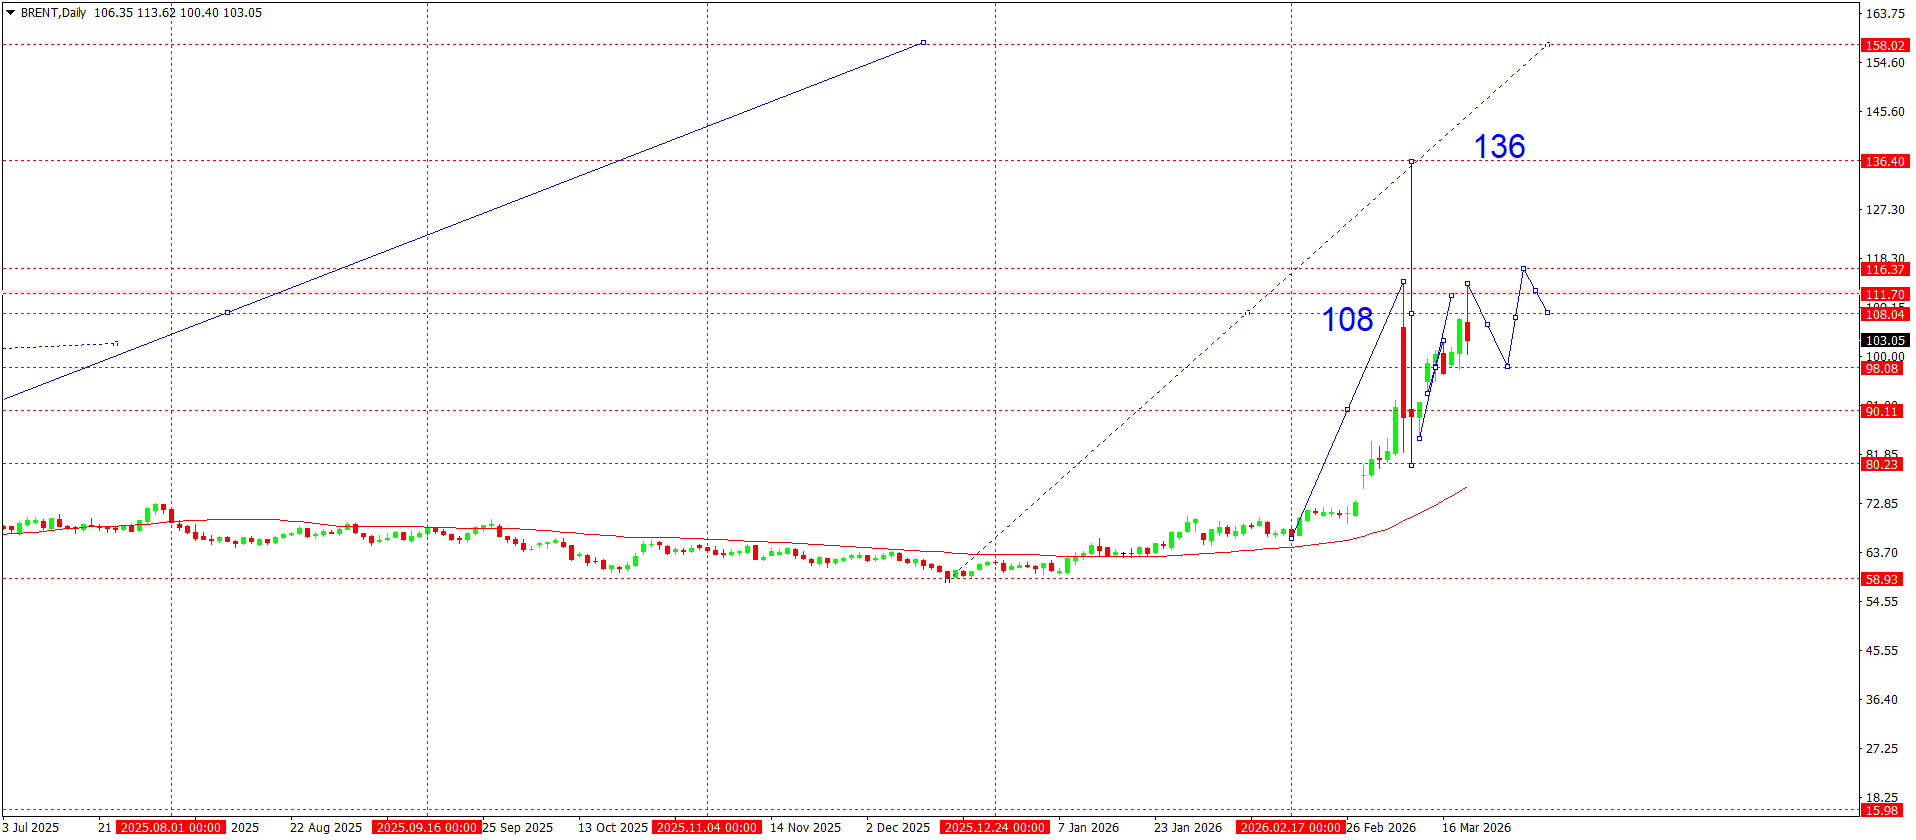
From a technical perspective, the daily Brent chart continues to show a firm uptrend after the powerful impulsive growth that began in mid-February. Price confidently broke above the long-term consolidation area and formed a strong impulsive wave that took the market from around 70 dollars to above 100.
After forming a local high near 108, the market shifted into a corrective consolidation phase. The chart is forming an upward structure inside an ascending channel. The move looks like a sequence of waves, where each new high forms above the previous one, indicating that buyers remain in control.
The 98–103 area acts as the key short-term balance zone. It is in this zone that the market is trying to form a new base for further movement. As long as price remains above this area, the ascending channel structure remains relevant.
The local target of the current upward structure is located around 116, where a strong impulsive high previously formed. A breakout above this zone may lead to an acceleration of the upward move. According to the wave structure, consolidation above this level may open room for the formation of a new impulsive wave with potential towards the long-term target near 136.
A decline below the 101 area would be the first signal of weakening in the current upward structure. In this case, the market may shift into a deeper correction with a test of the next support area.
Brent forecast scenarios
Bullish scenario (main): if the market consolidates above 103.20 and continues to move within the ascending channel, a retest of 116.00 is likely, with potential for further growth.
Bearish scenario (alternative): a breakout below 101.00 and a move below the boundary of the ascending channel may open correction potential towards 94.00.
Editors’ picks
 EURUSD 2026-2027 forecast: key market trends and future predictions
This article provides the EURUSD forecast for 2026 and 2027 and highlights the main factors determining the direction of the pair’s movements. We will apply technical analysis, take into account the opinions of leading experts, large banks, and financial institutions, and study AI-based forecasts. This comprehensive insight into EURUSD predictions should help investors and traders make informed decisions.
 Gold (XAUUSD) forecast 2026 and beyond: expert insights, price predictions, and analysis
Dive deep into the Gold (XAUUSD) price outlook for 2026 and beyond, combining technical analysis, expert forecasts, and key macroeconomic factors. It explains the drivers behind gold’s recent surge, explores potential scenarios including a move toward 4,500 to 5,000 USD per ounce, and highlights why the metal remains a strong hedge during global uncertainty.
Forecasts presented in this section only reflect the author’s private opinion and should not be considered as guidance for trading. RoboForex bears no responsibility for trading results based on trading recommendations described in these analytical reviews.