Weekly technical analysis and forecast (30 March–3 April 2026)
This weekly technical analysis highlights the key chart patterns and levels for EURUSD, USDJPY, GBPUSD, AUDUSD, USDCAD, gold (XAUUSD), and Brent crude oil to forecast market moves for the upcoming week (30 March–3 April 2026).
Major technical levels to watch this week
- EURUSD: Support: 1.1455, 1.1360. Resistance: 1.1680, 1.1805
- USDJPY: Support: 157.50, 156.10. Resistance: 159.88, 160.20
- GBPUSD: Support: 1.3257, 1.3119. Resistance: 1.3414, 1.3495
- AUDUSD: Support: 0.6893, 0.6835. Resistance: 0.7008, 0.7040
- USDCAD: Support: 1.3780, 1.3730. Resistance: 1.4044, 1.4089
- Gold: Support: 4,366, 3,933. Resistance: 4,856, 5,588
- Brent: Support: 98.00, 93.00 Resistance: 108.00, 114.00
EURUSD forecast
The coming week in the currency market is unfolding amid continued US dollar dominance, driven by persistent expectations of tight monetary policy from the US Federal Reserve. The latest US macroeconomic data continues to show economic resilience: the labour market remains strong, while inflation pressure stays above target levels, reducing the probability of near-term Fed easing. This supports Treasury yields and increases the dollar’s appeal.
At the same time, the European Central Bank is in a more difficult position. Weak eurozone growth, particularly in Germany’s industrial sector, is adding to pressure on the regulator. The market is increasingly pricing in the likelihood of earlier rate cuts from the ECB than from the Federal Reserve. This creates a divergence in monetary policy paths, which continues to weigh on the EURUSD pair.
Geopolitical tensions and stronger demand for safe-haven assets are additional factors, which also support the dollar. Next week, market participants will closely monitor US inflation data and comments from Fed officials, which may clarify the path of interest rates.
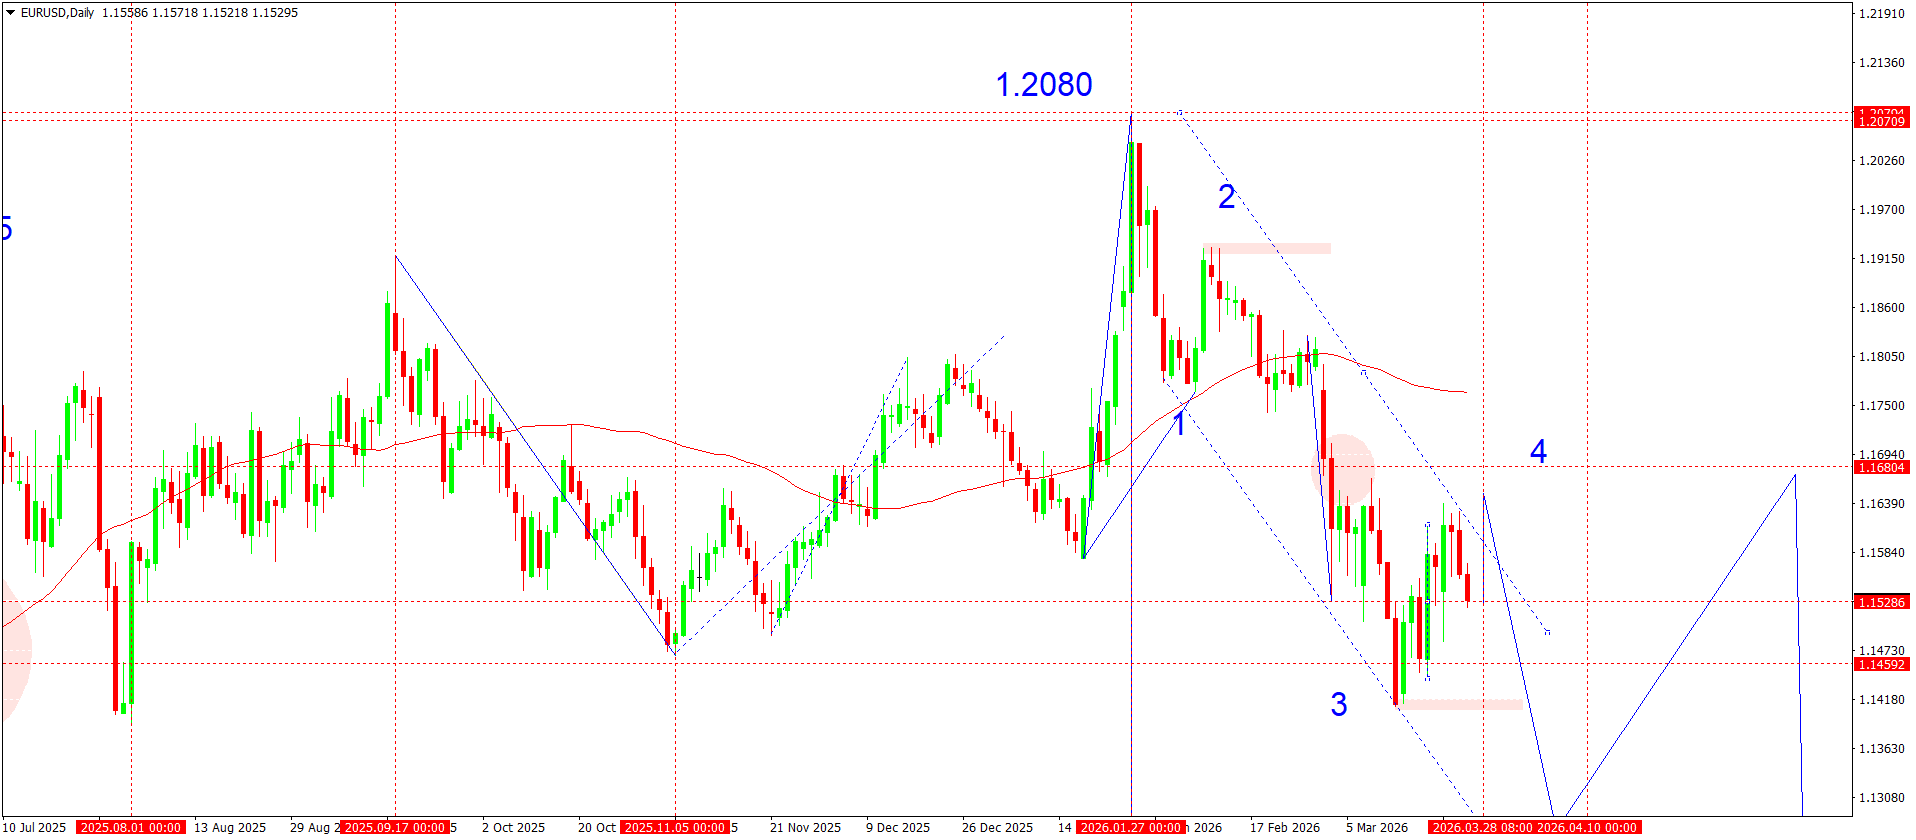
EURUSD technical analysis
On the daily chart, the EURUSD pair maintains a downward structure after forming a local high in the 1.2080 area, which acts as the key peak of the current medium-term cycle. After completing the impulsive upward wave, the price shifted into a correction phase, forming a descending channel marked as the 2–3 structure.
The current dynamics indicate the third downward wave, which is characterised by accelerating movement and renewed local lows. The price has consolidated below the moving average, confirming seller dominance and increasing pressure on the pair.
The 1.1680 area previously acted as a consolidation zone and now serves as resistance. Attempts to rise into this area are accompanied by active selling, indicating strong supply. The formation of local highs below previous ones strengthens the downtrend.
The 1.1455 area acts as the nearest support and has already been tested within the current move. At the same time, the price structure suggests a potential breakout below it if the current momentum persists. Below that, room opens for further downside as wave 3 develops.
The local correction that formed failed to break above the upper boundary of the descending channel, confirming that bearish control remains intact. The potential formation of wave 4 may lead to a short-term rebound upwards, but the market treats this only as corrective within the broader downtrend.
Another signal of pressure comes from the sequential decline in highs and lows, as well as the price holding below key dynamic levels. This confirms that the market is in a distribution phase with a priority on further downside.
EURUSD forecast scenarios
Bearish (baseline): a continued decline within the descending channel, with a breakout below 1.1455 and movement towards 1.1360.
Bullish (alternative): if the market breaks 1.1680 and consolidates above it, corrective growth into the 1.1750–1.1800 area is possible.
USDJPY forecast
The fundamental backdrop for USDJPY over the coming week is shaped by expectations regarding the monetary policy of the key central banks, as well as US bond yield dynamics. The market’s main focus is on the actions of the US Federal Reserve, which continues to maintain hawkish rhetoric amid persistent inflation and a strong labour market. This supports the US dollar and preserves investor interest in US assets.
Rising US Treasury yields also provide additional support for the dollar, strengthening the rate differential between the US and Japan. At the same time, the Bank of Japan maintains a cautious stance despite gradually tightening its rhetoric and signs of abandoning its ultra-loose policy. However, the regulator’s actual actions remain limited, which restrains yen strengthening.
Geopolitical factors and general demand for safe-haven assets also play an important role. Despite periodic spikes in volatility, investors continue to favour the dollar as the higher-yielding asset. Thus, fundamentally, the USDJPY pair retains an upward bias, although signs of overheating are becoming increasingly visible.
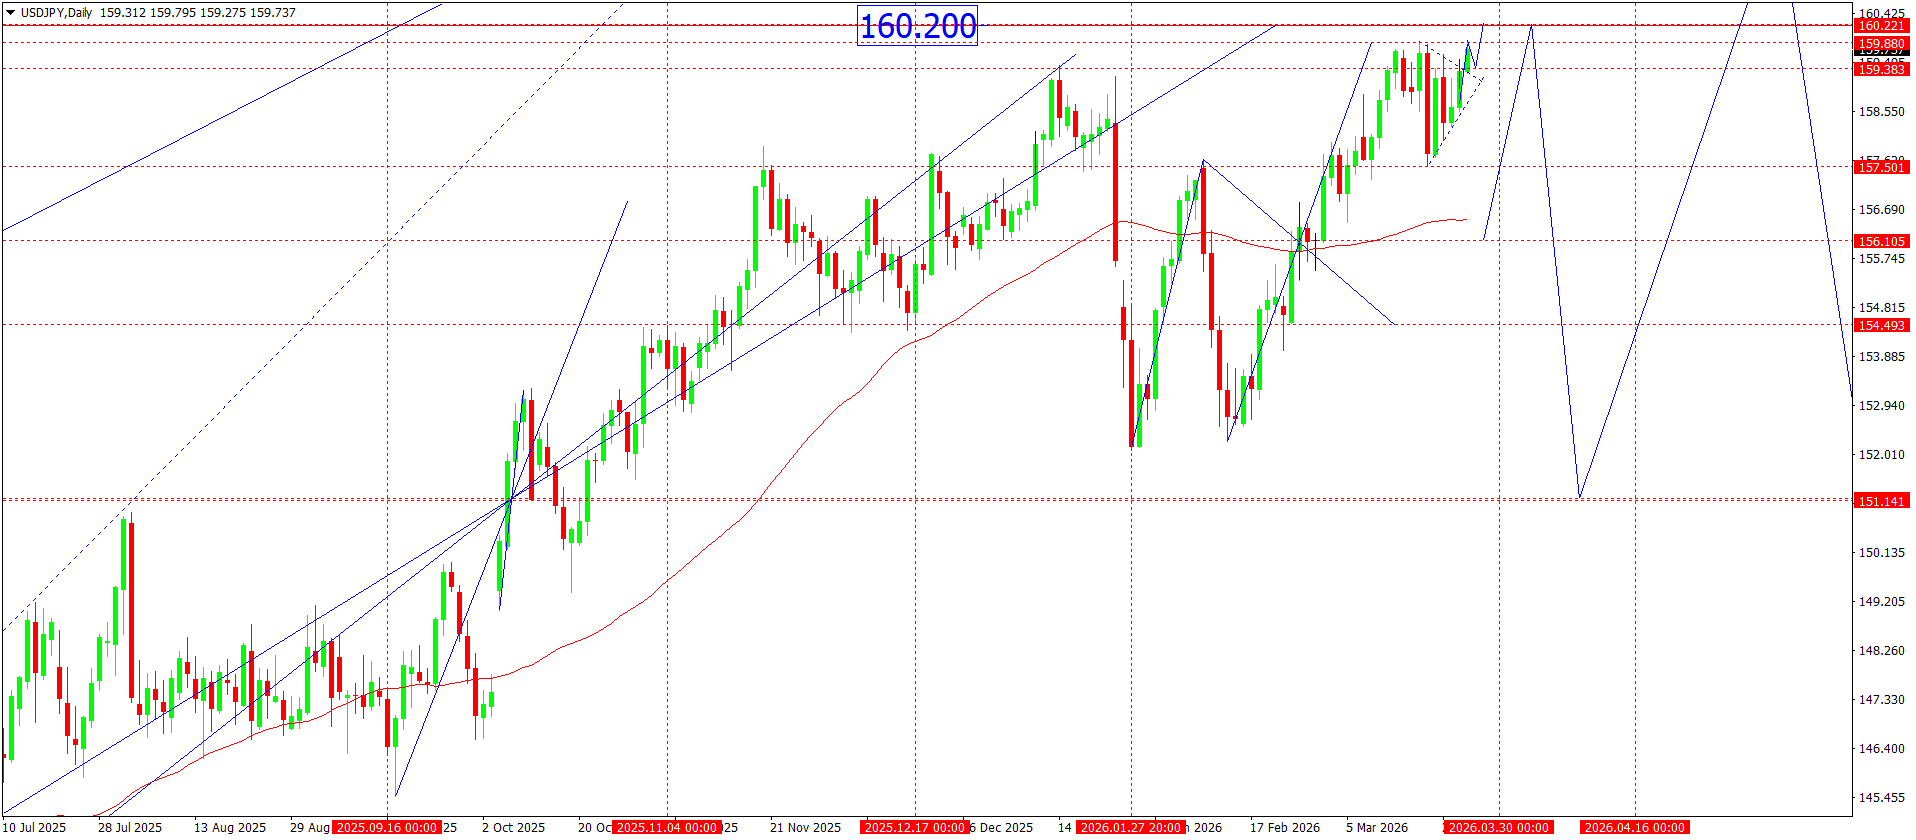
USDJPY technical analysis
On the daily chart, the USDJPY pair maintains steady upward momentum that is developing within an ascending channel. The price continues to form a sequence of higher highs and higher lows, indicating the strength of the current momentum.
The key resistance zone is the 159.80–160.20 area, where the market has repeatedly encountered profit-taking. The 160.20 level is an important psychological and technical mark, from which pullbacks were previously observed. The current price structure points to consolidation forming below this resistance, which may indicate position accumulation ahead of a possible breakout.
From a wave structure perspective, the final phase of upward momentum is unfolding. The price is moving within a local ascending channel, while acceleration in the latest candlesticks suggests a possible completion of the wave and a shift into correction.
The moving average (the red line on the chart) remains below the current price, confirming bullish trend dominance. However, the distance between the price and the average is widening, signalling overbought conditions and increasing the probability of a pullback.
In the event of a corrective move, the first significant support zone is 157.50, where the boundary of the previous consolidation and the local lows are located. A deeper correction may bring the price into the 156.10 area, where dynamic support runs and where buyers were previously active.
The alternative scenario suggests a breakout above 160.20 and consolidation higher, which will open potential for further upside as the ascending channel expands. In this case, the move may accelerate due to stop orders being triggered and new buyers entering.
USDJPY forecast scenarios
Bearish (baseline): a correction from the 159.80–160.20 zone, with movement to 157.50 and possible continuation to 156.10.
Bullish (alternative): if the price breaks 160.20 and consolidates above it, growth towards new highs is possible as the trend extends.
GBPUSD forecast
The fundamental backdrop for the GBPUSD pair over the coming week is shaped by several key factors at once, including expectations regarding the monetary policy of the major central banks, inflation dynamics, and the state of global risk appetite. The market’s main focus is on signals from the US Federal Reserve and the Bank of England, because the divergence in their monetary policy paths continues to determine the pair’s medium-term direction.
The US currency remains resilient amid strong macroeconomic data, including a stable labour market and still-elevated inflation. This supports expectations that the Fed will maintain hawkish rhetoric for longer than previously expected. US Treasury yields remain elevated, which increases the dollar’s appeal.
At the same time, the British pound remains under pressure due to mixed economic signals. On the one hand, UK inflation remains above the Bank of England’s target, which limits the BoE’s room for rapid policy easing. On the other hand, signs of slowing economic activity and weak consumer demand create risks for further economic growth. This creates uncertainty regarding the BoE’s next steps.
Another factor is the overall condition of global markets: stronger geopolitical tension and swings in commodity markets periodically increase demand for safe-haven assets, which supports the US dollar and limits GBPUSD upside potential.
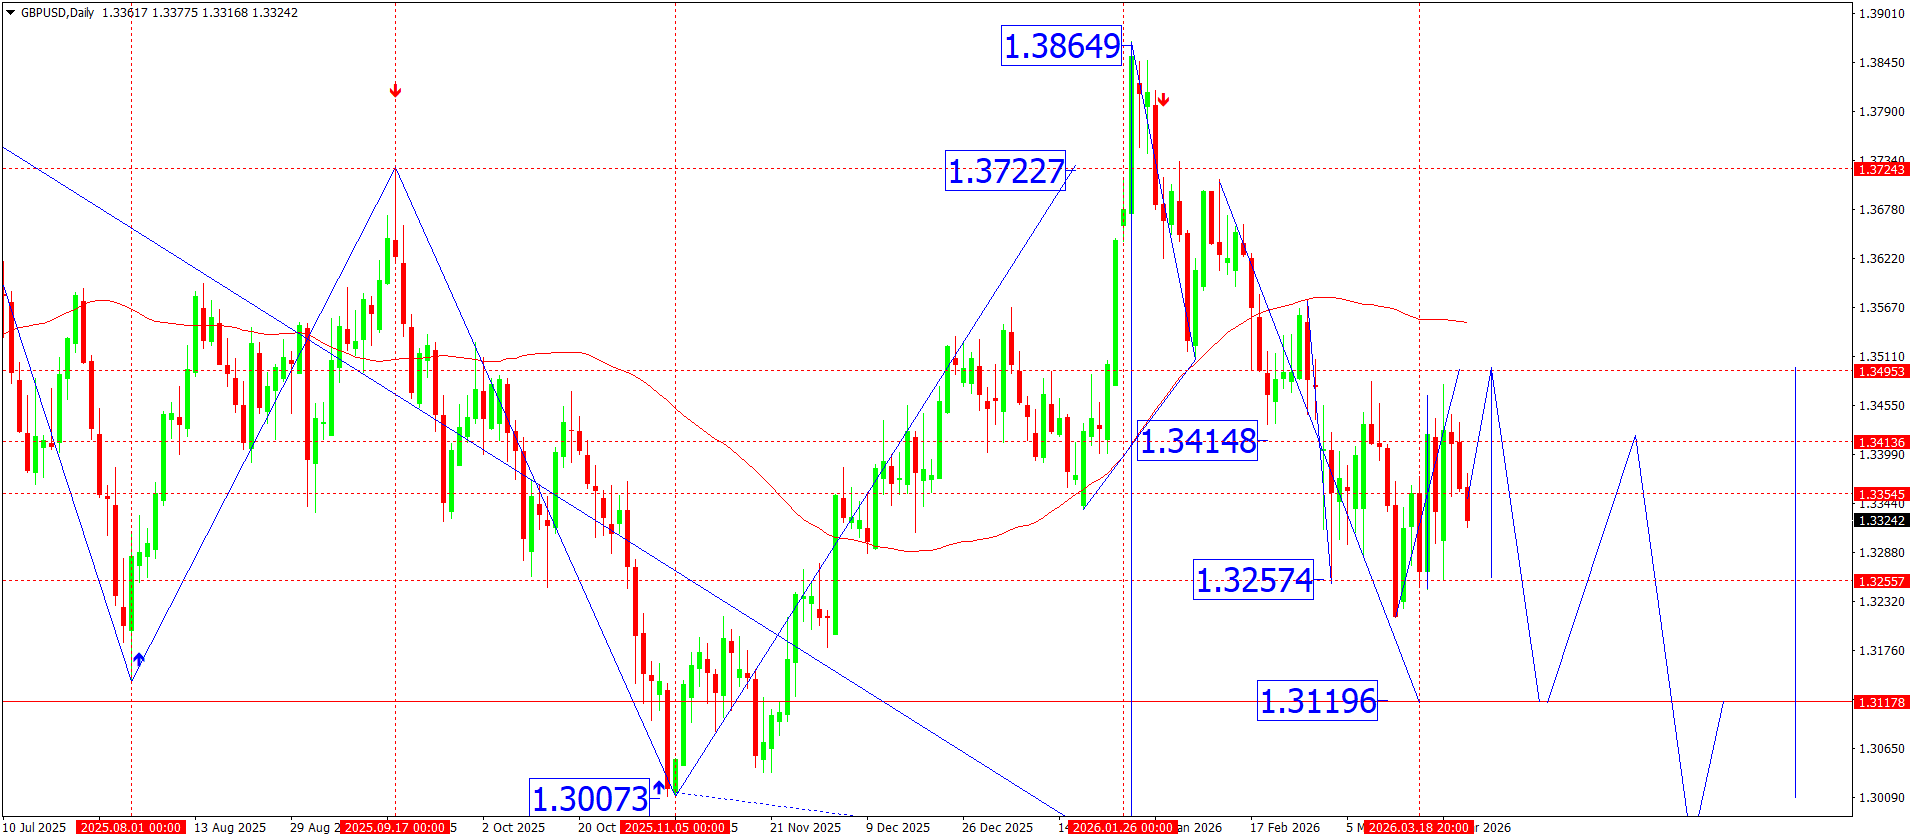
GBPUSD technical analysis
From a technical perspective, the daily GBPUSD chart is showing the formation of a downward structure after reaching a local high near 1.3864. After a sharp impulse lower, the price shifted into a correction phase, but the structure of highs and lows remains declining, indicating persistent selling pressure.
The key resistance level is the 1.3414–1.3495 zone, where consolidation was previously observed and from where the decline accelerated. This area now acts as a strong seller cluster. The price has tested this range several times but has failed to consolidate above it, which confirms its significance.
On the downside, important support comes at 1.3257, which has already been reached as a local downside target. A breakout below this zone opens the way to the next key level at 1.3119, which corresponds to previous lows and acts as the medium-term target of the downward move.
The current structure resembles a corrective zigzag after an impulsive decline, where a potential continuation wave to the downside is forming. Local upward moves appear weak and remain technical pullbacks. The moving average (the red line) is also acting as dynamic resistance, holding the price below the medium-term trend.
It is also worth noting that the price is trading in a lower-volatility range after a strong impulse, which often precedes a new directional move. Given the broader structure, the priority remains on further downside, especially if the price breaks below the nearest supports.
GBPUSD forecast scenarios
Bearish scenario (main): a continued decline, with a breakout below 1.3257 and movement towards 1.3119.
Bullish scenario (alternative): if the market consolidates above 1.3414, the pair could climb towards 1.3495 and then further to 1.3722.
AUDUSD forecast
The fundamental backdrop for AUDUSD over the coming week is shaped by opposing factors linked to the monetary policy of the major central banks and commodity market dynamics. Investors are mainly focused on expectations regarding the US Federal Reserve’s interest rate path, as well as the rhetoric of Reserve Bank of Australia officials. The latest US macroeconomic data point to continued labour market resilience and moderate inflation pressure, which support the dollar and limit upside potential in risk-sensitive currencies, including the Australian dollar.
Another factor pressuring the AUD is the unstable dynamics of the Chinese economy, as Australia is closely linked to China through commodity exports. Weak data from China’s industrial sector is increasing concern over weaker demand for raw materials, which is indirectly weighing on the AUD. At the same time, rising commodity prices, including iron ore, are partly offsetting this negative factor.
The RBA’s rhetoric remains cautious: the regulator is signalling readiness to keep rates at current levels for longer than previously expected, but is not providing a clear signal of further tightening. This creates a balance of uncertainty and keeps the pair within a range.
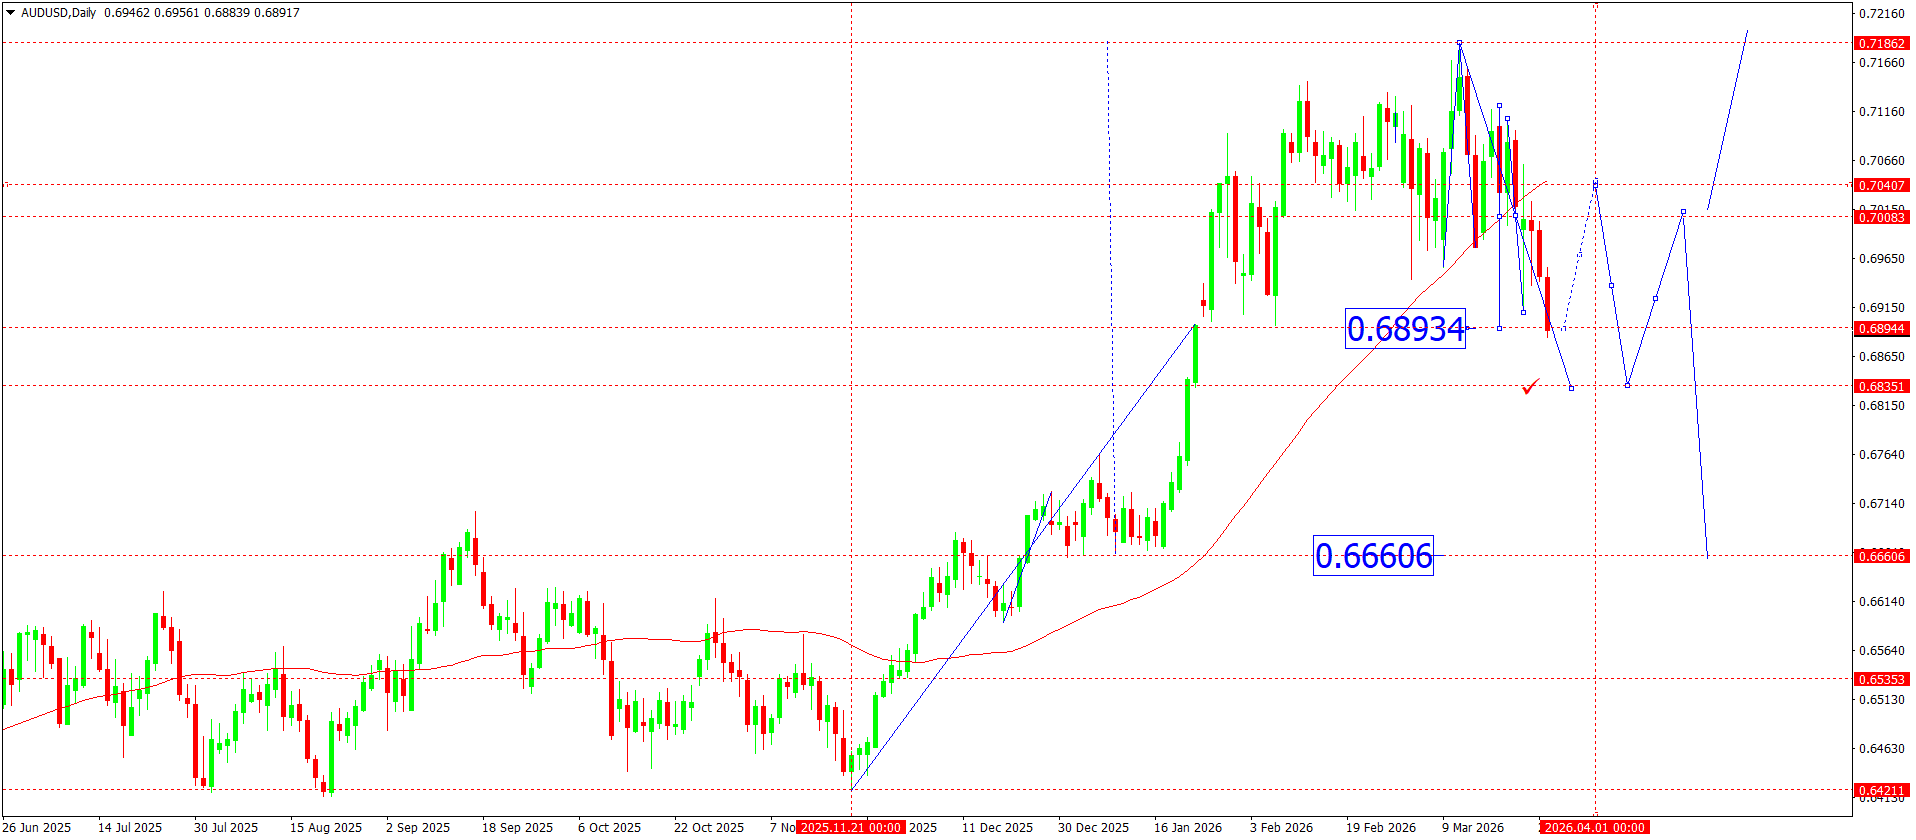
AUDUSD technical analysis
From a technical perspective, the AUDUSD pair retains a medium-term ascending structure, but is currently in a correction phase after forming a local high near 0.7186. After the impulsive rise from the 0.6420 area, the market formed a sequence of higher lows, confirming an uptrend.
On the daily chart, the price has broken the local ascending structure and shifted into a correction phase, forming a descending channel. At present, quotes are testing the 0.6893 area, which acts as an interim equilibrium zone and local support. Consolidation below this level would increase the probability of further downside.
From a wave structure perspective, the current correction may be regarded as a pullback wave after the growth impulse was completed. In this context, the 0.6835 zone acts as key support, where an attempt to form a reversal structure is possible. A breakout below this area will open the potential for a deeper correction towards 0.6660, where more significant support and the moving average are located.
Resistance is forming in the 0.7000–0.7040 range. This level previously acted as a consolidation zone and is now the key barrier to renewed growth. Only a confident breakout above this area will allow a return to the bullish scenario, with a target of retesting the highs.
Thus, the market is in a correction phase within a medium-term uptrend, where further direction will be determined by price reaction to the key support levels.
AUDUSD forecast scenarios
Bearish scenario (baseline): further downside with a breakout below 0.6890 and movement towards 0.6835, with possible continuation to 0.6660.
Bullish scenario (alternative): if the price breaks and consolidates above 0.7040, the pair could resume growth towards 0.7120–0.7180.
USDCAD forecast
The fundamental backdrop for the USDCAD pair over the coming week is shaped by several key factors at once: US dollar dynamics, oil prices, and expectations regarding central bank monetary policy. The US dollar continues to receive support from resilient macroeconomic indicators, including the labour market and inflation, which increases expectations that the Federal Reserve will maintain a hawkish tone. Despite signs of slower growth, the regulator remains cautious about easing policy, which is keeping yields elevated.
At the same time, the Canadian dollar remains sensitive to oil market dynamics. Brent prices are showing moderate stability, but the lack of a pronounced upward momentum is limiting the CAD’s upside potential. Additional pressure comes from the cautious stance of the Bank of Canada, which is signalling a possible pause in the tightening cycle due to slower inflation and a cooling economy. Thus, the interest rate differential and general demand for safe-haven assets continue to favour the US dollar.
It is also important to take into account ongoing geopolitical risks and the broader state of global risk appetite. In the event of stronger tensions, investors traditionally move into the dollar, which gives USDCAD additional support.
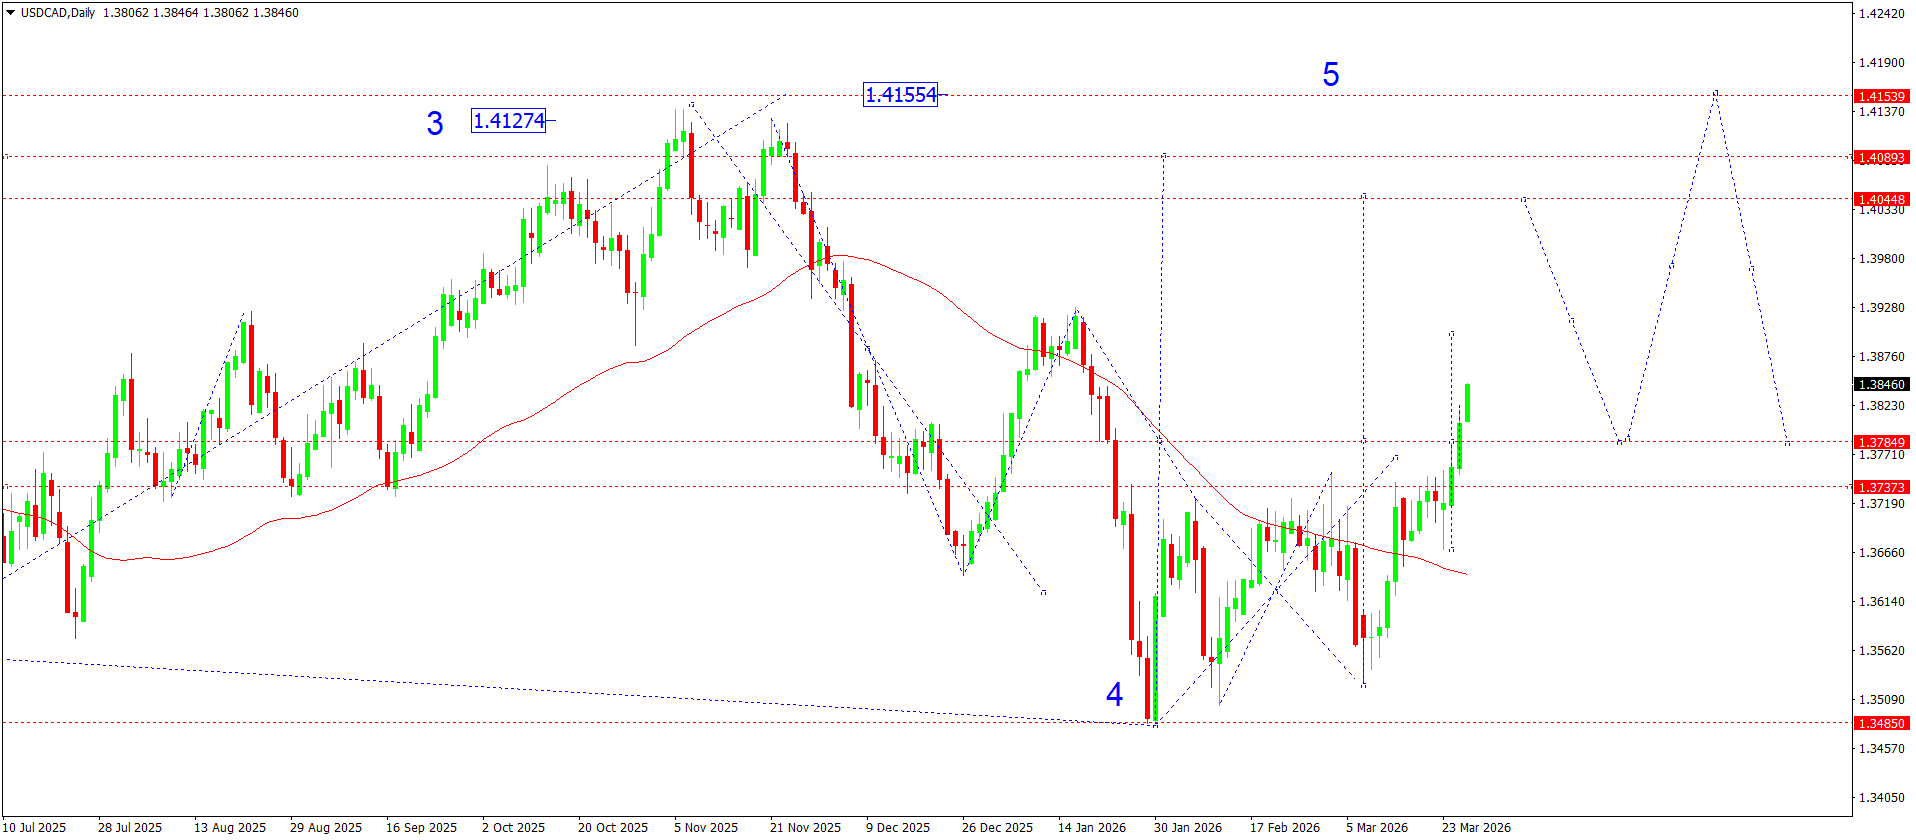
USDCAD technical analysis
From a technical perspective, the USDCAD pair continues to form a recovery structure after completing its downward momentum from the November highs. The daily chart clearly shows the completion of a corrective wave in the 1.3485 area, from where the market formed a reversal structure, marked as potential wave 4.
The subsequent move higher can be interpreted as the beginning of wave 5. The price has consolidated above the 1.3737–1.3784 area, which previously acted as resistance and can now be regarded as support. Additional confirmation of the reversal comes from the breakout above the local descending channel and consolidation above the moving average, which is starting to turn upwards.
The current rise is accompanied by a sequential renewal of local highs, indicating stronger buyer activity. The nearest target is the 1.4044 area, where consolidation was previously observed and from where the decline accelerated. If this level is broken, the market may move towards the next key resistance at 1.4089 and then to 1.4155, which corresponds to the targets of the wave structure.
However, it is worth noting that the current move is already partly overheated in the short term, and a correction phase with a return to the 1.3780–1.3730 zone for liquidity collection is possible. Holding above this area will be critically important for the continuation of the bullish scenario.
USDCAD forecast scenarios
Bullish (main): continued growth with consolidation above 1.3780 and movement to 1.4044, with potential expansion to 1.4089–1.4155.
Bearish (alternative): if the price breaks below 1.3730, a correction towards 1.3660 is possible, with the risk of a return to 1.3550.
XAUUSD forecast
The fundamental backdrop for gold over the coming week is shaped by several key factors at once: expectations regarding Federal Reserve interest rate policy, US bond yield dynamics, and the overall investor appetite for risk. After a period of active growth at the start of the year, the market is gradually shifting into a correction phase, linked to a partial reassessment of expectations for rate cuts in the US. More resilient US inflation and labour market data are reducing the probability of aggressive Fed easing, which is weighing on gold.
A stronger US dollar is also exerting additional pressure, which traditionally acts as a negative factor for XAUUSD. At the same time, persistent geopolitical tension and instability across commodity markets continue to support safe-haven demand, limiting the depth of the decline. Real yield dynamics remain another important factor: higher real yields increase pressure on gold, while lower yields may once again stimulate demand.
Thus, the market is in a balance between fundamental pressure from monetary policy and support from safe-haven demand, which is creating conditions for elevated short-term volatility.
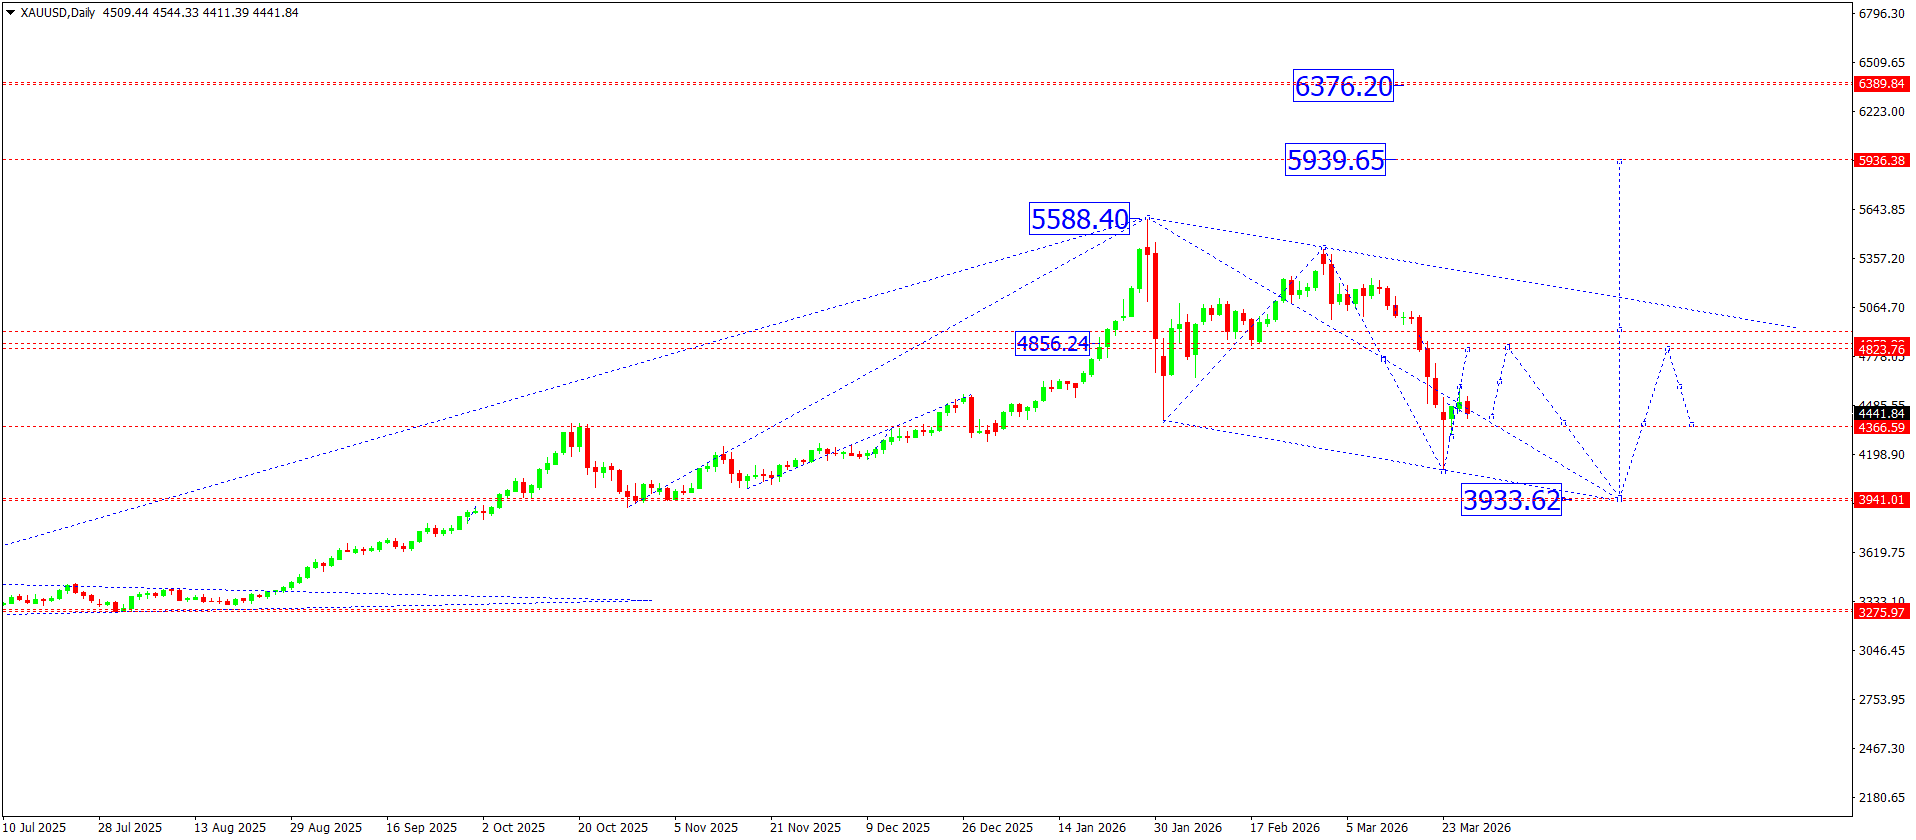
XAUUSD technical analysis
On the daily chart, XAUUSD retains the structure of a medium-term uptrend, but a correction phase began after the local high near 5,588. The downside move is developing within a descending channel, suggesting a corrective wave after the impulsive rise.
Prices have already tested the 4,856 area, which acts as a key resistance zone and previously served as a breakout point. Failure to consolidate above this level is increasing pressure on quotes and confirming a downward correction. The current structure indicates the formation of lower highs, which is a sign of weakening bullish momentum.
The nearest downside target is the 4,366 zone, where an interim support level is located. If this area is broken, room opens for movement towards the deeper target at 3,933, which corresponds to the lower boundary of the current corrective range and may act as a key reversal point.
At the same time, the alternative scenario suggests the formation of a local reversal pattern near current levels, with prices returning above 4,856. In this case, quotes could retest the channel’s upper boundary and move further to 5,588 and above. Longer-term upside targets remain at 5,939 and 6,376, but to reach them, the market will require a recovery of sustainable bullish momentum and support from fundamental factors.
Overall, the current technical picture suggests a correction phase within a broader uptrend, where the key factor remains price reaction in the 4,366–3,933 zone.
XAUUSD forecast scenarios
Bearish (main): continued corrective decline with a breakout below 4,366 and movement towards 3,933.
Bullish scenario (alternative): if prices consolidate above 4,856, growth towards 5,588 and then 5,939 is possible.
Brent forecast
The oil market is ending the current week amid elevated volatility, driven by a combination of geopolitical factors, demand dynamics, and expectations regarding monetary policy in the major economies. Market participants are mainly focused on the outlook for global energy demand, as well as signals from the Federal Reserve regarding the future path of interest rates. The Fed’s hawkish rhetoric continues to pressure commodity assets through a stronger dollar, but this factor is partly offset by persistent risks of supply disruptions.
Additional support for prices comes from constrained production by OPEC+ countries, which continue to follow a supply-control policy. At the same time, US oil inventory data are showing mixed dynamics: local increases in stocks are limiting upside, but overall, the market remains sensitive to any signs of supply deficit. It is also important to consider recovering demand from Asia, where economic activity is gradually stabilising.
Thus, the fundamental backdrop remains mixed: on the one hand, a strong dollar and risks of slower global growth are limiting upside potential; on the other, geopolitics and OPEC+ policy are providing a basis for prices to remain elevated.
Brent technical analysis
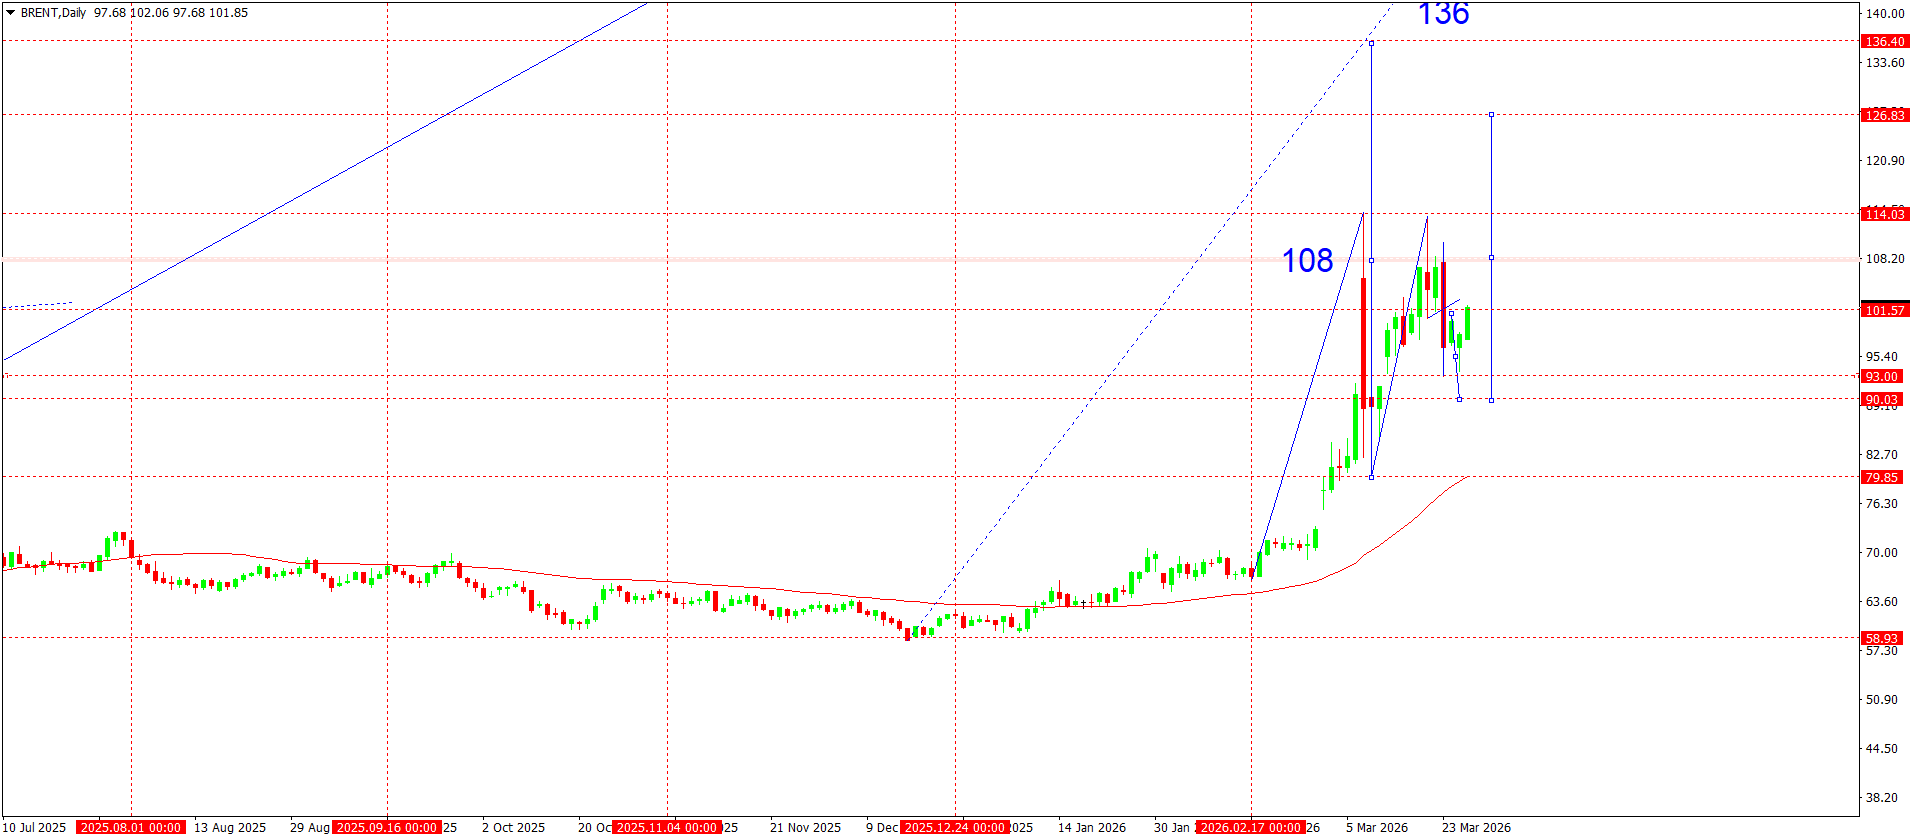
On the daily chart, Brent retains a clearly defined upward structure that formed after the completion of a prolonged consolidation period in the 58.93–70.00 range. The breakout above key resistance in the 79.85 area became the starting point for an accelerated impulsive rally, which later transitioned into an extended upward wave.
The current structure indicates momentum is forming, with an intermediate target around 108.00. This level acted as local resistance, where the market shifted into a correction phase. The correction is developing within an ascending channel and remains limited for now, indicating that bullish control remains intact.
The 101.57 area acts as the nearest balance zone, where consolidation is taking place after the impulsive rise. Holding above this level confirms the strength of the current trend. At the same time, the 93.00–90.03 zone is the key support area, corresponding to the previous accumulation wave and a potential point for renewed upside.
From a wave structure perspective, the market has likely completed the third impulsive wave with an extension to 108.00 and is currently forming a corrective fourth wave. If this phase is completed, a fifth wave may develop, with the potential to retest the highs and move towards 114.03, and then 126.83.
The long-term upside target remains near 136.40, which corresponds to the upper boundary of the extended channel and the projection of higher-order waves. However, to realise this scenario, the market needs to consolidate above the 108.00 zone and then develop further momentum.
Brent forecast scenarios
Bullish scenario (main): if the market consolidates above 102.00 and then breaks 108.00, continued growth towards 114.03 can be expected, with further potential movement to 126.83.
Bearish scenario (alternative): a breakout below 98.00 will increase corrective pressure and open downside potential towards 93.00 and then the 90.00 area.
Editors’ picks
 EURUSD 2026-2027 forecast: key market trends and future predictions
This article provides the EURUSD forecast for 2026 and 2027 and highlights the main factors determining the direction of the pair’s movements. We will apply technical analysis, take into account the opinions of leading experts, large banks, and financial institutions, and study AI-based forecasts. This comprehensive insight into EURUSD predictions should help investors and traders make informed decisions.
 Gold (XAUUSD) forecast 2026 and beyond: expert insights, price predictions, and analysis
Dive deep into the Gold (XAUUSD) price outlook for 2026 and beyond, combining technical analysis, expert forecasts, and key macroeconomic factors. It explains the drivers behind gold’s recent surge, explores potential scenarios including a move toward 4,500 to 5,000 USD per ounce, and highlights why the metal remains a strong hedge during global uncertainty.
Forecasts presented in this section only reflect the author’s private opinion and should not be considered as guidance for trading. RoboForex bears no responsibility for trading results based on trading recommendations described in these analytical reviews.