Weekly technical analysis and forecast (6–10 April 2026)
This weekly technical analysis highlights the key chart patterns and levels for EURUSD, USDJPY, GBPUSD, AUDUSD, USDCAD, gold (XAUUSD), and Brent crude oil to forecast market moves for the upcoming week (6–10 April 2026).
Major technical levels to watch this week
- EURUSD: Support: 1.1396, 1.1260. Resistance: 1.1542, 1.1660
- USDJPY: Support: 156.40, 151.20. Resistance: 159.50, 160.70
- GBPUSD: Support: 1.3117, 1.2961. Resistance: 1.3298, 1.3414
- AUDUSD: Support: 0.6809, 0.6747. Resistance: 0.6965, 0.7050
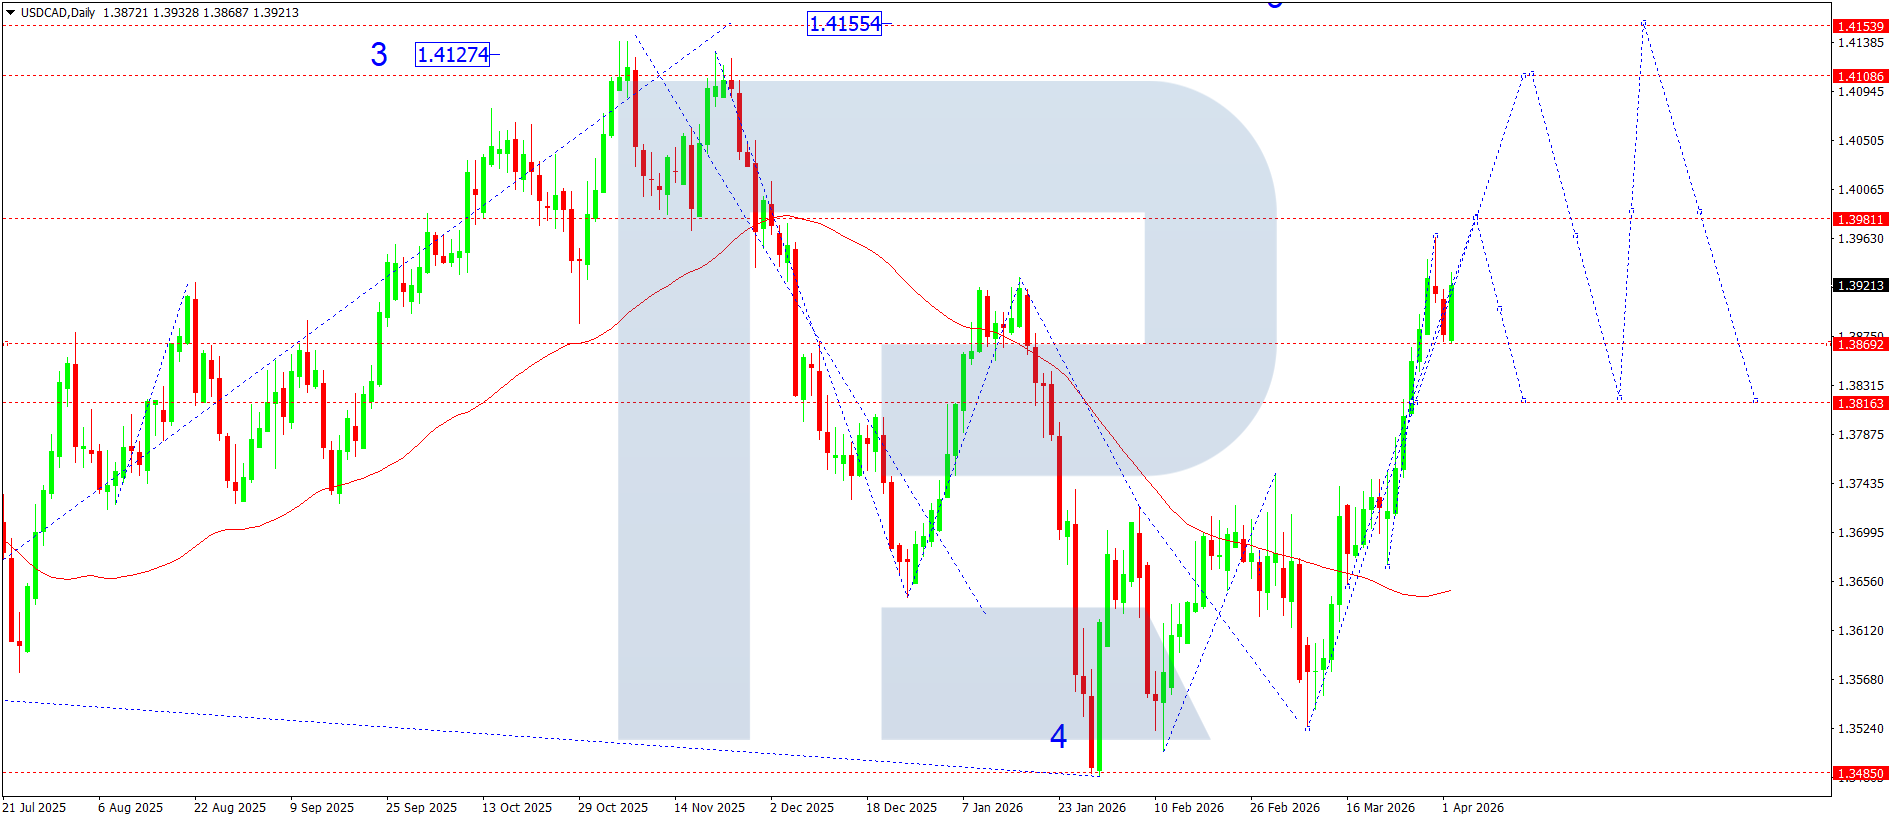
- USDCAD: Support: 1.3869, 1.3816. Resistance: 1.3981, 1.4108
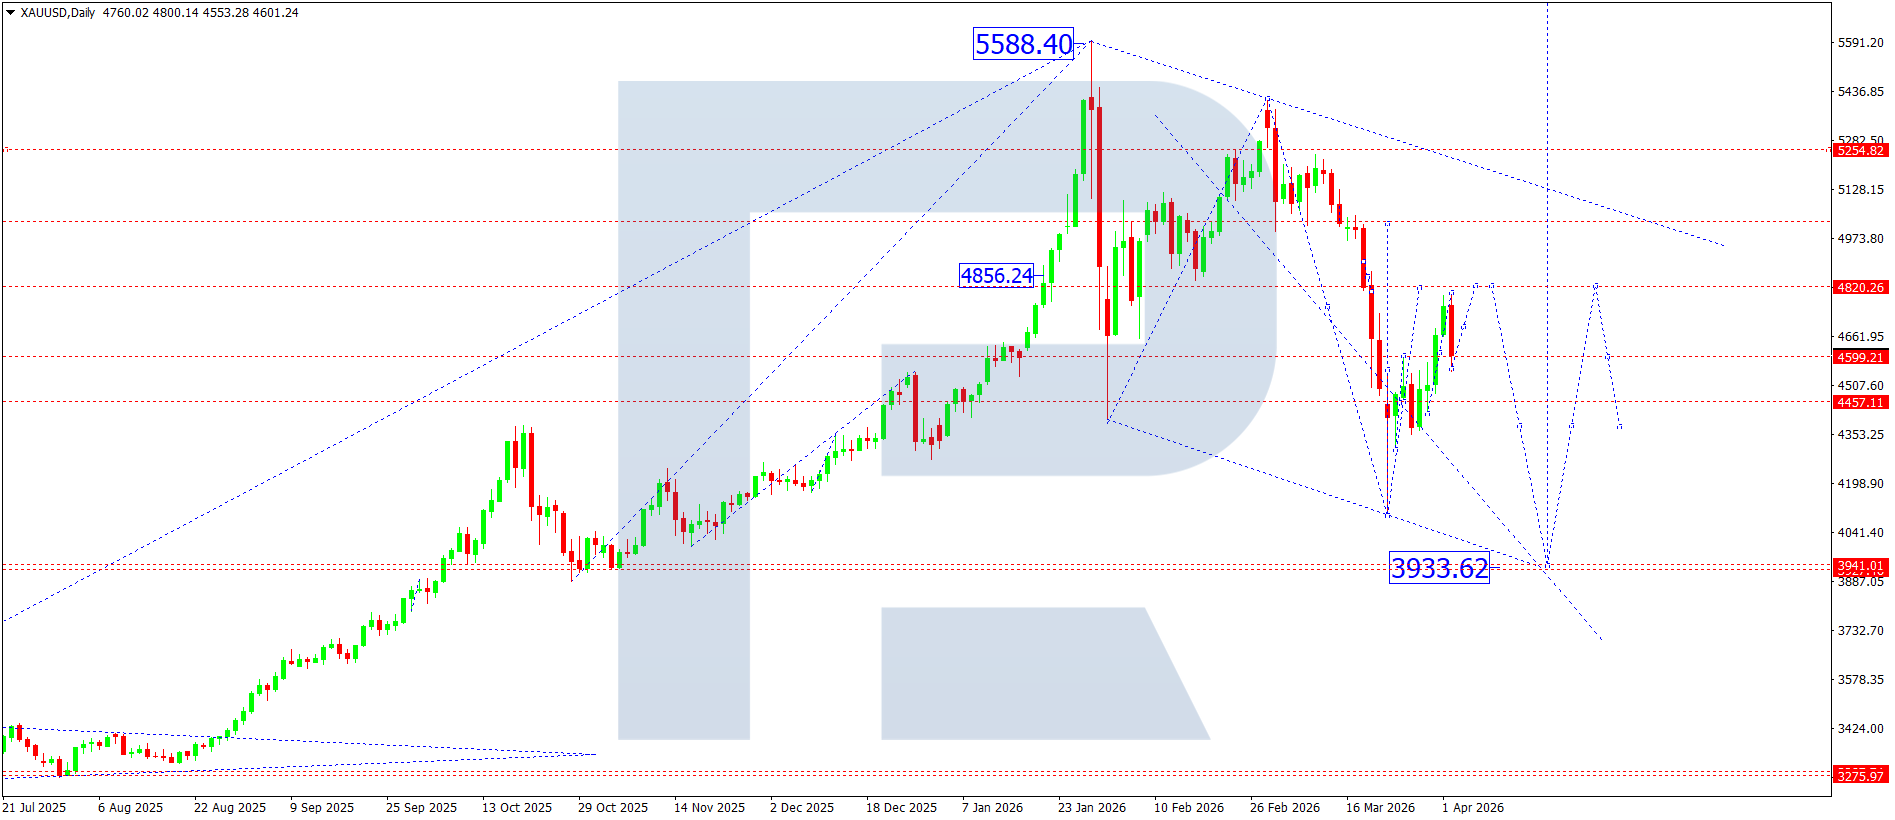
- Gold: Support: 4,457, 3,933. Resistance: 4,590, 4,820
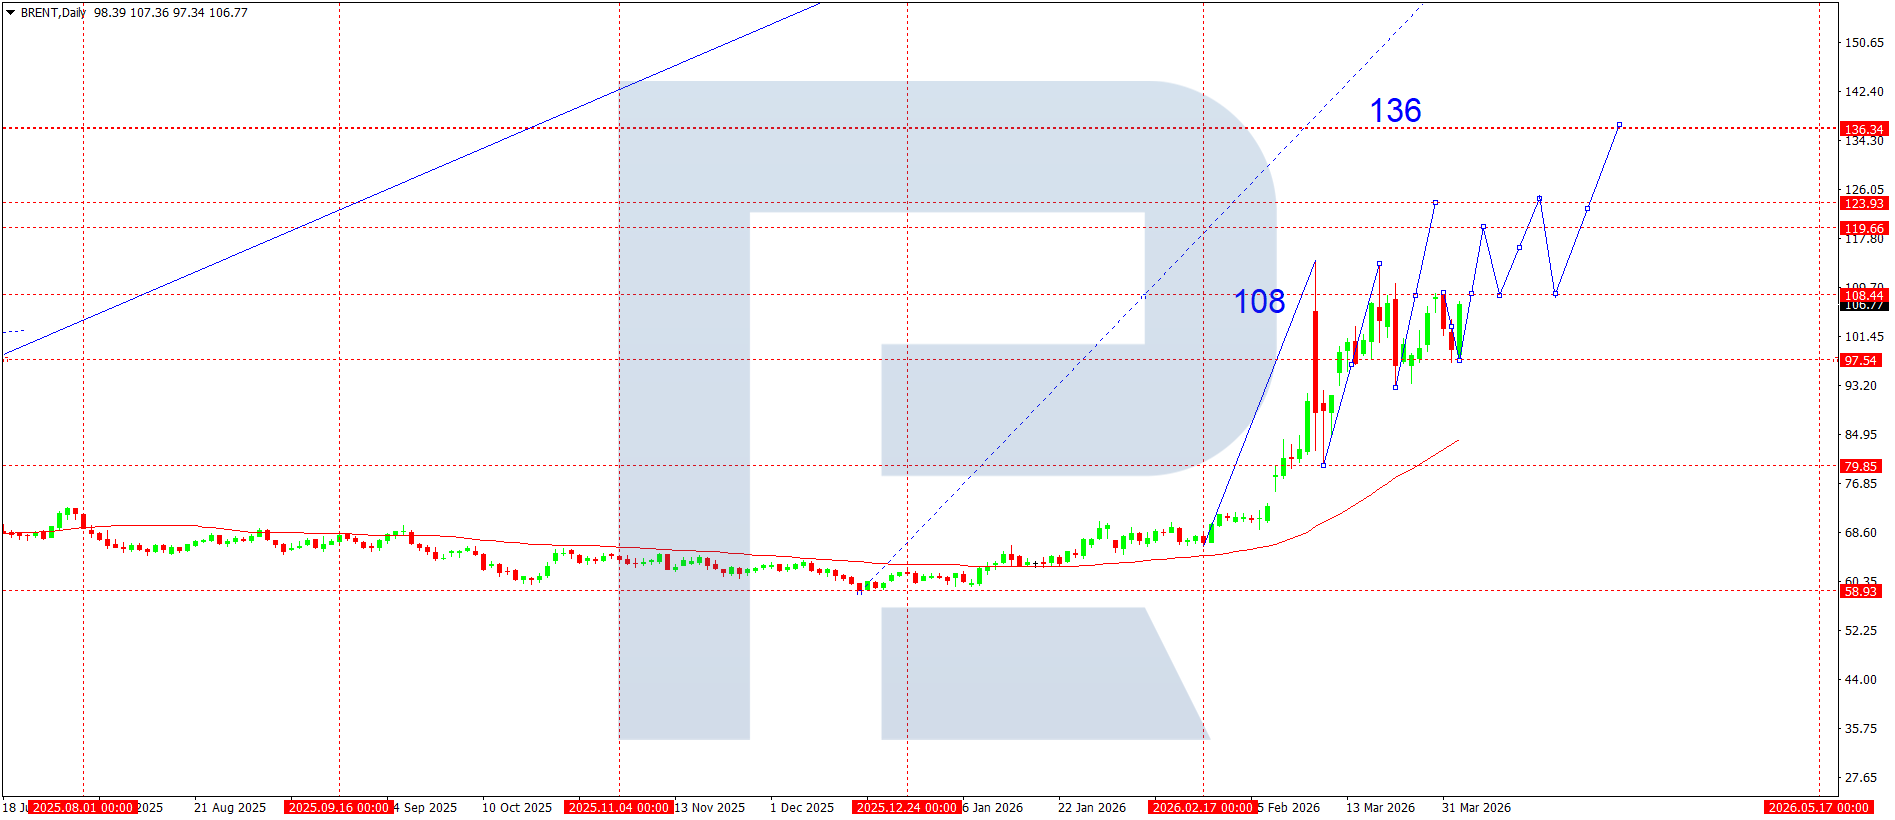
- Brent: Support: 97.50, 93.20. Resistance: 108.40, 119.60
EURUSD forecast
Next week, market participants will focus primarily on the divergence in monetary policy and macroeconomic statistics from the US and the eurozone. The European Central Bank continues to take a cautious stance, signalling a possible pause in tightening amid slowing inflation and weak business activity. At the same time, the US Federal Reserve maintains a more hawkish tone, as the labour market remains resilient and inflation risks persist. The latest eurozone business activity data indicates stagnation, while the US economy is showing relative resilience, supporting the dollar and putting pressure on the EURUSD pair. An additional factor is the rise in US bond yields, which is increasing capital inflows into dollar-denominated assets.
EURUSD technical analysis
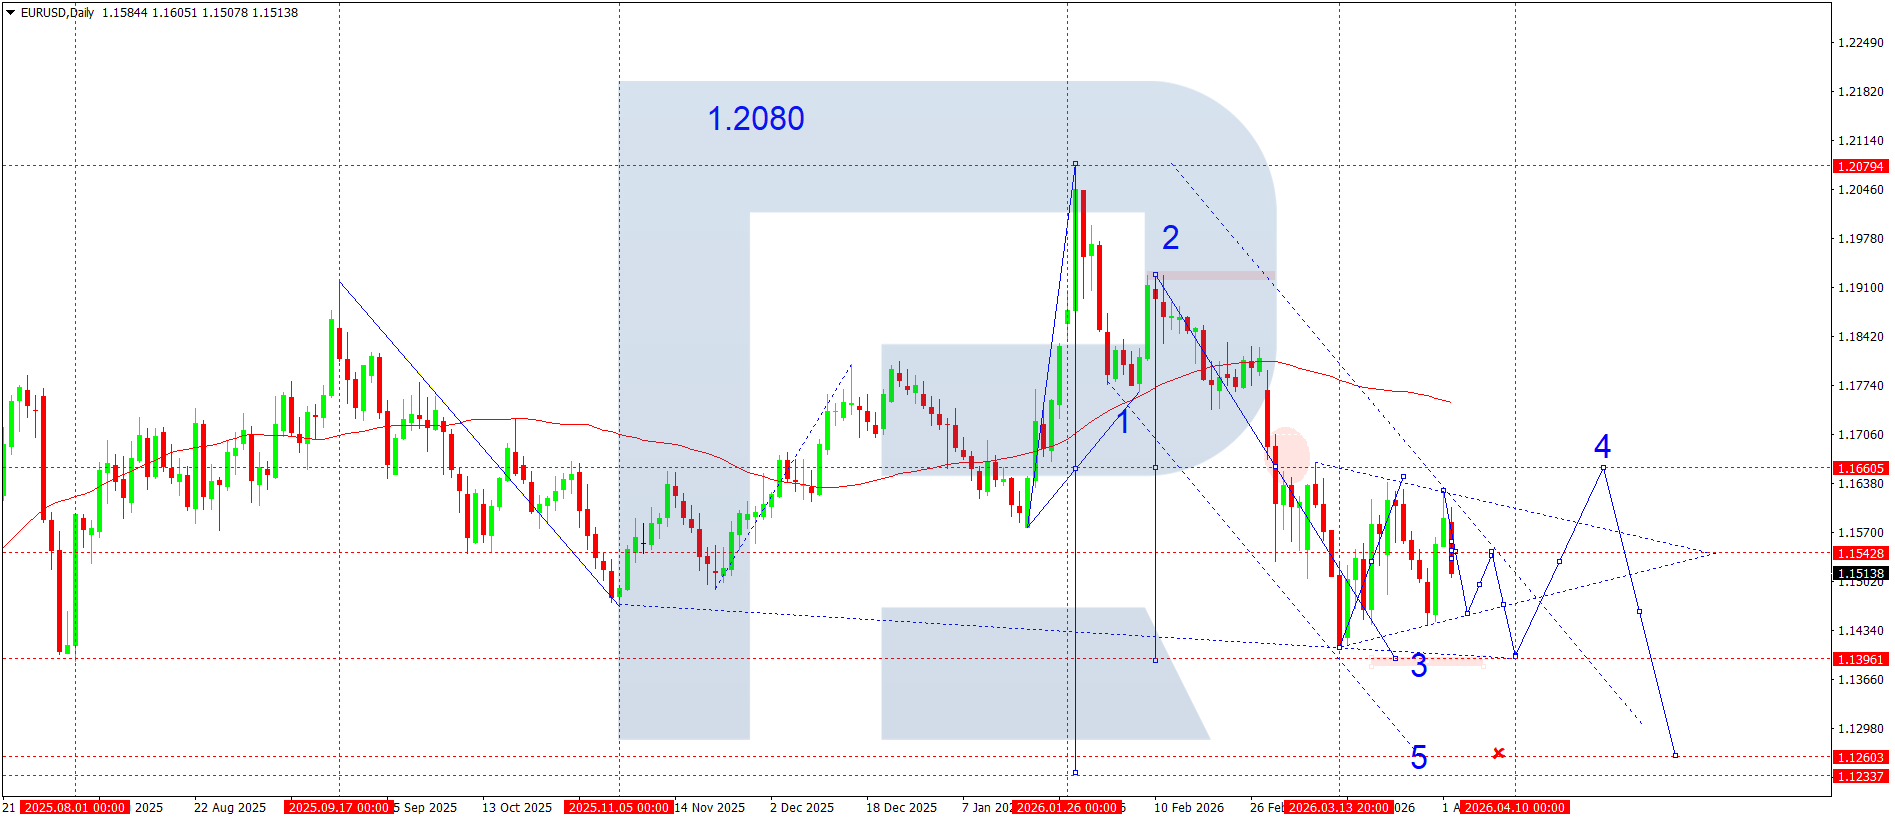
On the daily chart, the pair retains a downward structure after forming a reversal impulse from the 1.2080 area. The current move is developing within a descending channel, where price is sequentially forming lower highs and lower lows. After completing the impulsive downward wave, the market shifted into a corrective phase marked as the 1–2–3 structure.
The 1.1660 area acted as the key Pivot Point zone, from which price turned downwards again, confirming seller dominance. The moving average is also pointing downwards and is holding the price below it, reinforcing the bearish scenario.
The current consolidation is forming as a narrowing range, which points to accumulation ahead of the next impulse. The lower boundary of the structure runs near 1.1395–1.1396, where buyers previously reacted. However, the formation of weaker rebounds indicates a high probability of a breakout below this zone.
The wave structure points to the possible development of the final downward wave (5), with a target below 1.1300. At the same time, local corrections remain limited by the 1.1540–1.1600 zone, where the upper boundary of the current range is located.
EURUSD forecast scenarios
Bearish (baseline): a decline from 1.1540 towards 1.1396, followed by a breakout towards 1.1260.
Bullish (alternative): if the price consolidates above 1.1600, a correction towards 1.1660 is possible.
USDJPY forecast
The fundamental backdrop for USDJPY next week is shaped by expectations regarding monetary policy in the US and Japan. The market continues to price in a scenario of prolonged high rates from the Federal Reserve, which supports the dollar. The latest US macroeconomic data point to a resilient labour market and moderately persistent inflation, which reduces the probability of rapid policy easing. At the same time, the Bank of Japan maintains a cautious approach to policy normalisation despite rising inflation expectations domestically. BoJ rhetoric remains dovish, which puts pressure on the yen. An additional factor is the yield differential, which still works in favour of USD. However, rising geopolitical risks and possible corrective moves in equity markets may temporarily increase demand for safe-haven assets, including the yen.
USDJPY technical analysis
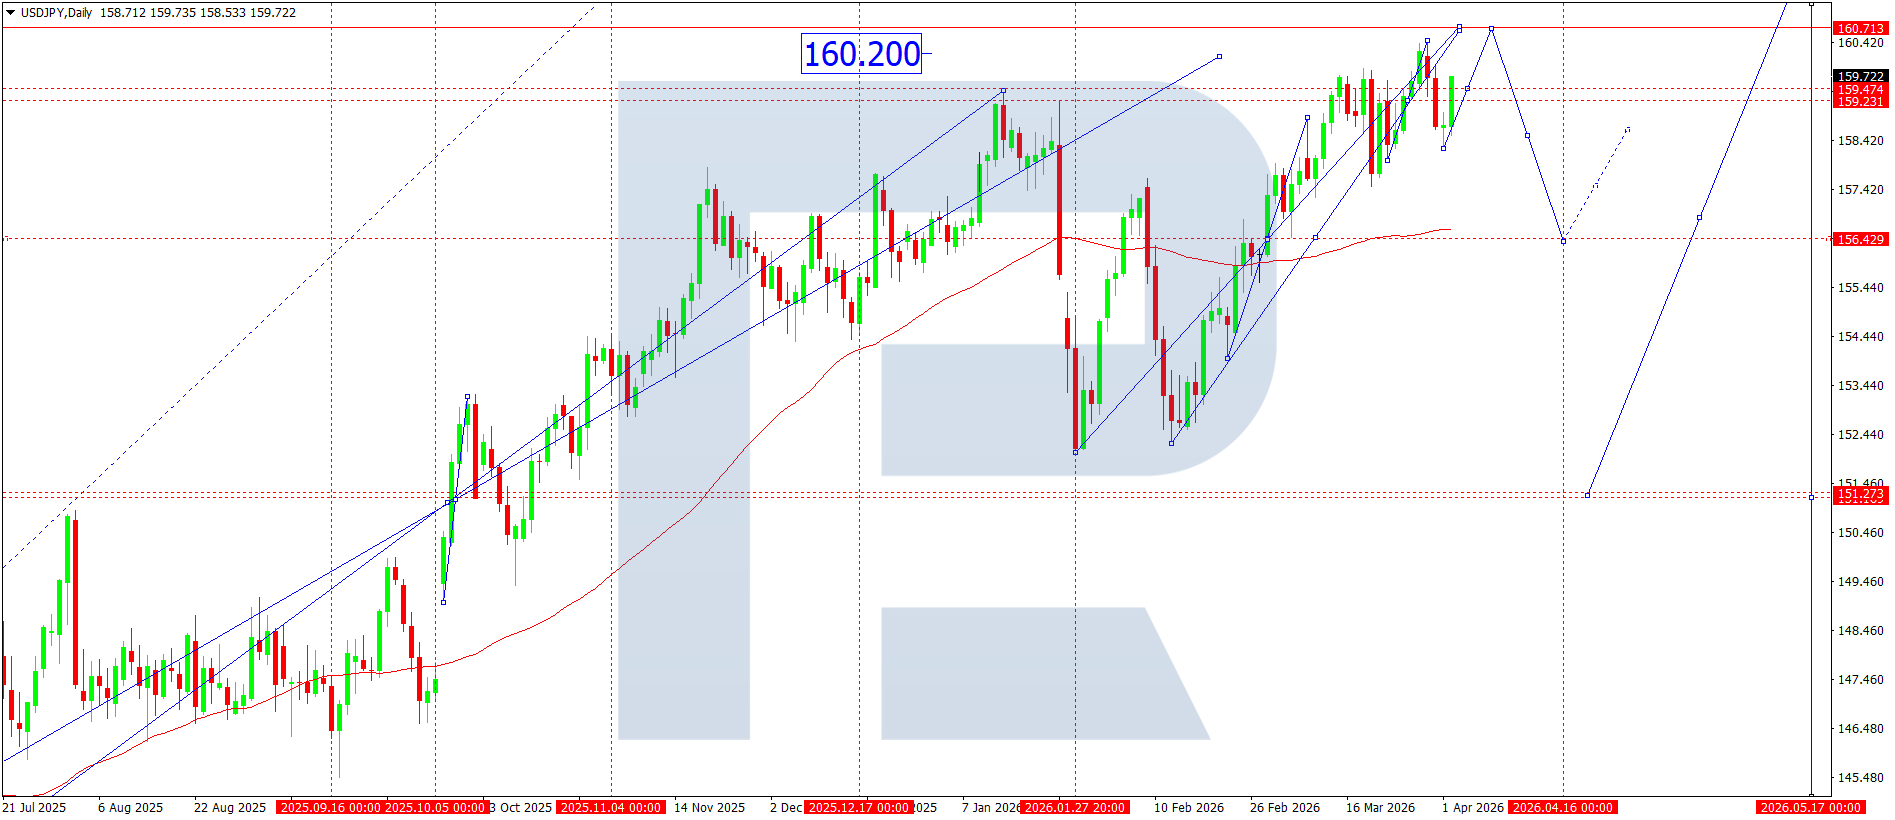
From a technical perspective, the daily chart shows a firm uptrend. The price is moving within an ascending channel, sequentially forming higher highs and higher lows. After a local correction around 152.40, the market recovered and resumed growth, consolidating above the moving average, which confirms bullish strength. At present, the price is testing the 159.20–159.50 resistance zone, where profit-taking was previously observed.
The move structure suggests an impulsive wave with the potential to renew the highs around 160.20 and above. However, it is necessary to take into account overbought conditions and the proximity of the upper channel boundary, which may trigger a pullback into the 156.40 zone, where the key support and balance zone are located. The alternative scenario suggests a deeper correction towards 151.20 if the current structure breaks down.
USDJPY forecast scenarios
Bearish (baseline): a corrective decline from the 159.20–159.50 zone towards 156.40.
Bullish (alternative): if the price consolidates above 159.50, growth towards 160.70 is possible.
GBPUSD forecast
The fundamental backdrop for the GBPUSD pair next week is shaped by expectations regarding further actions by the central banks and macroeconomic data from the US and the UK. Investors continue to assess Federal Reserve rhetoric after the latest signals that it intends to keep monetary policy tight amid a resilient labour market and inflation risks. This is supporting the dollar. At the same time, the Bank of England (BoE) is taking a more cautious approach, as the UK economy is facing signs of slowing while inflation is gradually easing. Additional pressure on sterling comes from weak consumer activity data and risks of a cooling housing market. As a result, the balance of fundamental factors remains moderately in favour of the dollar, although short-term fluctuations may intensify amid the publication of new macroeconomic reports.
GBPUSD technical analysis
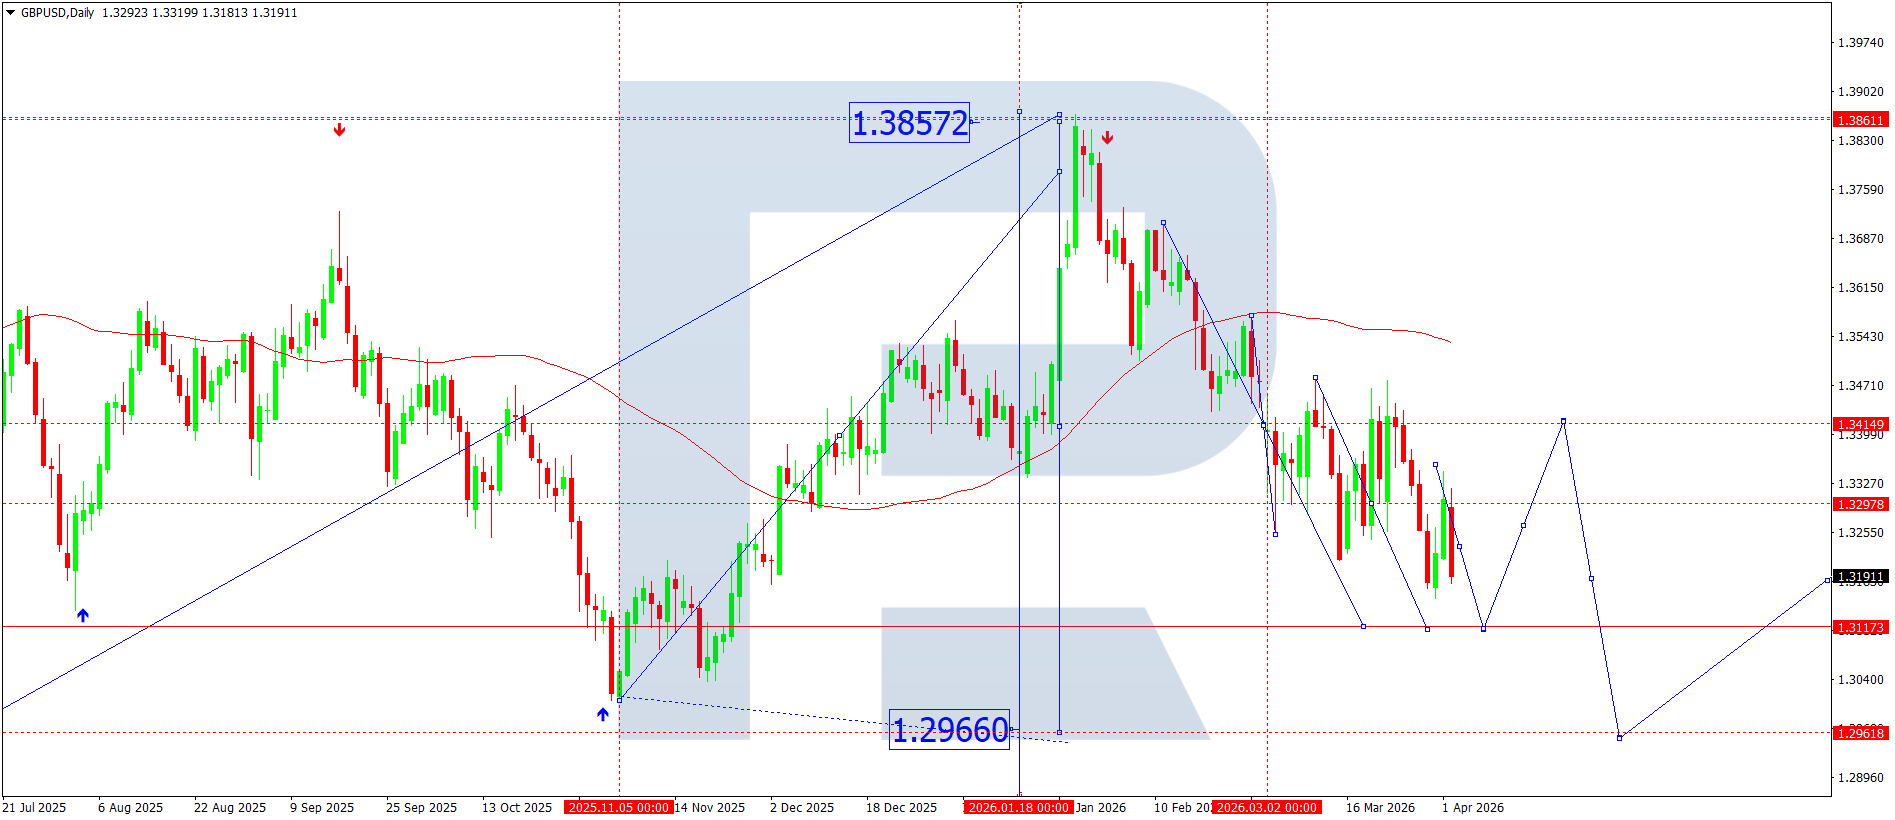
From a technical perspective, the GBPUSD pair retains a downward structure after forming a medium-term high near 1.3857. The price has completed an impulsive decline and consolidated below the 1.3414 area, confirming a shift in priority in favour of sellers. The current move structure suggests a downward wave with a sequential renewal of local lows. The 1.3298 area acts as intermediate resistance, from which downward pullbacks previously developed. The key support is located at 1.3117, where the price has already shown a buyer reaction.
The move scenario implies the formation of a corrective wave with a possible test of the 1.3298–1.3414 zone, after which the market is expected to resume declining. If the price breaks below the 1.3117 level, the pair could gain downward momentum with a target around 1.2961, which corresponds to the next support level and the potential target under the current structure.
GBPUSD forecast scenarios
Bearish scenario (main): a downtrend move towards 1.3117, followed by movement to 1.2961.
Bullish scenario (alternative): if the price consolidates above 1.3414, a rise towards 1.3543 is possible.
AUDUSD forecast
Next week, the key driver for the currency market remains US dollar dynamics amid expectations regarding the Federal Reserve’s interest rate path. The latest US macroeconomic data shows a mixed picture: the labour market remains resilient, but inflationary pressures are gradually easing, which is strengthening expectations of possible softer Fed rhetoric. At the same time, the Reserve Bank of Australia is maintaining a cautious stance, citing slower growth in China and weak commodity demand. An additional source of pressure on the Australian dollar comes from lower metal prices and uncertainty in global trade. As a result, the fundamental backdrop remains moderately negative for the AUDUSD pair, with a bias in favour of the US dollar.
AUDUSD technical analysis
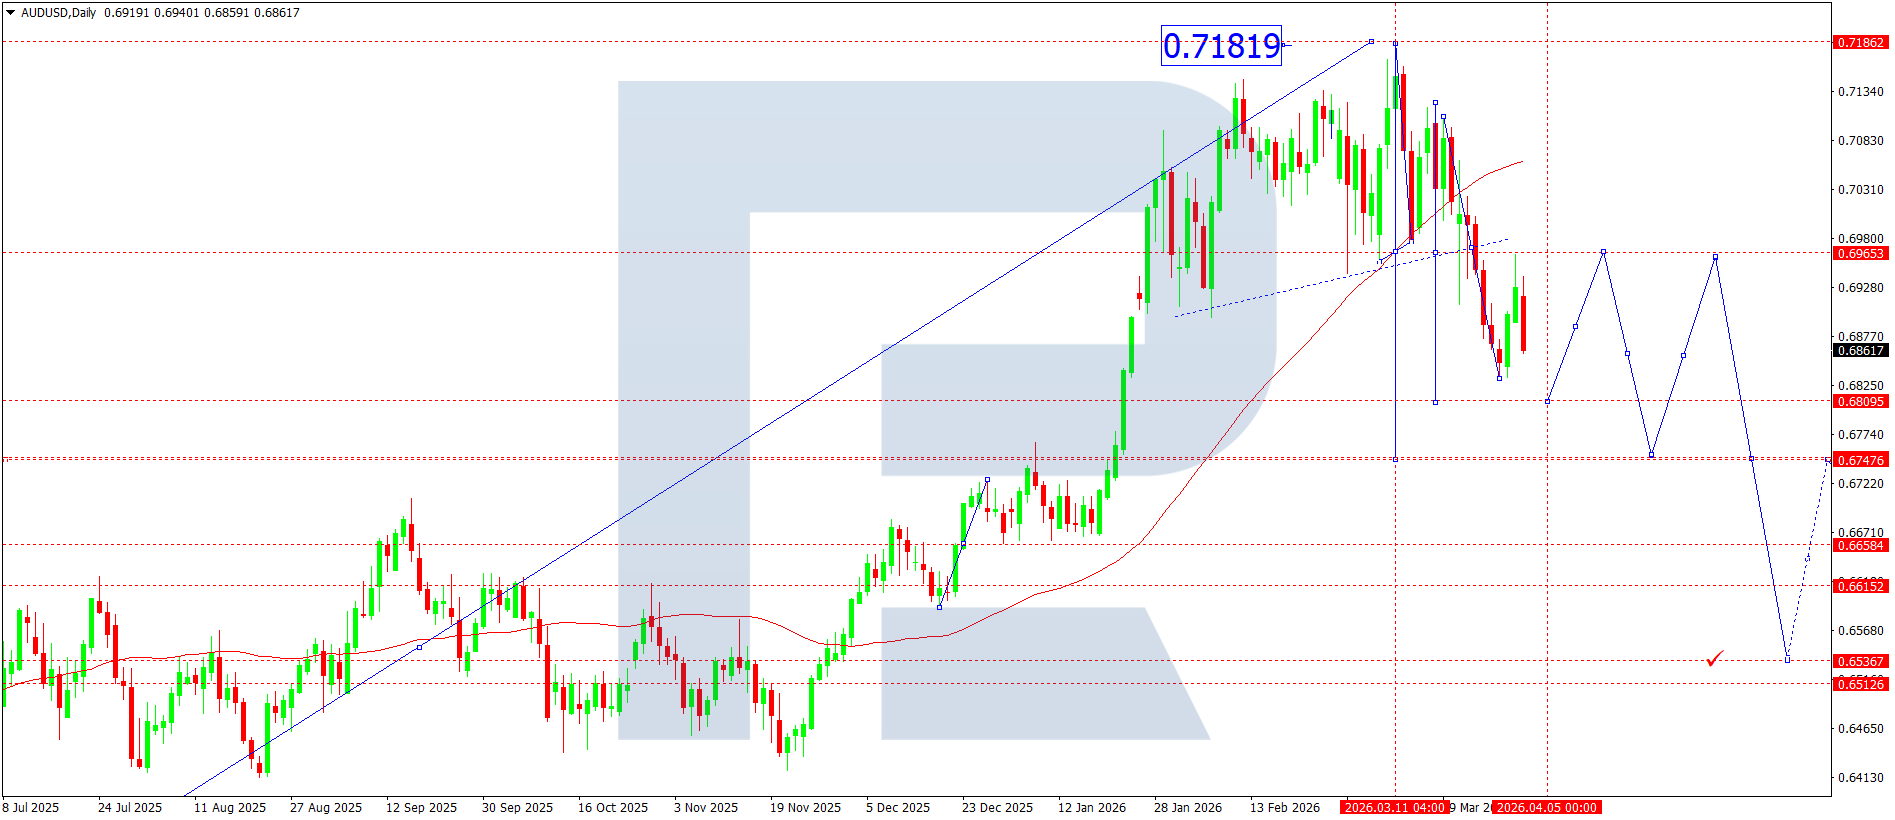
From a technical perspective, the AUDUSD pair has completed its upward phase with a high near 0.7182 on the daily chart before forming a reversal structure. The current dynamics suggest downward momentum with consolidation below the 0.6965 area, which previously acted as support. The price has confidently broken the upward trendline, confirming a change in the medium-term trend. Additional pressure is coming from the price trading below the moving average, which points to seller dominance.
The move structure is forming a series of lower highs and lower lows, consistent with the development of a descending channel. The nearest downside target is seen in the 0.6809 zone, where consolidation was previously observed. If this level is broken, the market may accelerate towards 0.6747 and then 0.6658. Alternative upside scenarios remain limited by the 0.6965 zone, where key resistance and a possible selling area are located.
AUDUSD forecast scenarios
Bearish scenario (baseline): a decline towards 0.6809 with possible continuation to 0.6747.
Bullish scenario (alternative): if the price consolidates above 0.6965, a rise towards 0.7050 is possible.
USDCAD forecast
Next week, USDCAD dynamics will be shaped by monetary policy and the commodity factor. The market continues to reassess the path of Fed rates, taking into account mixed macroeconomic data: a resilient labour market alongside a moderate slowdown in inflation. This supports the dollar, but limits its momentum. At the same time, the Bank of Canada is taking a more cautious stance, signalling a pause in tightening, which is putting pressure on the Canadian dollar. Oil remains an additional factor: unstable price dynamics amid demand and supply expectations are increasing CAD volatility. Overall, the fundamental backdrop is moderately bullish for the pair, but without a pronounced impulsive driver.
USDCAD technical analysis
On the daily chart, the medium-term ascending structure remains intact after a base formed near 1.3485. The current rise can be interpreted as an impulsive wave after the completion of the correction phase, marked as wave 4. The price has consolidated above the moving average, indicating a shift in the medium-term trend towards growth.
The nearest resistance level is located at 1.3981, where sellers previously reacted. A breakout above this level will open the potential for a move towards 1.4108 and then 1.4155, which corresponds to previous highs and the targets under the wave structure. A local correction has already started to form after the sharp rise, and it may take the form of a descending channel with a return to the 1.3869–1.3816 zone, where the support area and a possible point for the formation of a new upward wave are located.
It is important to note that the growth structure remains impulsive, while the current correction is technical. Holding above 1.3816 will confirm buyer control.
USDCAD forecast scenarios
Bullish (main): continued growth after a correction towards 1.3981, with the potential for a move towards 1.4108.
Bearish (alternative): if the price breaks below 1.3816, a correction towards 1.3740 is possible.
XAUUSD forecast
The fundamental backdrop for next week remains mixed, but with a bias in favour of the US dollar. Gold continues to face pressure from the Federal Reserve’s hawkish rhetoric, as it is signalling that it intends to keep interest rates high for longer. The latest US macroeconomic data, including a resilient labour market and moderately persistent inflation, support expectations that the Fed will not rush to shift towards easing. This is lifting Treasury yields and reducing gold’s appeal as a non-yielding asset. An additional factor is easing geopolitical tensions compared to the start of the year, which is weakening demand for safe-haven assets. At the same time, risks of a slowing global economy and uncertainty surrounding central bank policy remain, which is limiting the potential for a deeper fall in XAUUSD.
XAUUSD technical analysis
From a technical perspective, the daily chart shows the formation of a medium-term corrective structure after the peak near 5,588. The impulsive decline that followed the reversal points to the completion of the upward phase and a shift into a deeper correction. The current move structure fits within a descending channel, with a sequence of lower highs forming. Prices have already tested the support zone near 3,933, from which a local rebound is being observed.
In the short term, a recovery movement towards the 4,550–4,600 area is observed, but this zone acts as key resistance. Breakout levels and liquidity concentration were previously located here, which increases the probability of a new downward wave. It is also worth noting that the current rise is corrective and is accompanied by slowing momentum.
XAUUSD forecast scenarios
Bearish (main): continued decline from the 4,590–4,660 zone, with prices returning to 4,457 and then moving towards 3,933.
Bullish scenario (alternative): consolidation above 4,660 will open the way to growth into the 4,820 area.
Brent forecast
The oil market is ending the week against a backdrop of a persistent geopolitical premium and steady demand from Asia. The main driver remains OPEC+ policy, as it continues to follow a restrictive production strategy, supporting market balance. Additional influence is coming from US oil inventory data, which is showing a moderate decline, signalling steady domestic demand. At the same time, Federal Reserve rhetoric remains cautious: expectations that rates will remain high are limiting global demand potential, but periodic dollar weakness is supporting commodity assets. The market is also pricing in risks of supply disruptions in the Middle East, which is keeping prices elevated.
Brent technical analysis
On the daily chart, Brent retains a clearly defined ascending structure after forming an impulse from the 79.85 area. Prices have confidently consolidated above the key 97.50 zone, confirming a bullish phase. The current structure indicates a continuation of the impulse with intermediate consolidation in the 97.50–108.40 range.
From a wave structure perspective, the chart is showing the completion of a local correction and a shift into a new impulsive phase, with the nearest target in the 108.00 area, which the market is already testing. Consolidation above this level opens potential for movement to 119.60 and then the 123.90 zone. The medium-term target under the extended structure remains in the 136.00 area, which corresponds to the upper boundary of the ascending channel.
The moving average confirms the uptrend, acting as dynamic support. For now, any pullbacks into the 97.50–101.50 zone are treated as corrective and may be used to build long positions.
Brent forecast scenarios
Bullish scenario (main): consolidation above 108.40 will open the potential for growth to 119.60, with further scope for movement into the 123.90 and 136.00 area.
Bearish scenario (alternative): a breakout below 97.50 will lead to a deeper correction with a target at 93.20.
Editors’ picks
 EURUSD 2026-2027 forecast: key market trends and future predictions
This article provides the EURUSD forecast for 2026 and 2027 and highlights the main factors determining the direction of the pair’s movements. We will apply technical analysis, take into account the opinions of leading experts, large banks, and financial institutions, and study AI-based forecasts. This comprehensive insight into EURUSD predictions should help investors and traders make informed decisions.
 Gold (XAUUSD) forecast 2026 and beyond: expert insights, price predictions, and analysis
Dive deep into the Gold (XAUUSD) price outlook for 2026 and beyond, combining technical analysis, expert forecasts, and key macroeconomic factors. It explains the drivers behind gold’s recent surge, explores potential scenarios including a move toward 4,500 to 5,000 USD per ounce, and highlights why the metal remains a strong hedge during global uncertainty.
Forecasts presented in this section only reflect the author’s private opinion and should not be considered as guidance for trading. RoboForex bears no responsibility for trading results based on trading recommendations described in these analytical reviews.