Weekly technical analysis and forecast (13–17 April 2026)
In this weekly technical analysis, we review key chart patterns and levels for EUSUSD, USDJPY, GBPUSD, AUDUSD, USDCAD, gold (XAUUSD), and Brent oil to forecast developments for the upcoming week (13–17 April 2026)
Major technical levels to watch this week
- EURUSD: Support: 1.1613, 1.1417. Resistance: 1.1720, 1.1783
- USDJPY: Support: 157.75, 156.45. Resistance: 160.60, 162.40
- GBPUSD: Support: 1.3157, 1.3077. Resistance: 1.3440, 1.3508
- AUDUSD: Support: 0.6986, 0.6907. Resistance: 0.7102, 0.7182
- USDCAD: Support: 1.3776, 1.3628. Resistance: 1.3962, 1.4031
- Gold: Support: 4,589, 4,424. Resistance: 4,854, 5,091
- Brent: Support: 89.55, 80.00. Resistance: 101.50, 108.00
EURUSD forecast
During the past week, EURUSD dynamics developed under the influence of mixed fundamental factors. Investors focused primarily on the rhetoric of the European Central Bank (ECB) and the US Federal Reserve (Fed). ECB representatives continue to signal a restrained approach to policy easing amid persistent inflationary pressure in the eurozone. At the same time, US macroeconomic data indicate labour market resilience and a moderate slowdown in inflation, which reduces expectations of aggressive rate cuts by the Fed. Additional pressure on the euro comes from weak business activity in the European industrial sector, while the dollar gains support as a safe-haven asset amid geopolitical uncertainty. As a result, the market is transitioning into a phase of corrective consolidation with a bias in favour of the dollar.
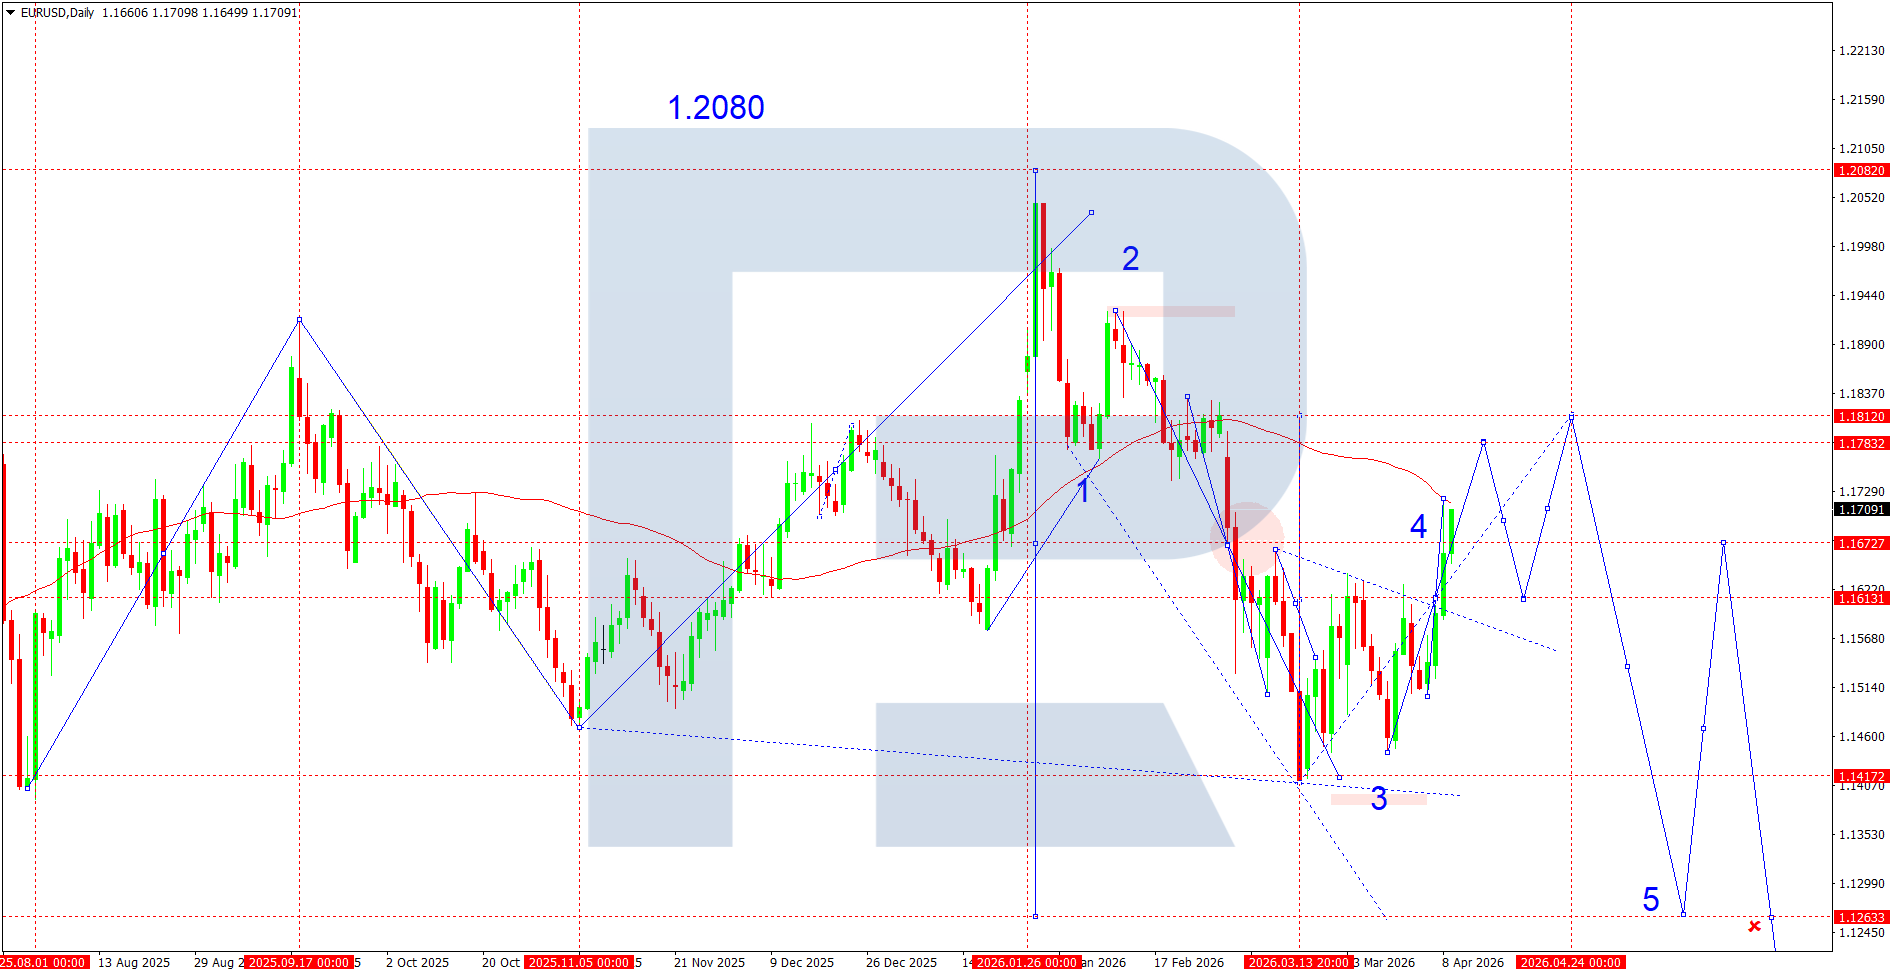
EURUSD technical analysis
On the daily chart, EURUSD maintains a downwards structure after forming a peak near 1.2080. The current structure indicates the development of a corrective wave following the completion of the downward impulse. The 1.1900–1.1940 area acted as a strong resistance zone, from which the decline began, forming a sequence of lower highs.
Price has consolidated below the moving average, confirming seller dominance in the medium term. Within the current structure, a local wave 4 is forming with potential growth towards 1.1720–1.1780, although this move remains corrective in nature. The 1.1670 area acts as an intermediate Pivot Point, where the market is determining short-term direction.
The lower boundary of the channel runs near 1.1417, where wave 3 previously formed. This level remains key support. A break below it will open potential for continued decline within wave 5 towards the 1.1300–1.1260 area. The structure indicates a narrowing range and preparation for an impulsive move downwards.
EURUSD forecast scenarios
Bearish (baseline): a decline from current levels with a break below 1.1613 and movement towards 1.1417.
Bullish (alternative): if price consolidates above 1.1720, growth towards 1.1783 is possible.
USDJPY forecast
During the past week, USDJPY continued trading near local highs, reflecting sustained demand for the US dollar amid persistent hawkish rhetoric from the US Federal Reserve (Fed). Recent US macroeconomic data indicate economic resilience: inflation remains above target levels, while the labour market shows stability. This reduces the likelihood of a near-term shift towards policy easing by the Fed. At the same time, the Bank of Japan (BoJ) continues to maintain a loose monetary policy stance despite some signals of rising domestic inflationary pressure. The interest rate differential remains a key driver supporting USD strength against the yen. Additional pressure on the yen comes from weak domestic demand and the regulator’s cautious stance on further tightening.
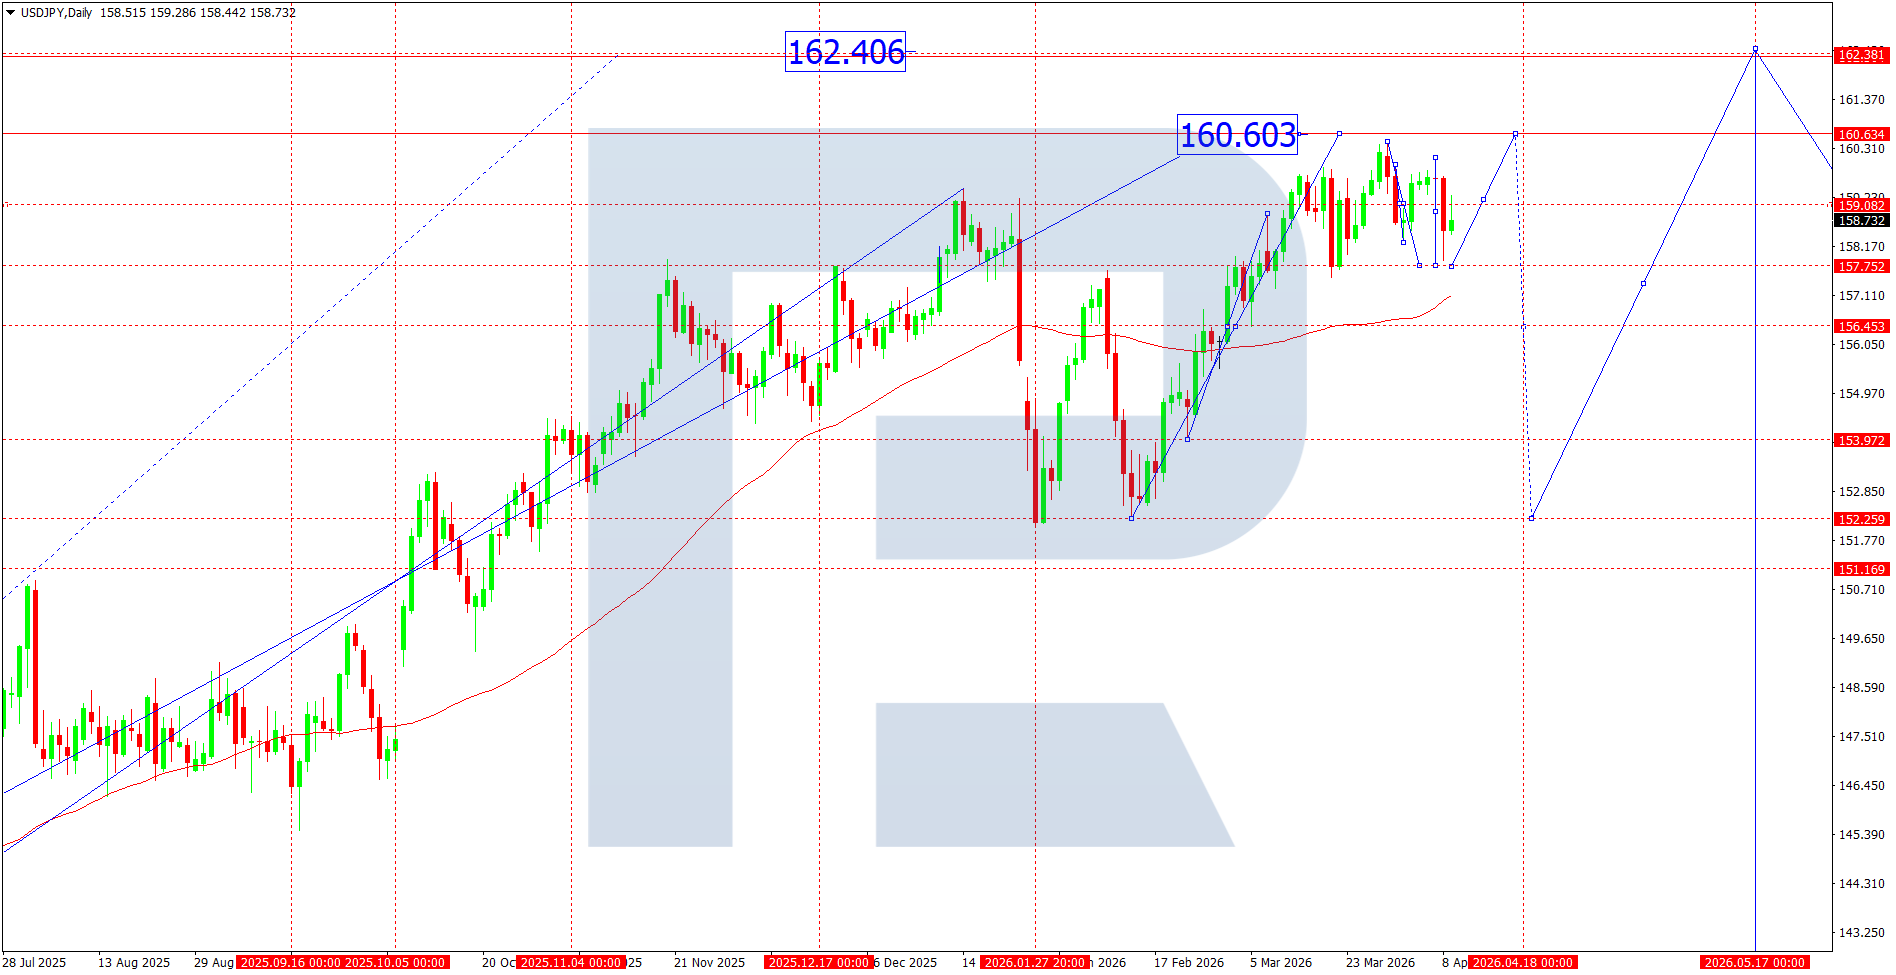
USDJPY technical analysis
From a technical perspective, the daily chart shows an ongoing upward structure with the formation of sequential higher lows. Price remains above the moving average, confirming buyer dominance. After an impulsive rise, the pair entered a consolidation phase within the 157.75–160.60 range, forming a corrective structure resembling a sideways flag. This range can be interpreted as an accumulation zone before a potential trend continuation.
The key resistance is located at 160.60, which previously capped upward movement. A repeated test increases the probability of a breakout if current momentum persists. A confirmed break above this level opens potential for movement towards 162.40, which is the primary target within the broader ascending channel.
On the downside, the 157.75 area remains key support, where strong buyer reactions previously occurred. A break below this level will deepen the correction towards 156.45, where dynamic support and the lower boundary of the local channel are located.
Thus, the current structure indicates a corrective phase within an uptrend, where the market is accumulating liquidity ahead of the next move.
USDJPY forecast scenarios
Bearish (baseline): a decline towards 156.45 following a break of 157.75.
Bullish (alternative): if price consolidates above 160.60, growth towards 162.40 is possible.
GBPUSD forecast
The fundamental backdrop remains mixed, with monetary policy and macroeconomic data from the US and the UK exerting dominant influence. Recent US inflation releases indicate persistent price pressure, reinforcing expectations of a prolonged period of elevated interest rates by the Federal Reserve (Fed). Fed rhetoric remains moderately hawkish, supporting the US dollar. At the same time, labour market data remain resilient, although signs of economic slowdown are becoming more visible.
In the UK, the Bank of England (BoE) faces a more complex environment: inflation remains above target, while economic activity shows weakness. Recent BoE commentary signals a pause in the tightening cycle, which puts pressure on sterling. Additional factors include political uncertainty and weak business activity indicators. As a result, the rate differential continues to favour the dollar.
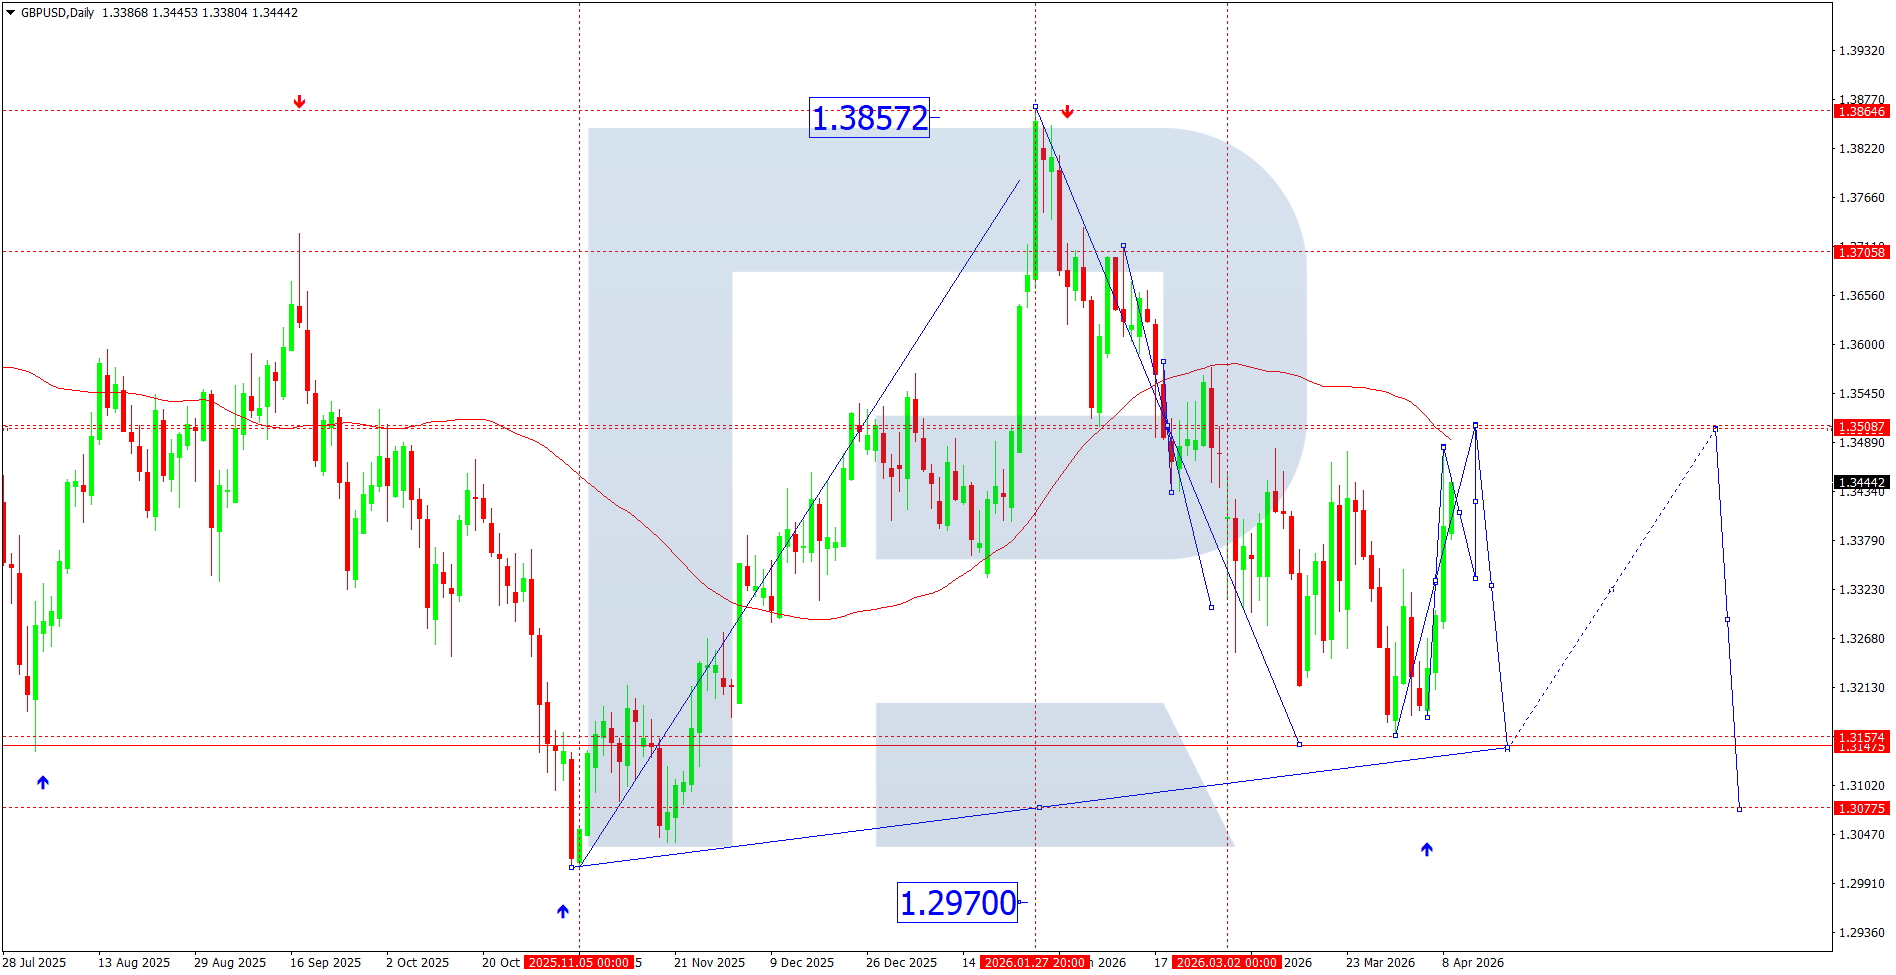
GBPUSD technical analysis
From a technical perspective, GBPUSD completed an upward corrective structure with a high near 1.3857 and then transitioned into a downward impulse phase. The formation of lower highs indicates the development of a downtrend. The current structure resembles a corrective pattern with a local range between 1.3157 and 1.3508.
Price has consolidated below the moving average, reinforcing seller pressure. Attempts to rise remain limited by the 1.3440–1.3508 zone, where supply concentration is observed. The local support at 1.3157 acts as a key level preventing deeper decline. A break below this level opens potential for movement towards 1.3077 and lower.
The wave structure indicates the completion of a corrective phase and the development of a new downward impulse. In the short term, consolidation may continue, followed by a break to the downside. The alternative scenario allows for a deeper corrective rise towards the resistance zone.
GBPUSD forecast scenarios
Bearish scenario (main): after a pullback towards 1.3440, a decline towards 1.3157 followed by a break towards 1.3077.
Bullish scenario (alternative): if 1.3508 is broken, growth towards 1.3705 is possible.
AUDUSD forecast
Next week, AUDUSD dynamics will depend on a combination of US and Chinese monetary policy and expectations in commodity markets. The Federal Reserve (Fed) continues to maintain a “higher for longer” stance, supporting the dollar. At the same time, recent US macro data indicate a moderate slowdown in inflation, which limits further USD strengthening potential. On the Australian side, the economy’s dependence on China remains a key factor: signs of stabilisation in China’s industrial sector provide limited support to the Australian dollar. The Reserve Bank of Australia (RBA) maintains a neutral stance without signalling imminent tightening, which constrains AUD growth. Additional pressure comes from reduced risk appetite amid geopolitical uncertainty and volatility in commodity markets.
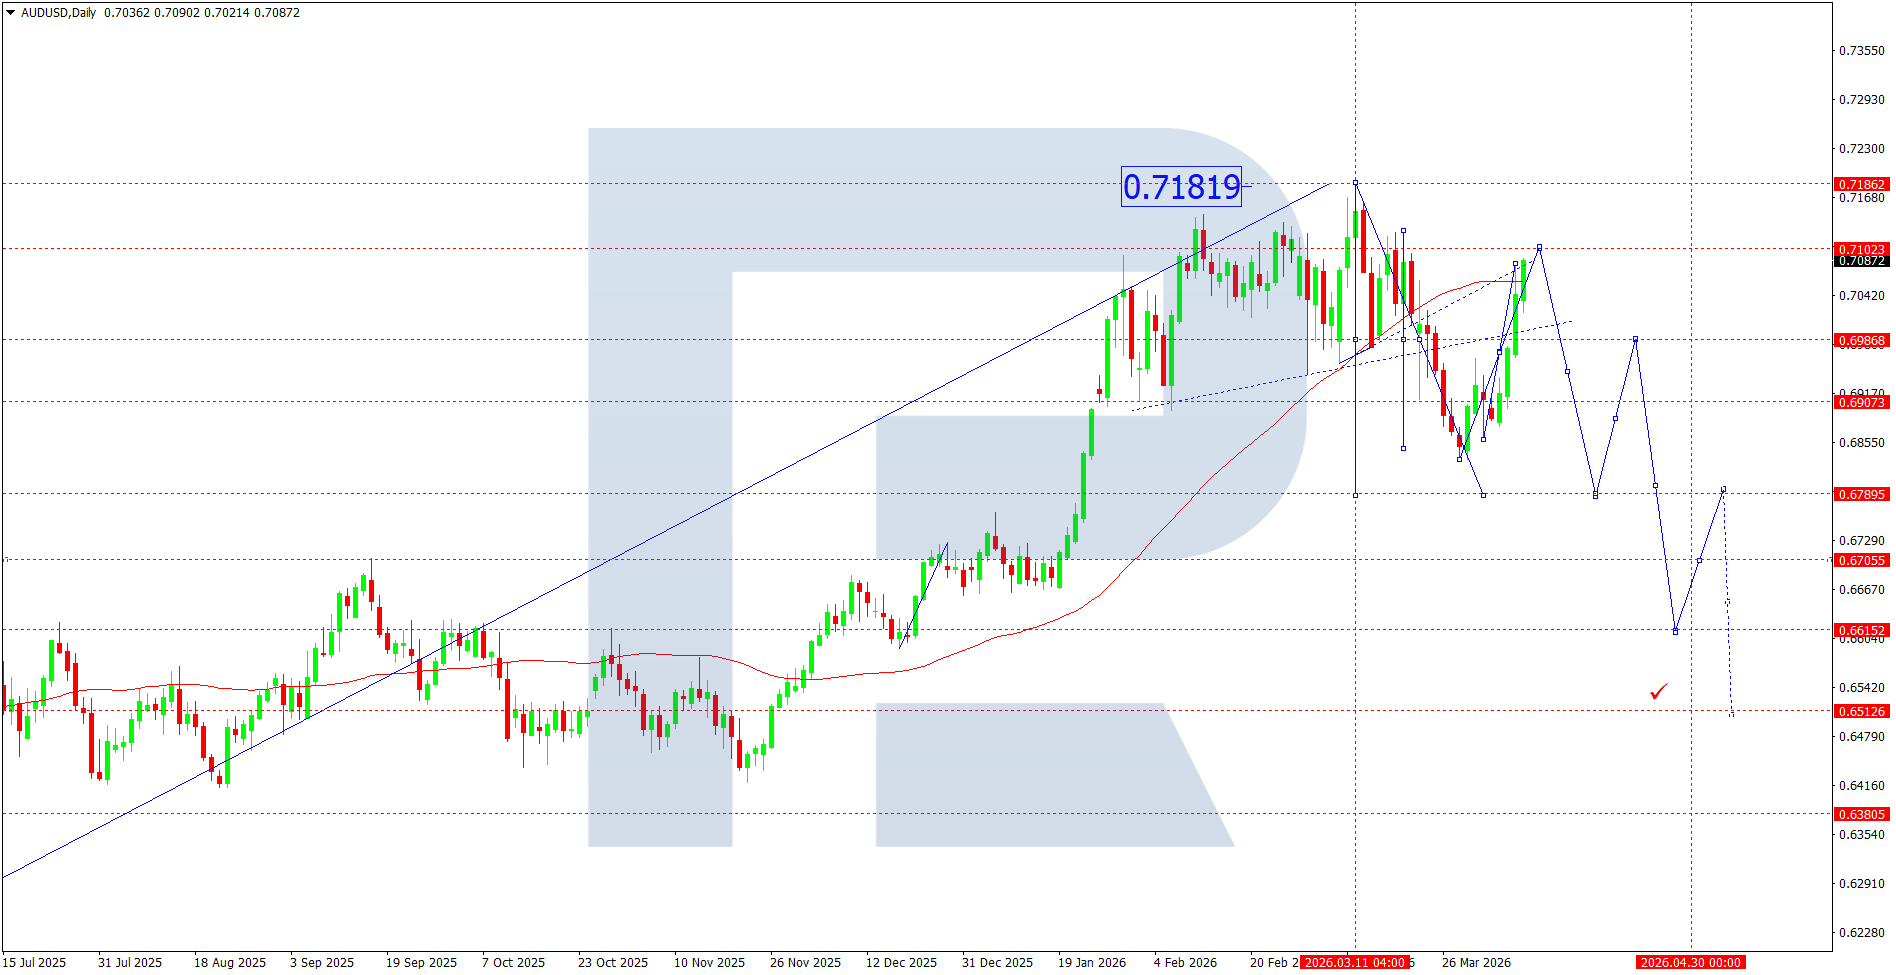
AUDUSD technical analysis
On the daily chart, AUDUSD maintains a corrective downward structure after forming a peak near 0.7182. Price tested the upper boundary of the ascending channel and shifted into a decline, breaking the local support at 0.7102, which acted as the first signal of weakening bullish momentum. The pair is currently trading near the 0.7087 area, which represents a short-term balance zone.
From a wave perspective, the structure shows completion of the upward phase and formation of a downward impulse with intermediate corrections. The 0.7102–0.7120 area acts as key resistance, from which price has repeatedly rebounded downwards. The moving average is also turning near current levels, reinforcing downside pressure.
The nearest support lies at 0.6986. A break below this level will open the path to a deeper correction towards 0.6907 and then 0.6795. The structure indicates the likely formation of a downwards channel with step-by-step renewal of lows. The alternative scenario implies a return above 0.7102 with a subsequent test of 0.7182, although this requires a strong fundamental catalyst.
AUDUSD forecast scenarios
Bearish scenario (baseline): a decline with a break of 0.6986 towards 0.6907.
Bullish scenario (alternative): consolidation above 0.7102 will open the way to growth towards 0.7182.
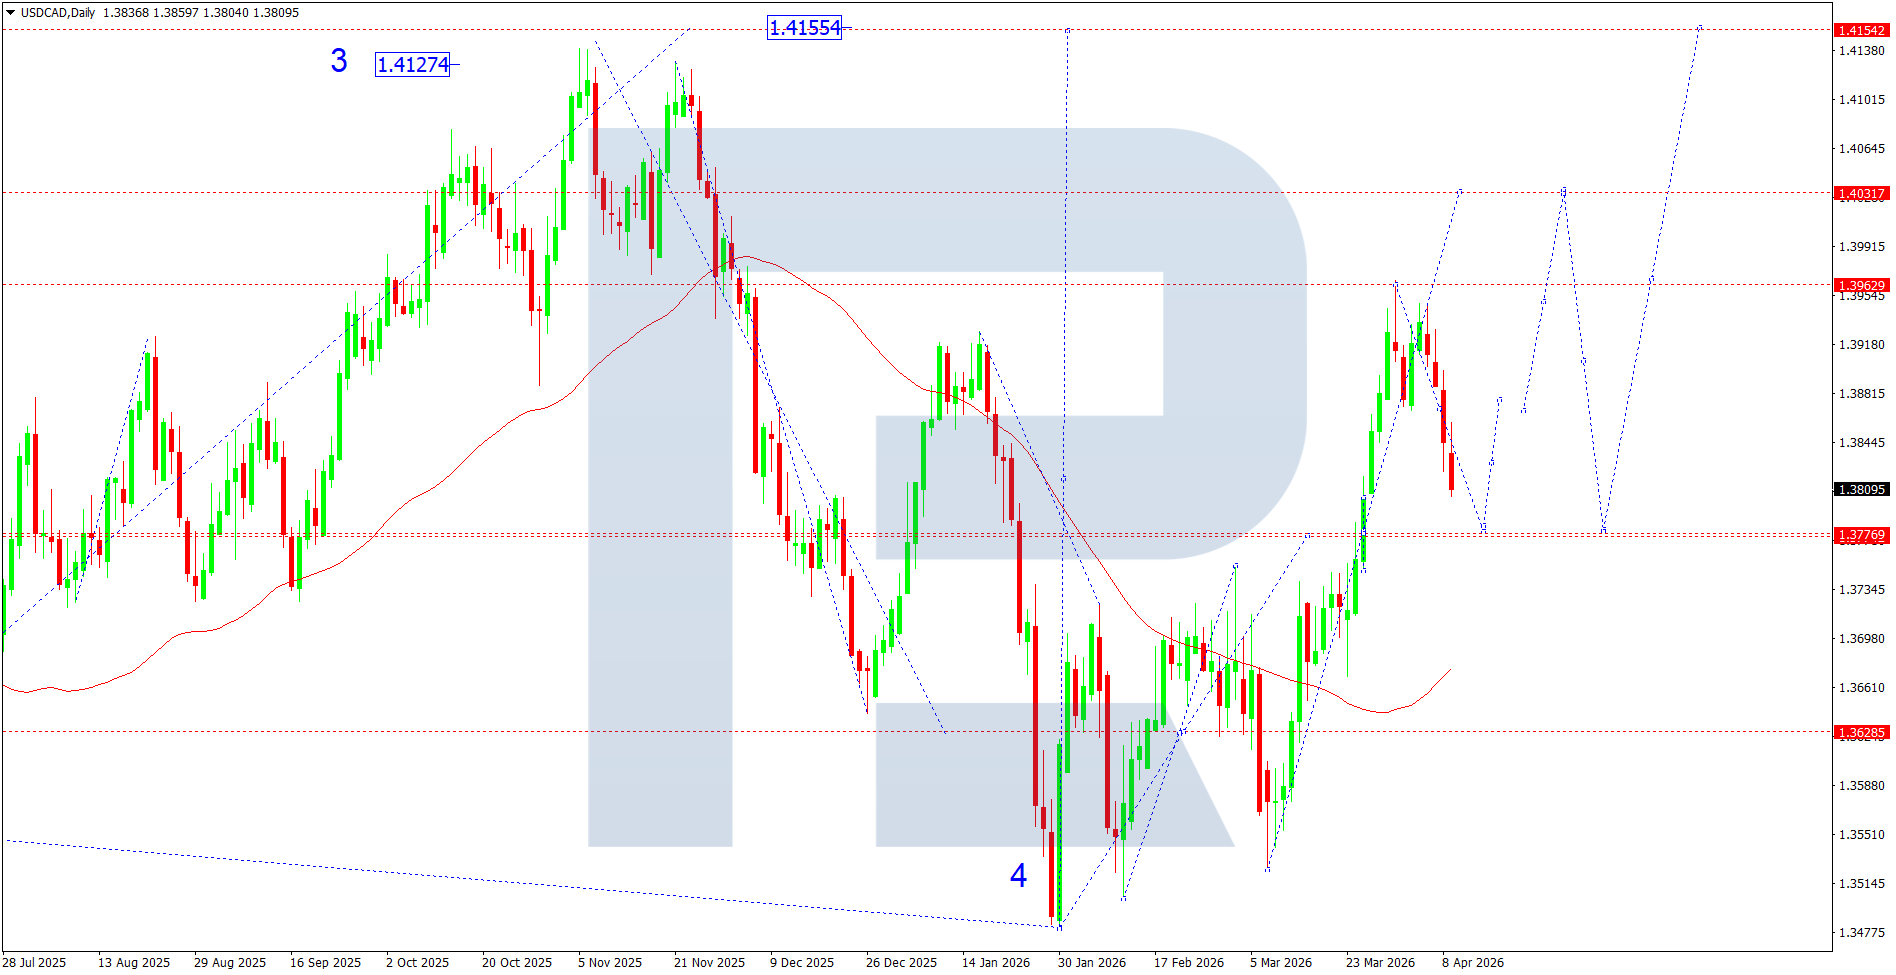
USDCAD forecast
During the past week, USDCAD dynamics were shaped by mixed factors: on one hand, the US dollar gained support from resilient macroeconomic data and expectations of continued hawkish Fed rhetoric; on the other, the Canadian dollar strengthened amid stabilising oil prices and expectations of less aggressive easing from the Bank of Canada (BoC). The market continues to monitor US inflation indicators, which determine the future path of Fed policy. In Canada, the key driver remains the commodity sector and BoC commentary regarding economic slowdown. The overall backdrop remains mixed: the dollar retains its safe-haven status, but its upside potential is limited, creating conditions for consolidation.
USDCAD technical analysis
From a technical perspective, the daily chart shows a medium-term downtrend structure after forming a peak near 1.4155. The impulsive decline completed near 1.3477, where wave 4 formed, followed by a recovery. The current structure indicates the development of an upward corrective phase, although price has approached the 1.3962–1.4031 resistance zone, where growth is slowing.
Price is trading near 1.3809 and holding above the local support at 1.3776, which maintains the probability of forming a short-term ascending channel. The moving average acts as dynamic resistance, limiting further growth. The wave structure indicates possible completion of the local correction and a transition to a new downward impulse upon a break of key support.
A descending channel from the highs is also visible, with the current rise appearing as a corrective wave within it. A rebound from the 1.3962 area may confirm continued seller pressure and resumption of the downward move with targets below 1.3776.
USDCAD forecast scenarios
Bullish (main): if price consolidates above 1.3962, growth towards 1.4031 is possible with further potential towards 1.4155.
Bearish (alternative): if 1.3776 is broken, a decline towards 1.3628 is expected with possible continuation towards 1.3600.
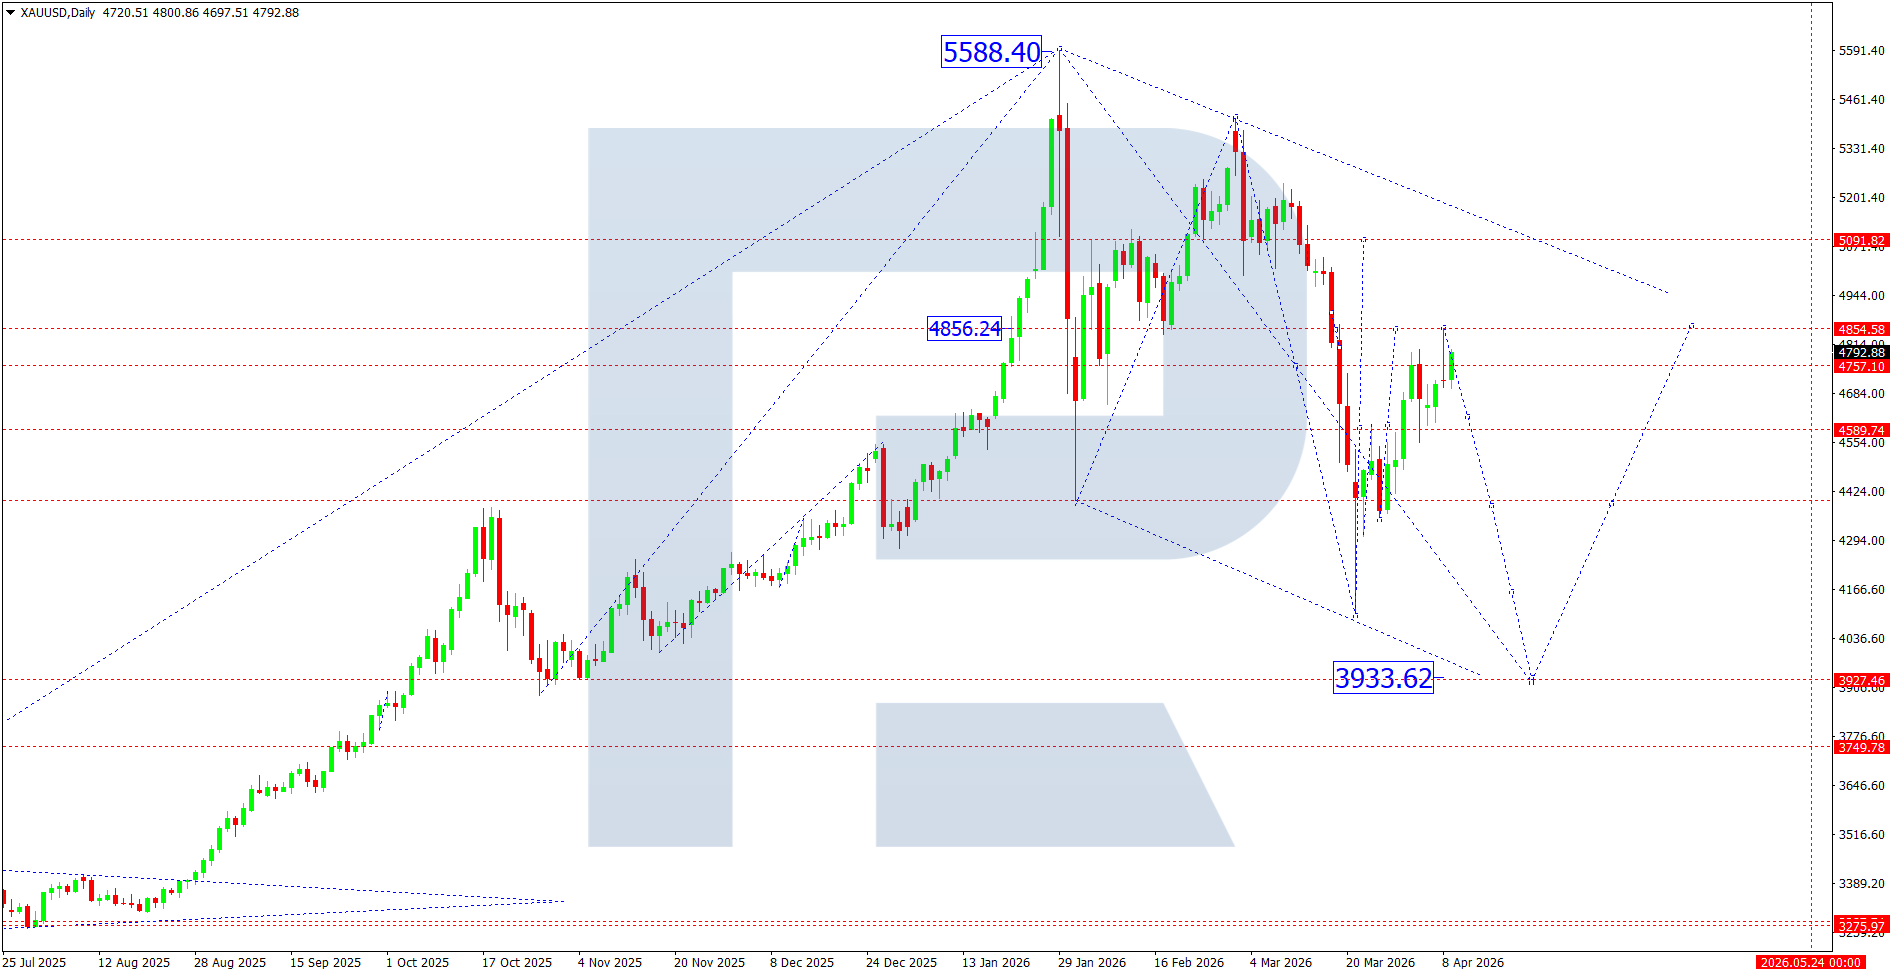
XAUUSD forecast
Next week, the key driver for gold remains US dollar dynamics and expectations regarding monetary policy. Recent US macroeconomic data indicate continued economic resilience, although inflation remains uneven. This supports a cautious stance by the Federal Reserve (Fed), which continues to signal a data-dependent approach. The market broadly prices in a prolonged period of high rates, which puts pressure on gold as a non-yielding asset. At the same time, geopolitical tension and safe-haven demand continue to support prices, limiting downside potential. Additional focus will be on US inflation and labour market data, as well as Treasury yield dynamics.
XAUUSD technical analysis
From a technical perspective, the daily chart shows a corrective downward structure after the peak near 5,588. Price completed a downward impulse followed by a wave correction, with the current consolidation developing within the 4,589–4,854 range. A rebound from 3,933 formed a local upward impulse, but it remains corrective within a broader downward structure.
The key resistance lies in the 4,854–5,091 zone, where the upper boundary of the current channel and previous supply levels are located. Failed attempts to consolidate above this area indicate continued seller pressure. At the same time, local support is formed near 4,589; a break below this level will open potential for a retest of 4,424 and then the key target at 3,933.
The wave structure suggests the potential formation of a downward impulse after the current correction completes. The scenario of a new downward wave remains dominant while price holds below 4,854.
XAUUSD forecast scenarios
Bearish (main): a decline from current levels with a break of 4,589 towards 4,424 and 3,933.
Bullish scenario (alternative): consolidation above 4,854 may lead to growth towards 5,091 with the potential for a deeper correction.
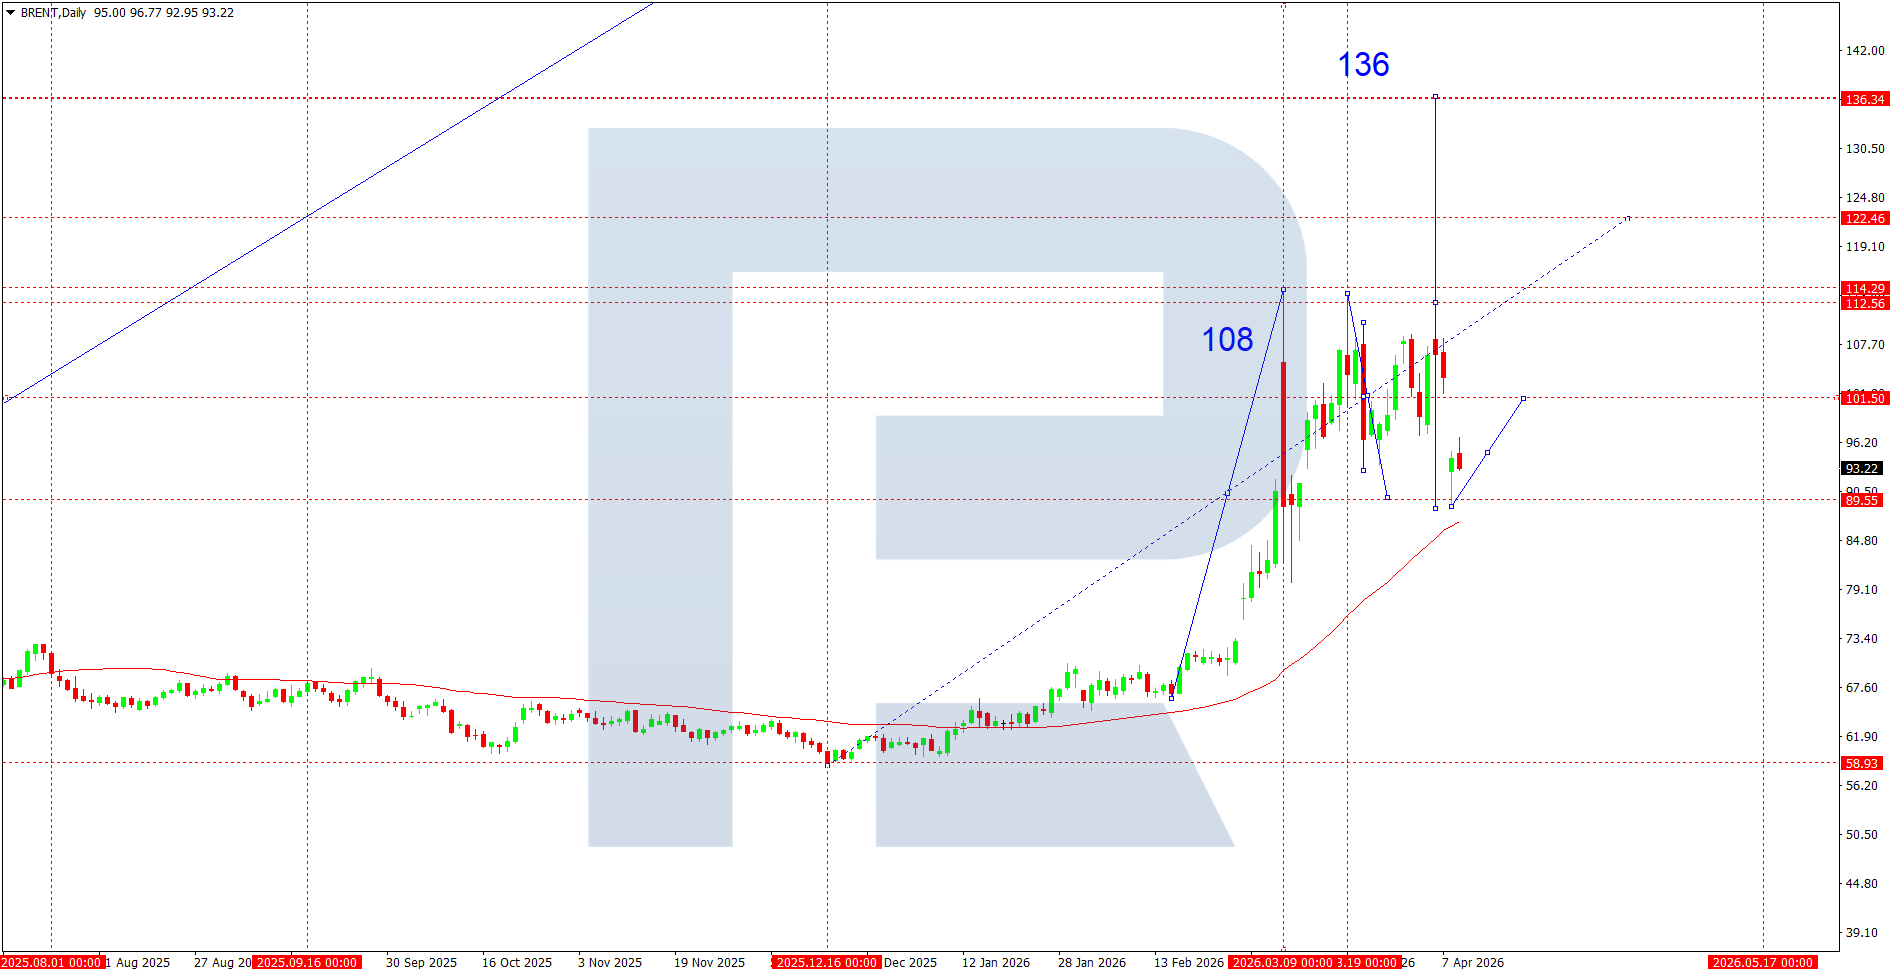
Brent forecast
The oil market maintains elevated volatility amid a combination of geopolitical factors and expectations regarding global demand. Investor focus remains on OPEC+ policy, which continues to control supply, as well as US inventory dynamics. Recent data indicate a moderate drawdown in inventories, supporting prices, although concerns about a slowdown in the global economy limit upside potential. An additional factor is Federal Reserve (Fed) policy, which maintains a hawkish stance, supporting the dollar and thereby constraining commodity price growth. At the same time, demand recovery from Asia, particularly China, continues to provide medium-term support to the oil market.
Brent technical analysis
On the daily chart, Brent maintains an upward structure following a strong impulse from below 70.00 to highs near 108.00 and further towards the 136.00 extreme, which acts as a key medium-term target and reference point. After forming the peak, the market shifted into a phase of correction and consolidation.
The current structure resembles the formation of a corrective pattern, with price holding above the key support zone at 89.55. This area acts as a Pivot Point, from which the market has already demonstrated buyer reaction. Locally, an ascending channel is forming, with gradual recovery following the decline.
The 101.50 resistance acts as the nearest barrier for further growth. Consolidation above this zone will open potential for a move back towards 108.00, where an intermediate high previously formed. If momentum develops above 108.00, the market may target expansion towards 112.50 and further to 122.50.
On the downside, the 89.55 zone remains critical, aligning with local lows and a demand area. A break below this level will deepen the correction, with potential movement towards 80.00 and further to the 73.00 area, where a previous accumulation base is located.
In the medium term, the structure remains bullish while price holds above the ascending trendline and the 200-day moving average.
Brent forecast scenarios
Bullish scenario (main): consolidation above 101.50 will open potential for growth towards 108.00 with further movement into the 112.50–122.50 zone.
Bearish scenario (alternative): a break below 89.55 will increase pressure and lead to a decline towards 80.00.
Editors’ picks
 EURUSD 2026-2027 forecast: key market trends and future predictions
This article provides the EURUSD forecast for 2026 and 2027 and highlights the main factors determining the direction of the pair’s movements. We will apply technical analysis, take into account the opinions of leading experts, large banks, and financial institutions, and study AI-based forecasts. This comprehensive insight into EURUSD predictions should help investors and traders make informed decisions.
 Gold (XAUUSD) forecast 2026 and beyond: expert insights, price predictions, and analysis
Dive deep into the Gold (XAUUSD) price outlook for 2026 and beyond, combining technical analysis, expert forecasts, and key macroeconomic factors. It explains the drivers behind gold’s recent surge, explores potential scenarios including a move toward 4,500 to 5,000 USD per ounce, and highlights why the metal remains a strong hedge during global uncertainty.
Forecasts presented in this section only reflect the author’s private opinion and should not be considered as guidance for trading. RoboForex bears no responsibility for trading results based on trading recommendations described in these analytical reviews.