Weekly technical analysis and forecast (20–24 April 2026)
In this weekly technical analysis, we review key chart patterns and levels for EUSUSD, USDJPY, GBPUSD, AUDUSD, USDCAD, gold (XAUUSD), and Brent oil to forecast developments for the upcoming week (20–24 April 2026)
Major technical levels to watch this week
- EURUSD: Support: 1.1684, 1.1640. Resistance: 1.1820, 1.1882
- USDJPY: Support: 157.40, 156.70. Resistance: 159.80, 160.60
- GBPUSD: Support: 1.3420, 1.3130. Resistance: 1.3590, 1.3690
- AUDUSD: Support: 0.7095, 0.7015. Resistance: 0.7195, 0.7357
- USDCAD: Support: 1.3700, 1.3686. Resistance: 1.3967, 1.4009
- Gold: Support: 4,571, 4,297. Resistance: 5,027, 5,200
- Brent: Support: 88.34, 80.00. Resistance: 105.73, 121.42
EURUSD forecast
Last week, the key driver for EURUSD remained the divergence in central bank monetary policy and rhetoric. The European Central Bank continues to demonstrate a cautious approach, signalling a pause in policy easing against a backdrop of persistent inflation in the services sector. At the same time, the US Federal Reserve maintains hawkish rhetoric, supported by strong labour market data and resilient consumer demand. The latest US macroeconomic reports have increased expectations that high rates will be held for longer, which is supporting the dollar. Additional pressure on the euro comes from weak performance in the eurozone industrial sector and persistent risks of a slowdown in the German economy. The geopolitical backdrop remains neutral, but markets are closely watching US Treasury yield dynamics, which continue to set direction for the FX market.
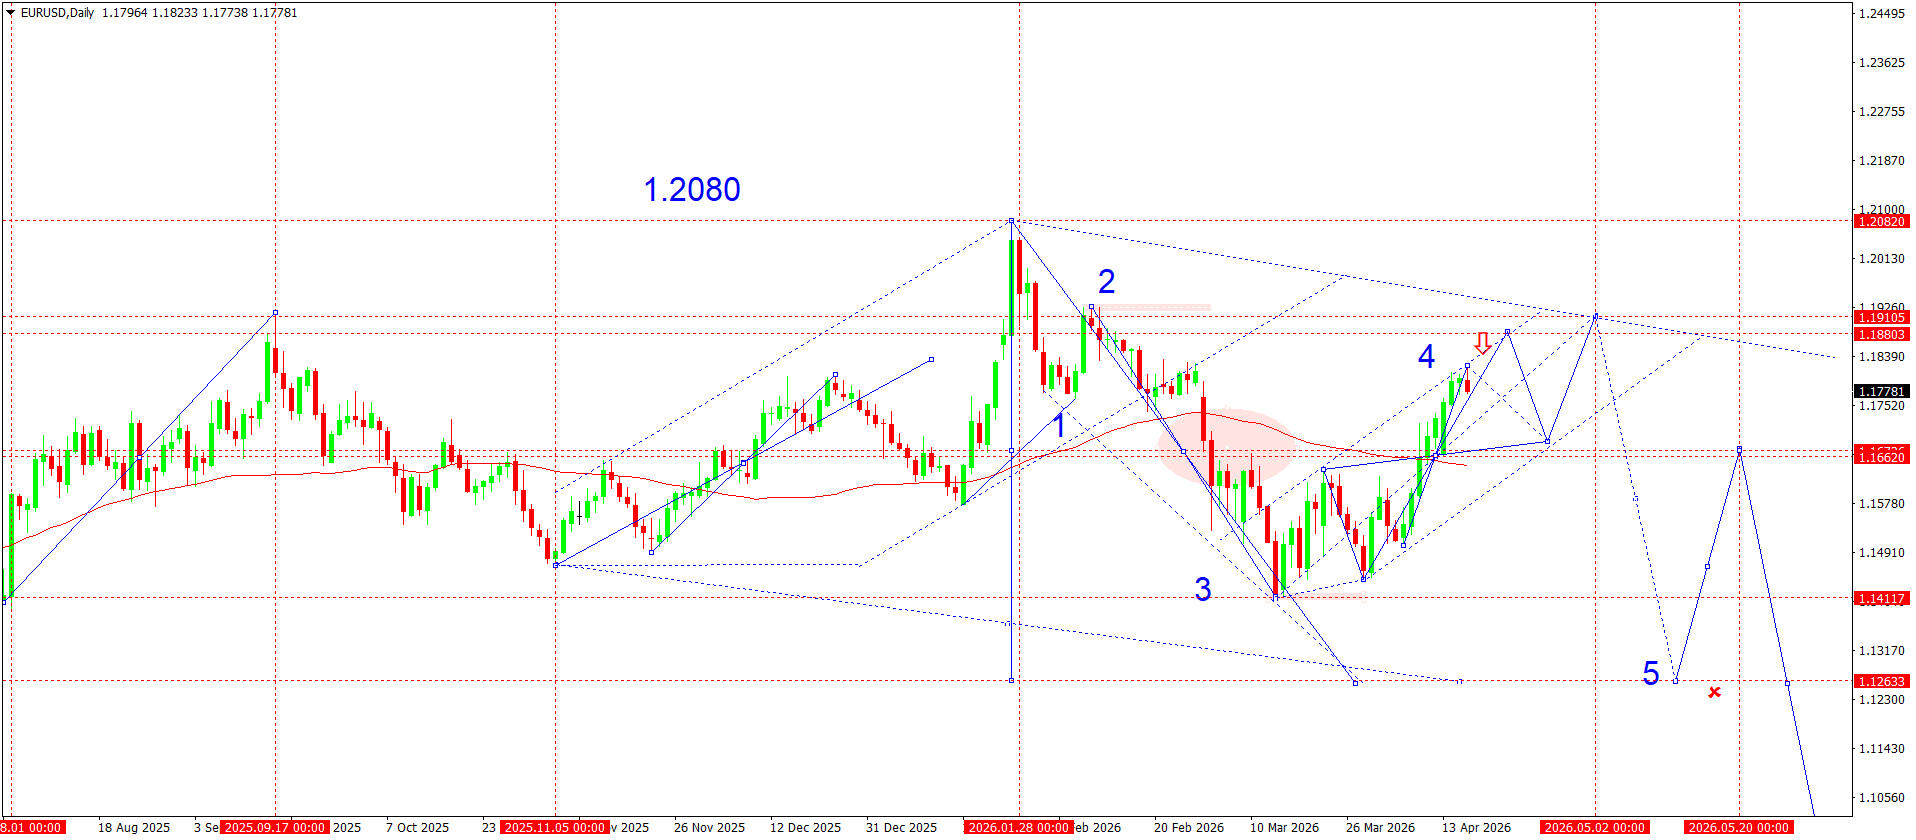
EURUSD technical analysis
On the daily chart, EURUSD is forming a corrective structure after the impulsive rise to 1.2080. The current wave count points to the development of a downward wave within a broader correction. After wave 2 was completed, the market formed an impulsive decline to 1.1411, marking wave 3, which confirms stronger bearish pressure.
This is now followed by the formation of an upward correction in the form of wave 4, which is currently testing the 1.1882–1.1910 resistance zone. This area coincides with the upper boundary of the downward channel and local highs, which increases the probability of a reversal.
The scenario involving the formation of wave 5 down remains the priority. The potential downside target is located near 1.1263, where the lower boundary of the expanding channel runs. The structure of the move points to possible acceleration if the intermediate support at 1.1662 is broken, as this acts as a key balance zone.
If the market consolidates above 1.1910, the structure may become more complex, and the correction will take on a more extended character with a test of the upper boundary of the channel.
EURUSD forecast scenarios
Bearish (baseline): a decline from 1.1882–1.1910 towards 1.1684 and then to 1.1640
Bullish (alternative): if 1.1820 is broken, growth towards 1.1882 is possible
USDJPY forecast
The fundamental backdrop in the market remains mixed, but investors are focusing mainly on the interest rate differential between the US and Japan. The US Federal Reserve continues to maintain hawkish rhetoric against a backdrop of persistent inflation and a strong labour market, which supports US bond yields. At the same time, the Bank of Japan is gradually shifting towards policy normalisation, but actual steps remain extremely cautious. Recent comments from BoJ representatives confirm readiness for further changes, but without abrupt moves. This continues to put pressure on the yen. In addition, the market is taking into account rising geopolitical risks and equity index dynamics, which periodically increase demand for safe-haven assets, including the yen. Nevertheless, the overall balance of factors still favours the dollar.
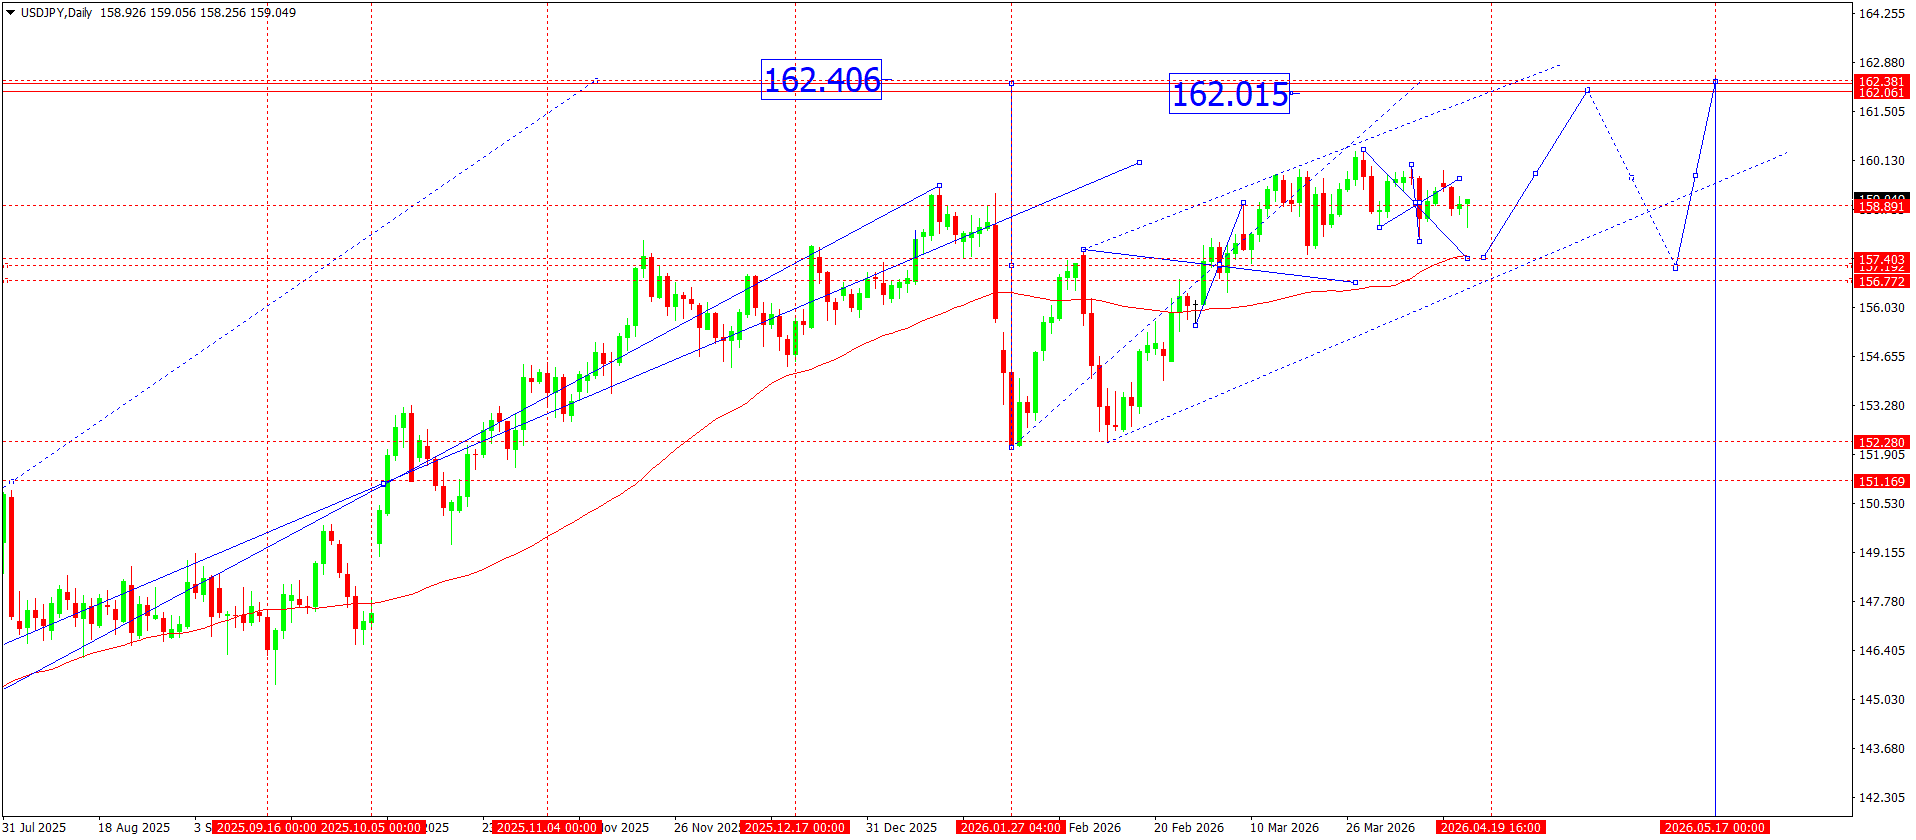
USDJPY technical analysis
From a technical perspective, USDJPY retains an upward structure on the daily timeframe. After a corrective decline to the 151.90–152.30 area, the market formed an impulse upwards and consolidated above the key 157.40–157.00 zone, where local support and the medium-term balance line are located. The current consolidation is developing in the form of a narrowing structure close to a triangle, which points to accumulation ahead of the next move. Price is holding above the moving average, which confirms the preservation of bullish control.
The upper boundary of the range runs through the 158.80–159.00 area, where profit-taking has been observed repeatedly. A break of this zone will open the way to a retest of the key highs at 162.00–162.40, which act as the main target of the current upward impulse. Alternatively, if pressure intensifies, a pullback to the lower boundary of the pattern in the 156.70–156.50 area is possible, where dynamic support and the previous accumulation zone are located.
Structurally, the move fits into a continuing upward wave, where the current consolidation may be regarded as a corrective phase before a new upward impulse. At the same time, it is important to take into account that the market remains sensitive to fundamental drivers, especially to changes in rate expectations.
USDJPY forecast scenarios
Bearish (baseline): a decline to 156.70 with a possible test of 155.80 if support is broken.
Bullish (alternative): a break of 159.00 will lead to growth into the 160.60 area and then to 162.00.
GBPUSD forecast
The fundamental backdrop for GBPUSD over the coming week is being shaped by mixed factors from both the US and the UK. The market’s main focus is on expectations regarding the Federal Reserve and the Bank of England’s rate policy. The latest US inflation data show signs of slowing, but the labour market remains resilient, which restrains aggressive expectations for Fed rate cuts. This supports the dollar. At the same time, the Bank of England maintains cautious rhetoric, pointing to the need to keep rates high for longer because of persistent inflation pressure in the services sector.
Additional pressure on sterling comes from weak UK economic activity, including slower consumer demand. Geopolitical tension and swings in bond yields are also increasing volatility in the currency market. Overall, the fundamental backdrop remains mixed, but with a moderate advantage for the dollar.
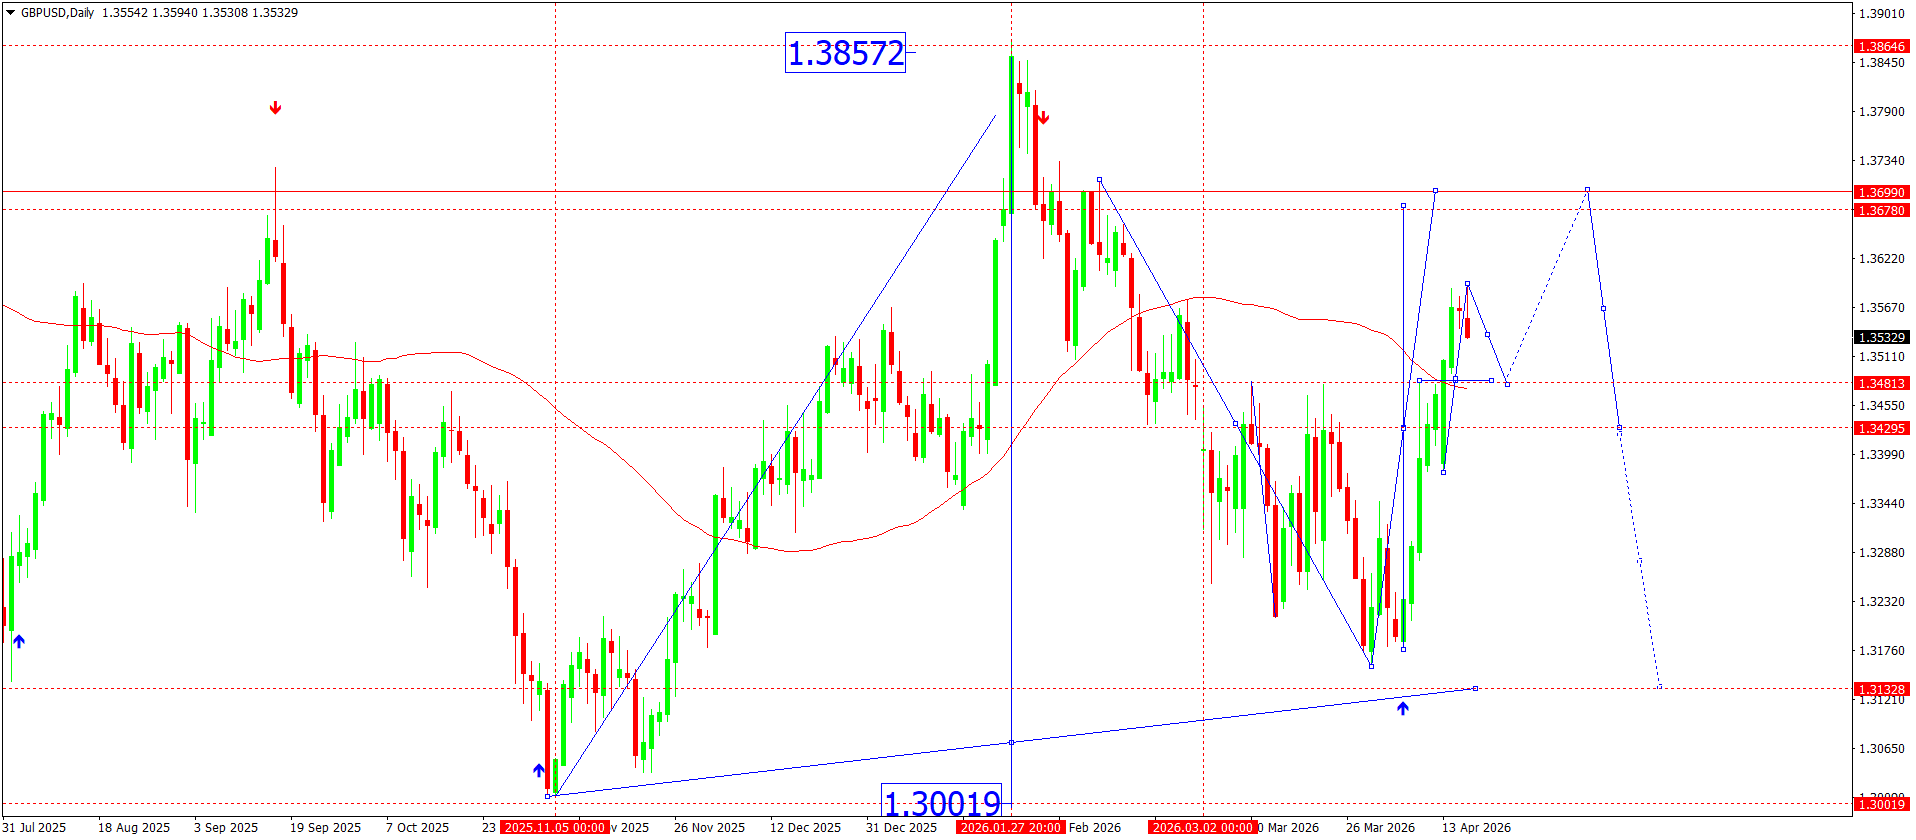
GBPUSD technical analysis
On the daily chart, GBPUSD retains a downward corrective structure after forming a medium-term high near 1.3857. Price completed an impulsive decline, followed by a local upward pullback.
The current structure points to the development of an upward corrective wave within a broader downward trend. The rise from the 1.3170 area looks like a recovery impulse approaching the 1.3590–1.3690 resistance zone. This area coincides with previous distribution levels and dynamic resistance from the moving average.
The rebound from 1.3480 confirms short-term demand, but the move structure remains zigzag-shaped, which is typical of a correction. As the price approaches 1.3590, momentum is slowing, which increases the probability of a reversal pattern forming.
The continuation of the rise is possible only if the market consolidates above 1.3590, which will open the way to a retest of 1.3690. However, the baseline scenario assumes the correction will be completed, and the downward move will resume with a break of 1.3420 and further decline towards 1.3130, where the long-term support line runs.
GBPUSD forecast scenarios
Bearish scenario (main): a decline from 1.3590 towards 1.3420 followed by movement to 1.3130.
Bullish scenario (alternative): if 1.3590 is broken, growth towards 1.3690 is possible.
AUDUSD forecast
Over the coming week, AUDUSD dynamics will be shaped by mixed fundamental factors. The US dollar remains resilient amid expectations that the US Federal Reserve will keep interest rates high for longer due to persistent inflationary pressures and a strong labour market. The latest US macroeconomic data confirm economic resilience, supporting demand for the dollar.
On the other hand, the Australian dollar is receiving moderate support from the stabilisation of commodity markets and recovering demand from China. However, the Reserve Bank of Australia continues to take a cautious stance, signalling a pause in policy tightening, which limits the AUD’s upside potential. Additional pressure comes from uncertainty in the global economy and weaker risk appetite, which traditionally weighs on commodity-linked currencies.
Thus, the fundamental backdrop remains mixed: a strong dollar against a moderately supported, but still vulnerable, Australian dollar.
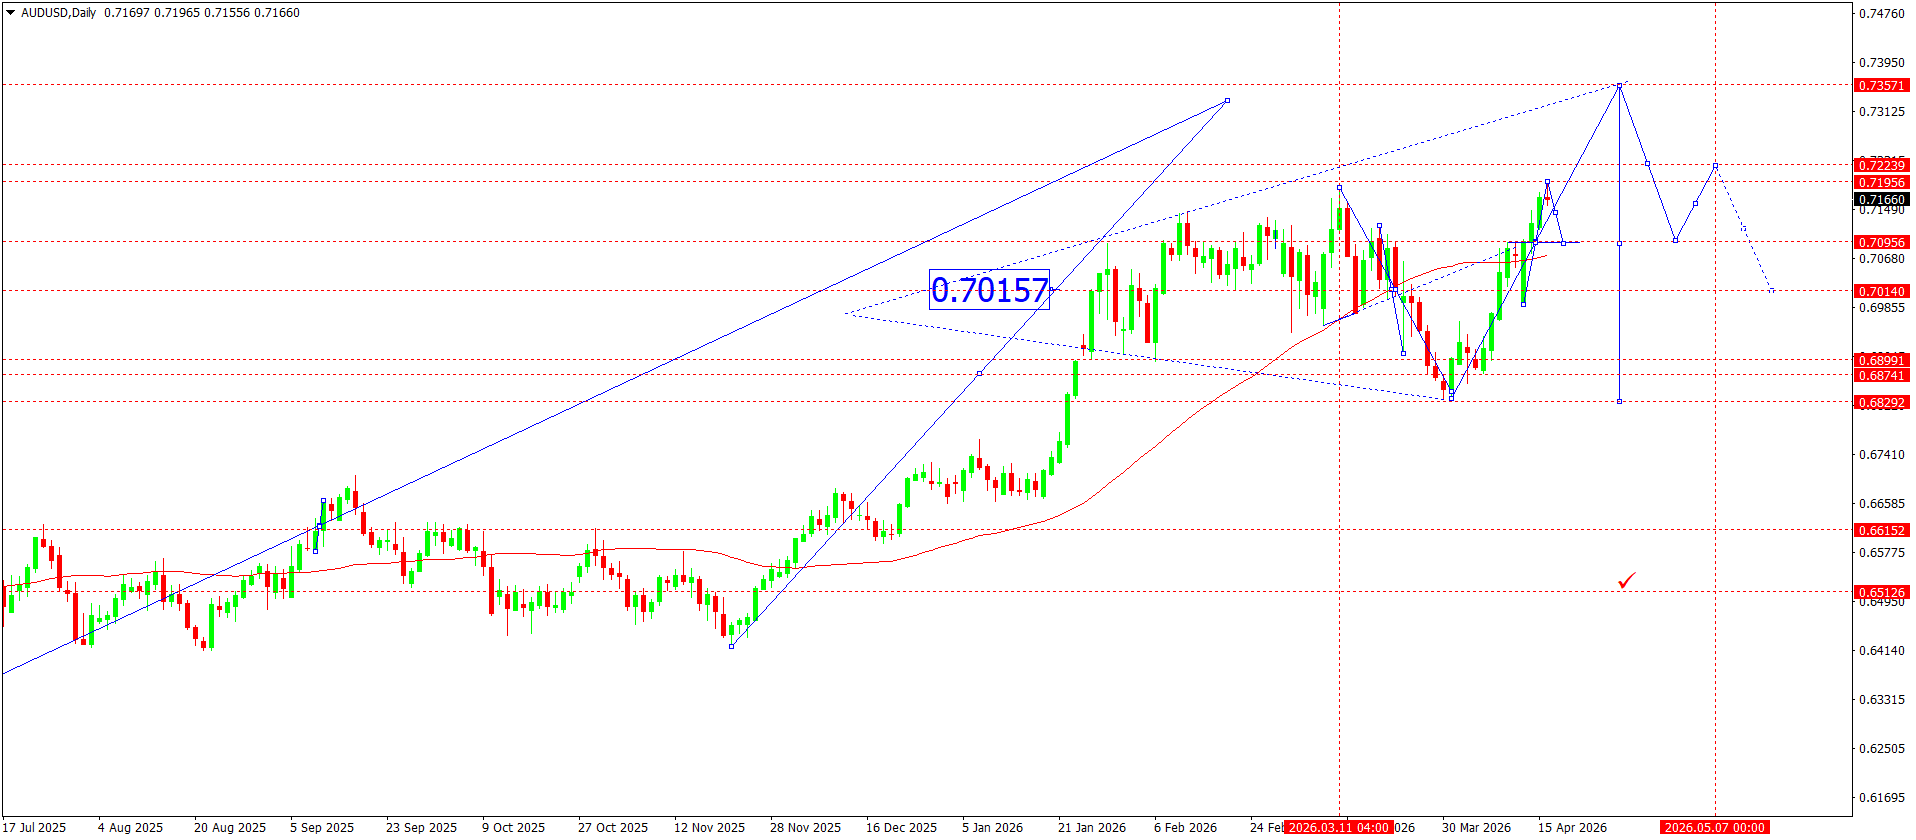
AUDUSD technical analysis
On the daily chart, AUDUSD retains an upward structure with a medium-term momentum forming from the 0.6400 area. The price has consolidated above the moving average, confirming the ongoing bullish sentiment in the medium term.
At present, the market is trading within an expanding channel, with the key balance zone near 0.7015. After a corrective decline to 0.6899, an upward reversal impulse formed, signalling an attempt to resume growth.
The 0.7095–0.7195 area acts as key resistance, where consolidation and profit-taking were previously observed. A breakout of this zone would open the way to the upper boundary of the channel and the main target near 0.7357.
At the same time, the move structure suggests a possible corrective wave if the price fails to consolidate above 0.7195. A return below 0.7095 will add to pressure and may lead to a retest of 0.7015, where the local pivot point is located.
The wave structure indicates the completion of the correction and the start of a new impulsive phase, although confirmation is required through a breakout of the nearest highs.
AUDUSD forecast scenarios
Bearish scenario (baseline): a decline from current levels with a breakout below the 0.7095 level and movement towards 0.7015.
Bullish scenario (alternative): if the market consolidates above 0.7195, growth towards 0.7357 is possible.
USDCAD forecast
Over the coming week, USDCAD dynamics will be shaped by Federal Reserve and Bank of Canada policy, as well as oil market fluctuations. The latest US macroeconomic data show a moderate slowdown in inflation alongside a resilient labour market, which keeps the Fed’s tone cautiously hawkish. At the same time, the BoC is signalling a pause in policy tightening amid cooling economic activity and weaker consumer demand. Additional pressure on the Canadian dollar comes from unstable oil price dynamics, where volatility persists because of geopolitical factors and revised demand expectations. Overall, the fundamental backdrop remains mixed: the US dollar is supported by rates, while the Canadian currency depends on the commodity factor and domestic statistics.
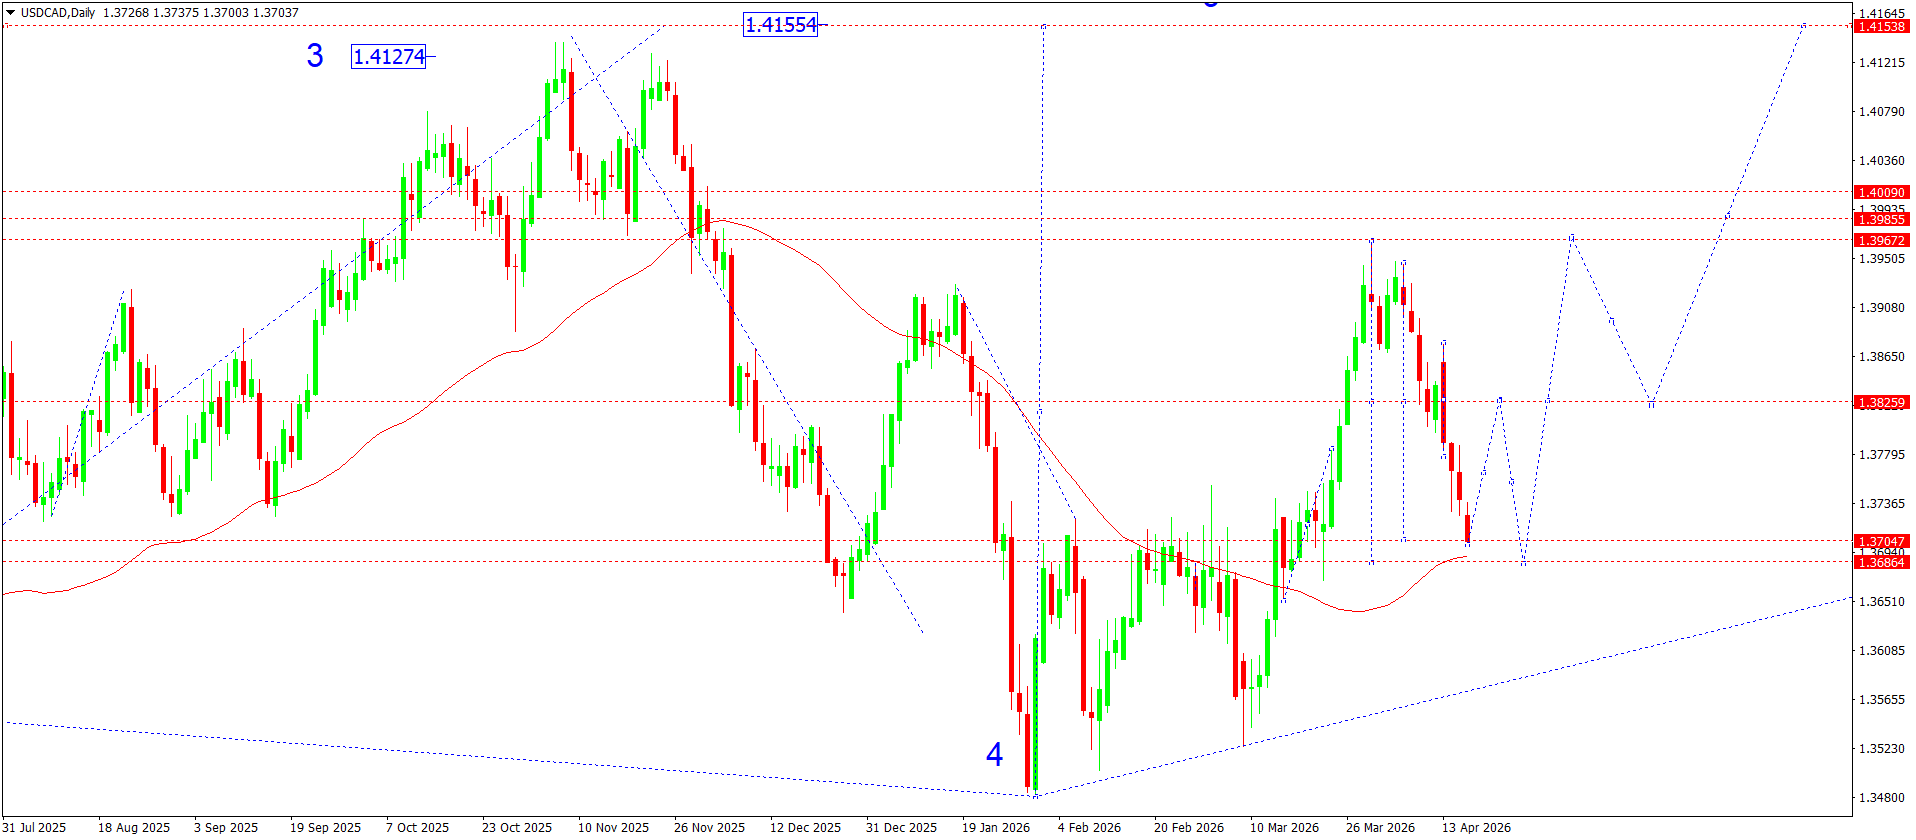
USDCAD technical analysis
On the daily chart, the structure of a downward correction remains intact after a peak was formed near 1.4155. The price completed an impulsive downward wave, followed by the formation of a local bottom near 1.3480, marked as wave 4. This was followed by a recovery move testing the 1.3900–1.4000 zone, but the price failed to consolidate above it, indicating buyer weakness.
The current structure points to the formation of a corrective channel with lower highs. The price is trading near the moving average, which acts as dynamic resistance. The 1.3825 area is an intermediate balance zone, from which the market has already formed several rebounds.
In terms of wave structure, the current decline may be regarded as the beginning of a new impulsive wave down after the correction is completed. At the same time, the 1.3700–1.3686 zone is important support, as it contains the local reversal level. A breakout of this area will strengthen the downward momentum.
Resistance in the 1.3967–1.4009 area remains the key barrier to continued growth. Only consolidation above this zone will open the potential for a return to the highs near 1.4155. Otherwise, selling remains the priority, with the formation of new lows.
USDCAD forecast scenarios
Bullish (alternative): growth above 1.3967 with consolidation will open the way to 1.4009, with the prospect of continuation to 1.4155
Bearish (baseline): if the price breaks below the 1.3686 level, a further decline towards 1.3600 is expected
XAUUSD forecast
The gold market is ending the week amid continued uncertainty surrounding monetary policy and inflation expectations. The main pressure on prices comes from Federal Reserve (Fed) rhetoric, which continues to signal the need to keep rates elevated for longer than expected. The latest US macroeconomic data points to a resilient labour market and moderate inflation, which reduces the probability of a near-term shift towards policy easing.
An additional factor is the dynamics of US Treasury yields – their rise is limiting gold’s potential, as it increases the alternative cost of holding a non-yielding asset. At the same time, geopolitical tensions and demand from central banks continue to support the market. Overall, the fundamental backdrop remains mixed: short-term pressure dominates, but medium-term demand remains in place.
XAUUSD technical analysis
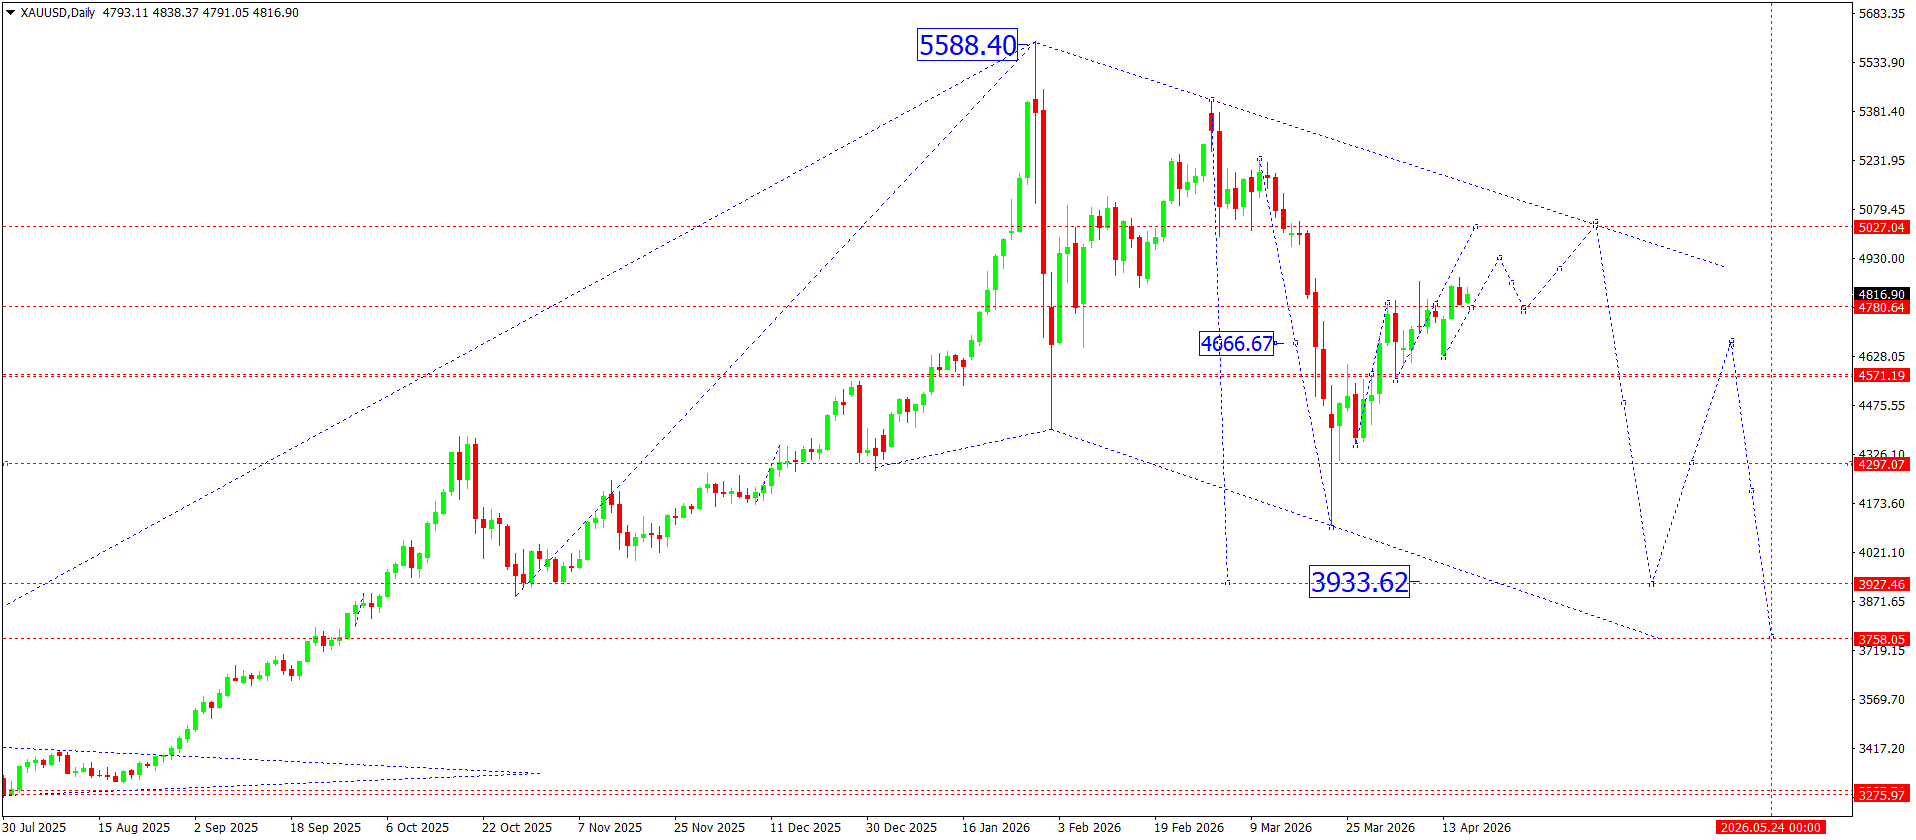
On the daily chart, XAUUSD retains a corrective structure after reaching the all-time high near 5,588. After the impulsive decline, prices formed a local low near 3,933, from which a recovery phase is developing.
Prices are currently consolidating within the 4,571–5,027 range, forming a sideways structure with signs of accumulation. The 4,666 level acts as the key pivot point, from which the upward momentum previously began. Consolidation above it confirms that local upward pressure remains in place.
From a technical perspective, the move from the 3,933 low may be interpreted as the initial phase of an upward corrective wave, where the current consolidation acts as an intermediate pause before the move continues. The upper boundary of the channel and the 5,000–5,027 zone remain strong resistance, where sellers are likely to appear.
If this range is broken, the structure will transition into a more stable uptrend with potential for a return to 5,200 and above. However, failure to consolidate above 4,800–4,900 will signal buyer weakness and the risk of a new downward wave with a retest of 4,571 and lower.
XAUUSD forecast scenarios
Bullish (baseline): growth with consolidation above 4,800 towards 5,027
Bearish (alternative): a breakout below 4,570 will open the way to 4,297
Brent forecast
At this stage, the oil market retains a mixed fundamental backdrop. On the one hand, prices are supported by persistent geopolitical tensions in the Middle East and risks of supply disruptions, which traditionally create a risk premium in oil prices. The market is also supported by expectations of a gradual recovery in demand from China amid stimulus measures by the authorities. On the other hand, pressure remains due to uncertainty in the global economy and expectations of a prolonged period of high interest rates from the Fed, which limits demand for commodity assets. Market participants also continue to monitor OPEC+ policy, which maintains a focus on supply control, although the market has already partially priced in these factors. Overall, the fundamental backdrop remains neutral to positive, but without a distinct driver for a sustained trend.
Brent technical analysis
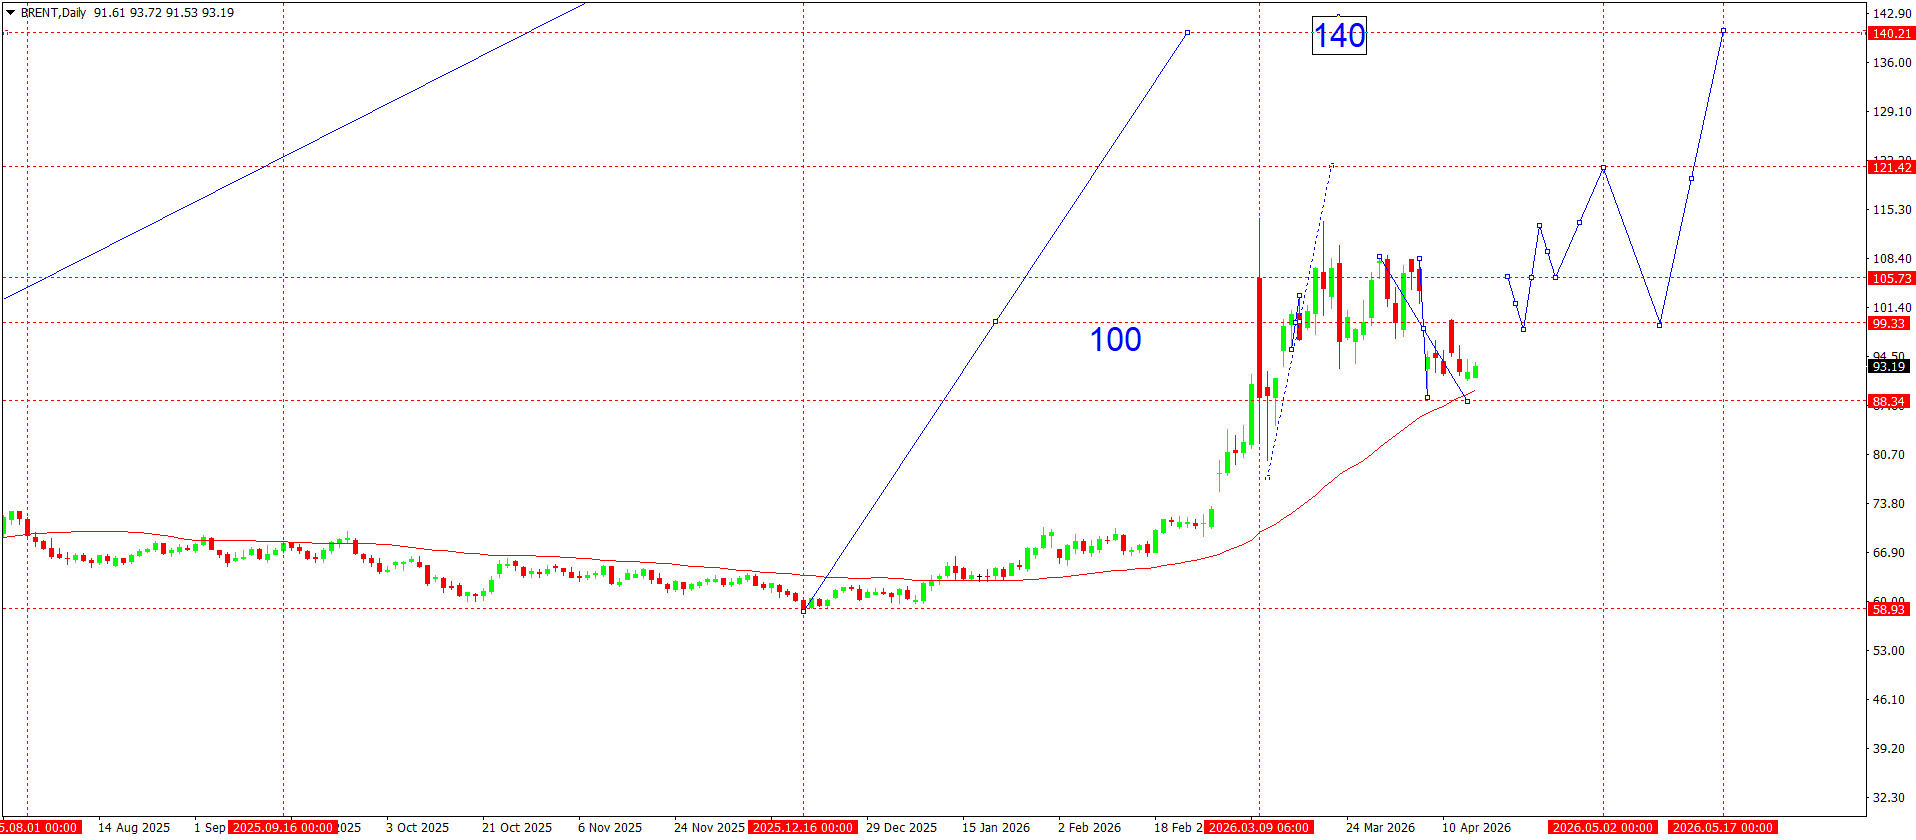
On the daily chart, Brent retains an upward structure after forming a base near 58.93 and then an impulsive rise to the area above 100.00. This impulse may be regarded as the formation of the main upward wave, with the intermediate target at 100 already reached. After that, the market shifted into a correction phase, forming a local downward structure while holding above the key 88.34 support zone.
Prices are currently consolidating within the 88.34–105.73 range, forming a potential corrective pattern ahead of the next move. An important signal remains the fact that prices are holding above the moving average, indicating a continuation of the medium-term uptrend.
In terms of wave structure, the current correction looks like the completion of a local wave with the possible formation of a new impulsive phase upwards. In this case, the upside scenario suggests a retest of 105.73, followed by a move to 121.42, and in the broader perspective to the 140.21 area, which acts as the strategic target.
The alternative scenario suggests a deeper correction with a breakout below 88.34, which will open room for a decline to 80.00 and lower. At present, however, this remains the less likely outcome.
Brent forecast scenarios
Bullish scenario (main): if prices hold above 88.34 and break above the 105.73 level, growth towards 121.42 is possible.
Bearish scenario (alternative): if the 88.34 level is broken, the decline may continue to 80.00.
Editors’ picks
 EURUSD 2026-2027 forecast: key market trends and future predictions
This article provides the EURUSD forecast for 2026 and 2027 and highlights the main factors determining the direction of the pair’s movements. We will apply technical analysis, take into account the opinions of leading experts, large banks, and financial institutions, and study AI-based forecasts. This comprehensive insight into EURUSD predictions should help investors and traders make informed decisions.
 Gold (XAUUSD) forecast 2026 and beyond: expert insights, price predictions, and analysis
Dive deep into the Gold (XAUUSD) price outlook for 2026 and beyond, combining technical analysis, expert forecasts, and key macroeconomic factors. It explains the drivers behind gold’s recent surge, explores potential scenarios including a move toward 4,500 to 5,000 USD per ounce, and highlights why the metal remains a strong hedge during global uncertainty.
Forecasts presented in this section only reflect the author’s private opinion and should not be considered as guidance for trading. RoboForex bears no responsibility for trading results based on trading recommendations described in these analytical reviews.