Weekly technical analysis and forecast (18–22 May 2026)
In this weekly technical analysis, we review key chart patterns and levels for EUSUSD, USDJPY, GBPUSD, AUDUSD, USDCAD, gold (XAUUSD), and Brent oil to forecast developments for the upcoming week (18–22 May 2026)
Major technical levels to watch this week
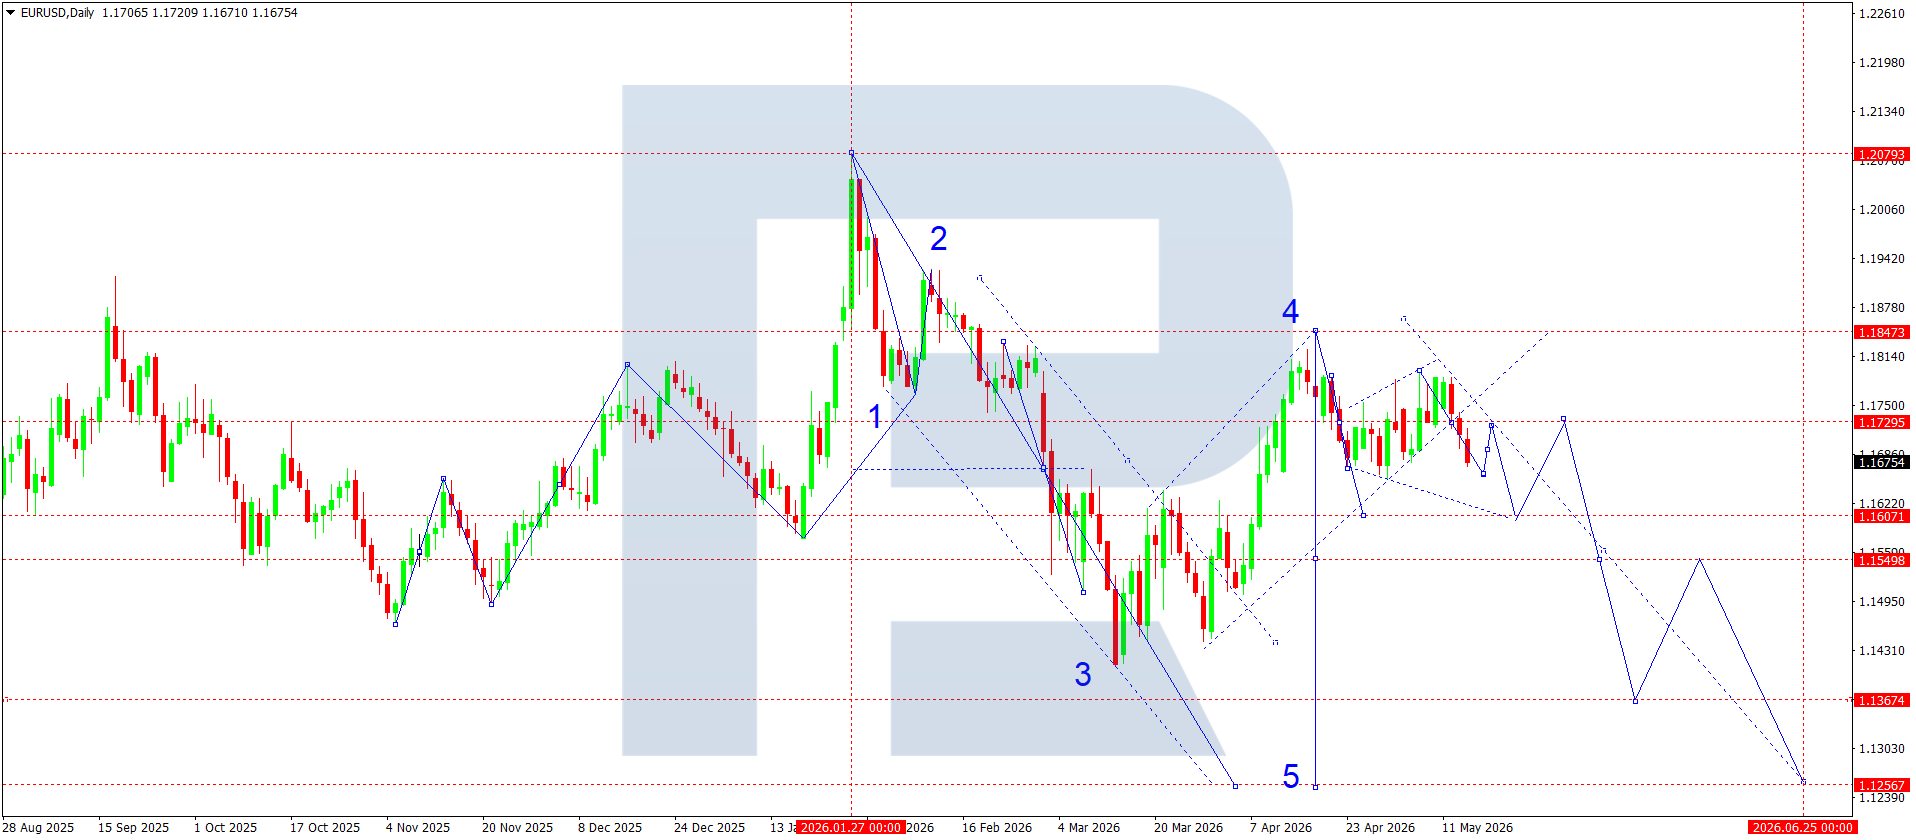
- EURUSD: Support: 1.1607, 1.1367. Resistance: 1.1750, 1.1847
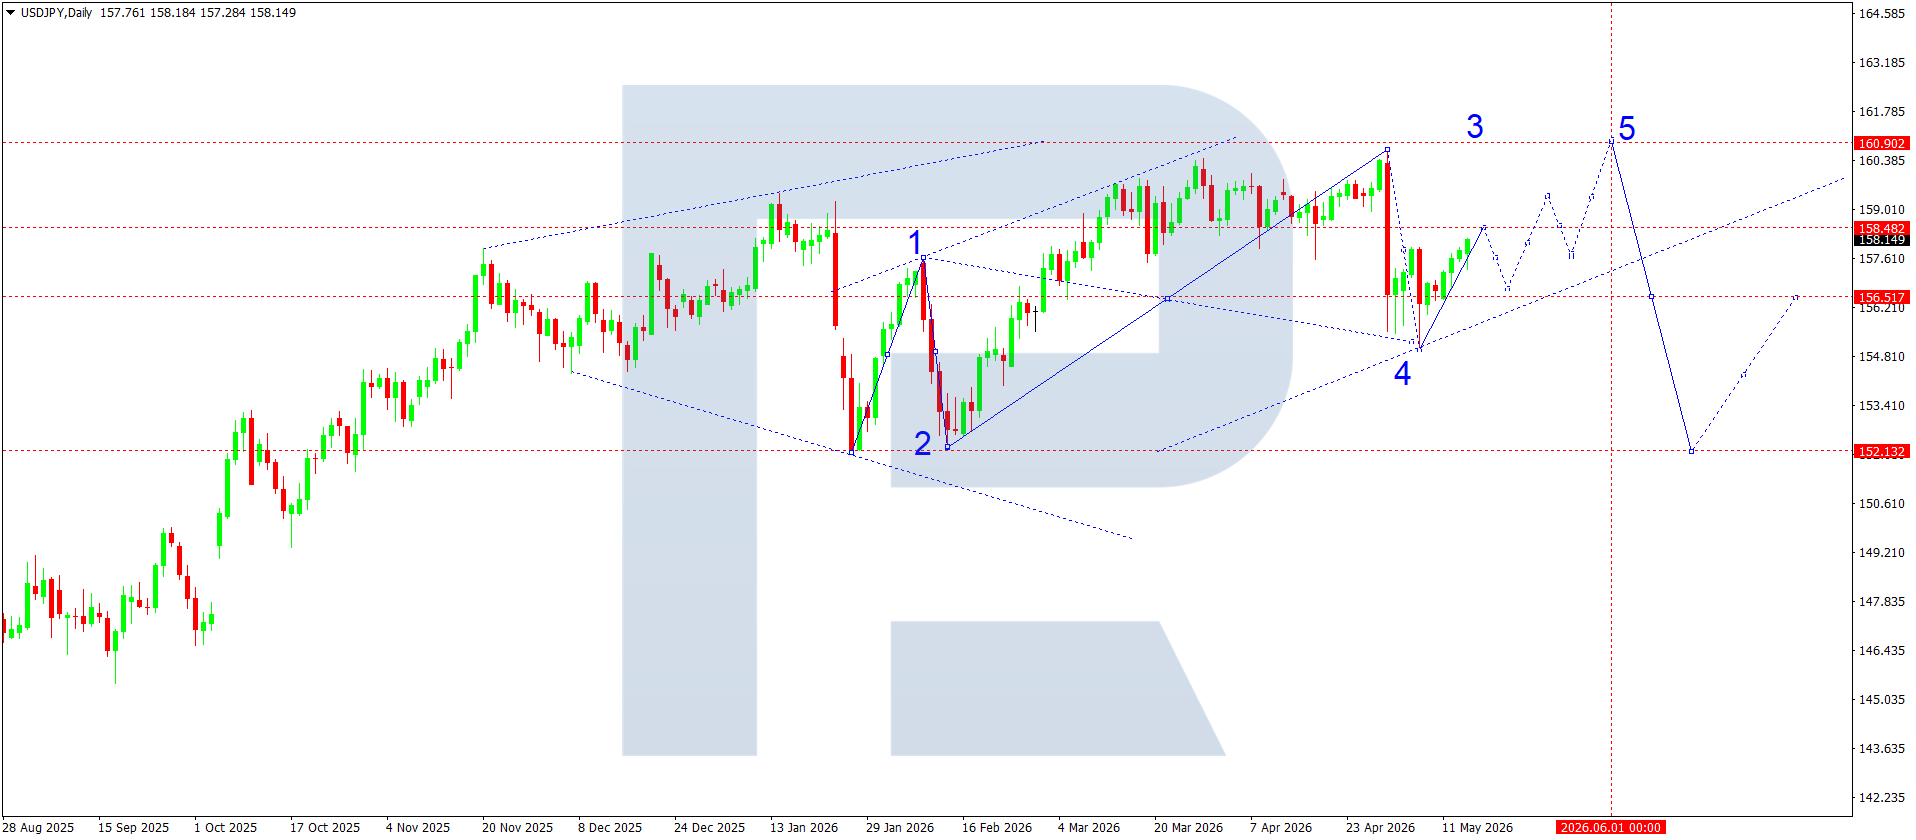
- USDJPY: Support: 156.50, 152.13. Resistance: 158.50, 160.90
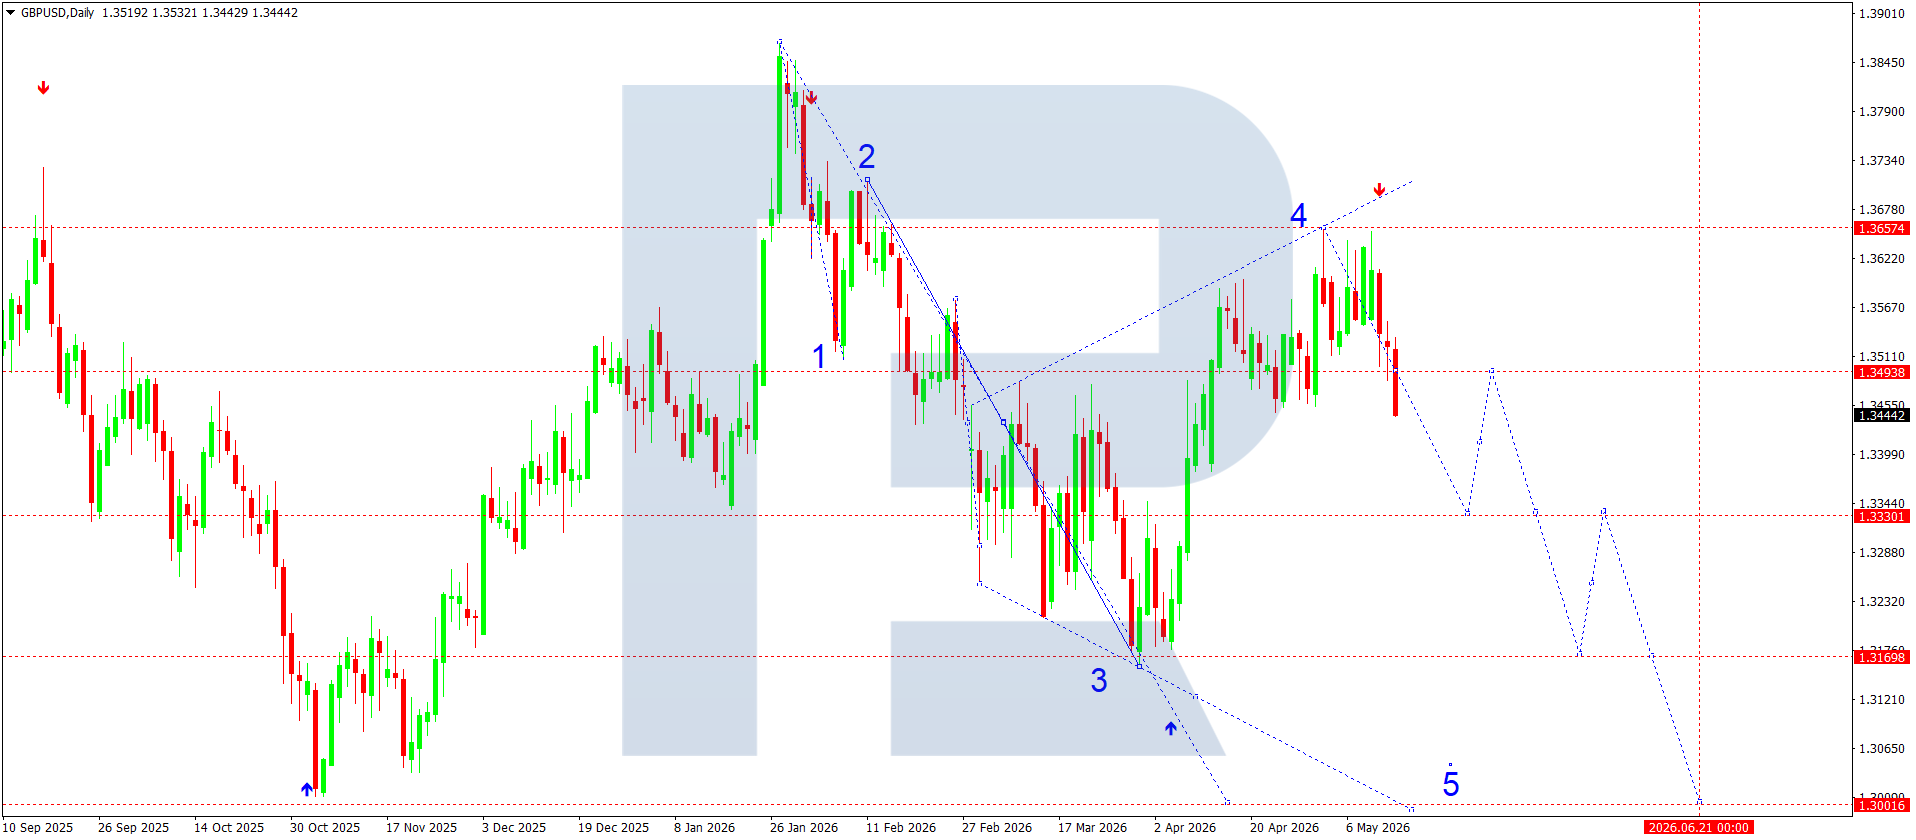
- GBPUSD: Support: 1.3330, 1.3169. Resistance: 1.3490, 1.3657
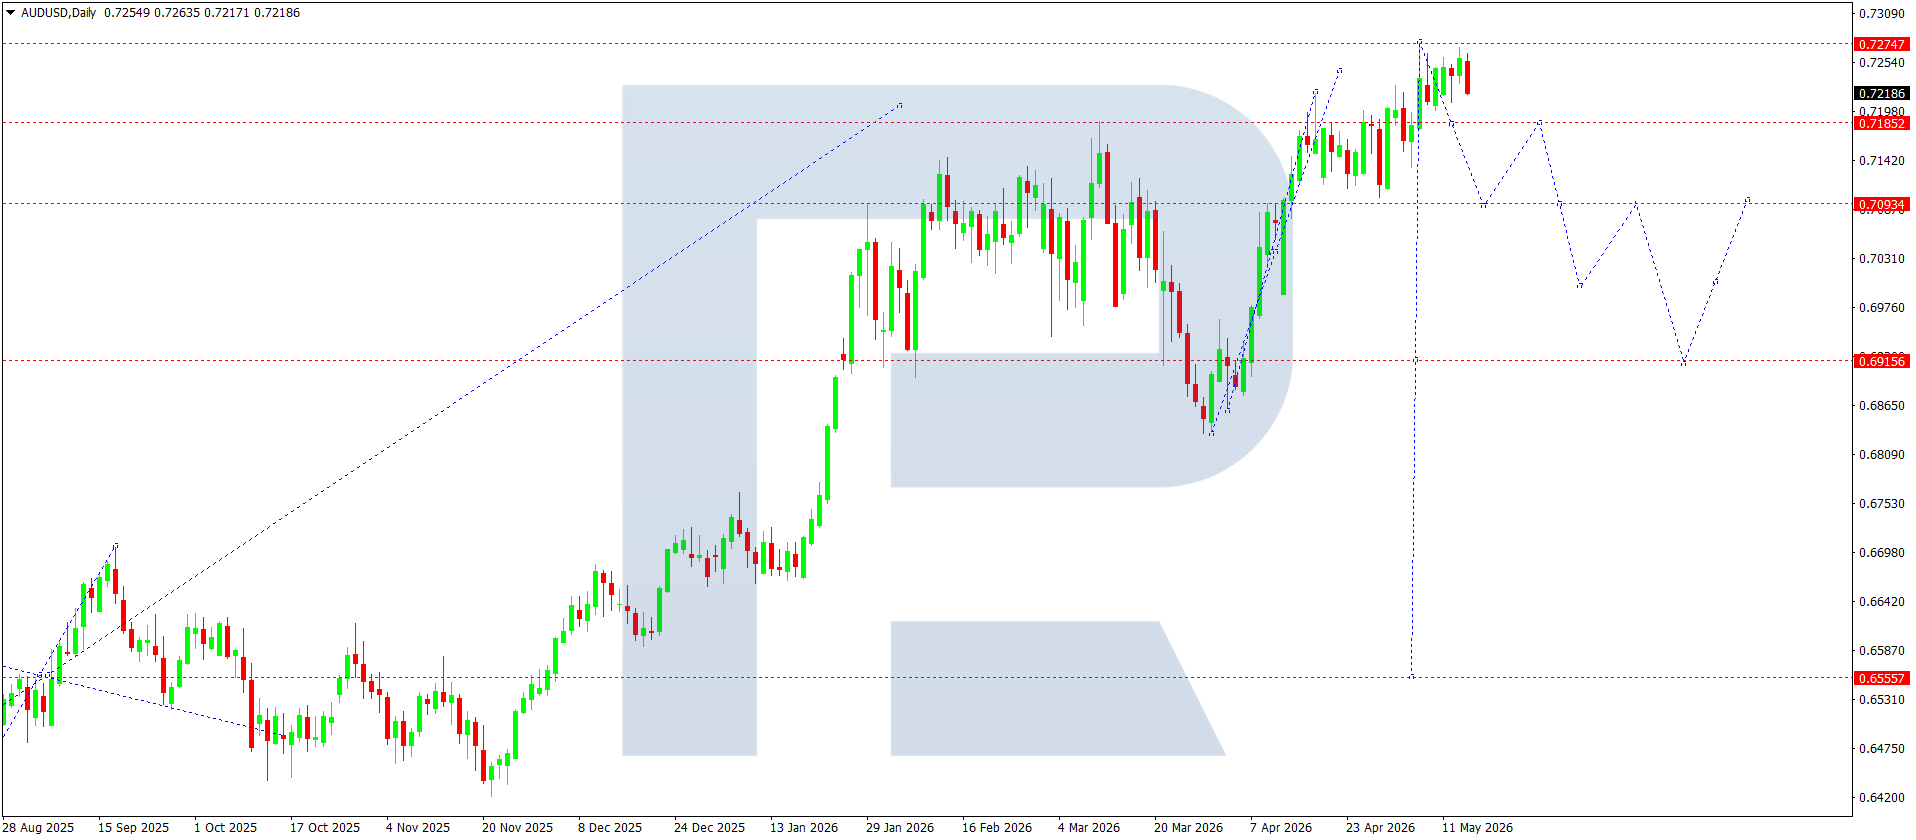
- AUDUSD: Support: 0.7185, 0.7093. Resistance: 0.7274, 0.7340
- USDCAD: Support: 1.3686, 1.3600. Resistance: 1.3782, 1.3960
- Gold: Support: 4,444, 4,208. Resistance: 4,665, 4,770
- Brent: Support: 101.00, 95.00. Resistance: 106.50, 118.10
EURUSD forecast
Over the coming week, EURUSD dynamics will continue to depend on interest rate expectations and inflation data in the US and the eurozone. Recent macroeconomic reports showed persistent inflationary pressure in the US economy, strengthening demand for the dollar. The market has again started pricing in the probability of a more hawkish stance from the US Federal Reserve, especially after strong CPI and PPI data. US bond yields continue to hold at elevated levels, limiting the euro’s upside potential.
At the same time, the European Central Bank maintains a cautiously hawkish stance. Discussions within the regulator about the need for further rate increases are intensifying amid persistent inflation in the eurozone. However, weak economic growth and high energy prices limit the scope for aggressive policy tightening. As a result, the market remains in a phase of confrontation between two factors: a resilient dollar and attempts by the euro to hold above key medium-term supports.
EURUSD technical analysis
From a technical perspective, EURUSD maintains a downward wave structure after forming a local high near 1.2079. A corrective phase is developing on the daily chart, with signs of a fifth downward wave forming. After the corrective structure was completed in the 1.1847 area, the market again faced active selling. The price is now holding within the 1.1670–1.1750 range, where the local balance zone is located.
The structure indicates that downside pressure remains. The main resistance remains the 1.1750–1.1847 area. While the price trades below this zone, the bearish scenario remains the priority. A series of lower highs is visible within the channel, confirming seller dominance. The inability of buyers to consolidate above 1.1729 acts as an additional negative signal.
If the downward momentum resumes, the market may test support at 1.1607. A break below this level will open the way to 1.1367, where the first major target of the fifth wave is located. The main medium-term downside target is near 1.1256. This level acts as the final target of the current Elliott downward structure.
The alternative scenario assumes the development of a deeper upward correction. For this, buyers need to consolidate above 1.1750. Only then can the market develop movement towards 1.1847, with a possible extension of the correction into the 1.1940 area.
EURUSD forecast scenarios
Bearish scenario (baseline): a decline to 1.1607, followed by movement towards 1.1367. The main target is 1.1256.
Bullish scenario (alternative): a break above 1.1750 will allow us to consider corrective growth towards 1.1847.
USDJPY forecast
USDJPY is ending the week near the key 158.00–158.50 zone, maintaining a high level of volatility amid rising inflation risks in the US and expectations of further policy tightening by the Bank of Japan. The main market driver remains the rise in US bond yields after strong US macroeconomic data. Recent inflation, import price, and retail sales reports confirmed the resilience of the US economy, reducing the probability of near-term policy easing by the Federal Reserve. Fed representatives continue to point to risks of accelerating inflation due to higher energy prices and geopolitical tension in the Middle East. The market has again started pricing in the probability that high rates in the US will remain in place for an extended period.
At the same time, pressure on the yen is partly limited by expectations that the Bank of Japan may raise rates as early as this summer. BOJ members are increasingly making hawkish comments amid accelerating domestic inflation and wage growth. Japanese government bond yields are reaching multi-year highs, although the interest rate differential between the US and Japan still favours the dollar. The probability of currency interventions by the Japanese authorities as the pair approaches the 160.00–161.00 area remains an additional uncertainty factor.
USDJPY technical analysis
From a technical perspective, USDJPY maintains a medium-term uptrend within a broad ascending channel. After forming a corrective wave near 152.13, the market resumed growth and tested resistance at 160.90. A new Elliott impulse structure is forming on the daily chart, where the current correction is viewed as an intermediate wave 4 before an attempt to form wave 5 upwards.
The key support is the 156.50–156.20 area, where the lower boundary of the local ascending channel and the previous breakout zone are located. While the price holds above this range, the market structure remains bullish. If buying resumes, the market may retest resistance at 158.50 and then move towards the strategic target at 160.90. Consolidation above 160.90 will open potential for growth towards 161.70 and higher.
The alternative scenario assumes the development of a deeper correction after a false breakout near the highs. If the market confidently breaks below 156.50, pressure on the pair may sharply increase. In this case, sellers will gain room for a decline to 154.40 and then to the key support at 152.13, where the lower boundary of the global channel is located.
USDJPY forecast scenarios
Bullish scenario: holding above 156.50 creates conditions for continued growth towards 160.90 and then to 161.70.
Bearish scenario: a break of 156.50 will increase pressure on the pair, with the risk of a decline to 154.40 and 152.13.
GBPUSD forecast
Sterling is ending the week under pressure after an unsuccessful attempt to consolidate above the 1.3600–1.3670 zone. The main market driver remains the divergence in monetary policy expectations between the Federal Reserve and the Bank of England. US statistics continue to show resilience in the US economy, while Fed representatives maintain a cautious tone on possible policy easing. This supports the dollar and limits the growth potential of risk-sensitive currencies. At the same time, the UK continues to face elevated inflation pressure, particularly amid rising energy prices and geopolitical tension in the Middle East. The market is gradually reducing expectations of an imminent BoE rate cut, which partially supports sterling.
Additional pressure on GBPUSD comes from rising demand for safe-haven assets and stronger investor interest in the dollar amid instability in global markets. Investors continue to closely assess inflation dynamics in the US and the UK, as well as the outlook for further central bank actions. Over the coming week, special attention will focus on comments from Fed and Bank of England representatives, as well as business activity data and inflation expectations.
GBPUSD technical analysis
From a technical perspective, GBPUSD maintains a medium-term downward structure on the daily chart. After completing wave 4 near 1.3657, the market resumed its decline. The price failed to consolidate above the upper boundary of the descending channel, confirming seller dominance. The current structure points to the formation of impulse wave 5 with a potential move into the 1.3169 area and then to the strategic target at 1.3000.
The 1.3490–1.3510 zone acts as the nearest resistance, where a local reversal point previously formed. As long as the price remains below this area, pressure on the pair will persist. The formation of a series of lower highs after the April rise acts as an additional signal in favour of a decline. The descending resistance line from the February high continues to limit recovery attempts.
The nearest target for sellers is 1.3330. A break of this level will open the way to 1.3169, where the next strong support zone and the local target under the wave structure are located. If the dollar momentum strengthens, the market may test the 1.3000 area, which is viewed as the main target of the current downward wave.
The bullish scenario will become relevant only if the market confidently returns above 1.3510 and consolidates above 1.3657. In this case, the market may retest the upper boundary of the channel and the 1.3730 area. At this stage, however, this scenario remains alternative.
GBPUSD forecast scenarios
Bearish scenario (main): a decline from 1.3490 towards 1.3330 and then to 1.3169.
Bullish scenario (alternative): if the 1.3510 level is broken and the price consolidates above 1.3657, growth towards 1.3730 is possible.
AUDUSD forecast
The Australian dollar is ending the week near local highs, maintaining a steady upward momentum against the US dollar. The main driver remains the divergence in monetary policy expectations between the Reserve Bank of Australia and the Federal Reserve. Recent comments from RBA representatives confirmed the regulator’s hawkish stance on inflation, which remains above target. The market continues to price in high rates in Australia for longer than expected, supporting demand for AUD.
Additional support for the Australian currency comes from recovering risk appetite in global markets and stabilisation in the Chinese economy, which is closely linked to Australian commodity exports. At the same time, the US dollar is gradually losing part of its safe-haven demand despite ongoing geopolitical tension in the Middle East. Investors are also closely watching US inflation and labour market data, as any signs of a slowdown in the US economy may increase pressure on the USD.
AUDUSD technical analysis
From a technical perspective, AUDUSD maintains an upward structure on the daily chart. After an impulsive rise from the 0.6915 area, the market formed a stable ascending channel and tested resistance at 0.7274. However, buyers have not yet managed to consolidate above this level, indicating a local correction phase after a strong upward move. The current structure shows distribution forming in the 0.7185–0.7274 range, where the market is assessing prospects for further trend continuation.
The 0.7185 level remains the nearest key support. As long as the price holds above this zone, the medium-term upward momentum remains intact. A break and consolidation below 0.7185 may lead to the development of a corrective wave towards 0.7093, where the next important demand level and local Pivot Point are located. If pressure from the US dollar intensifies, the market may test the 0.6915 area, which acts as the main support of the entire current upward structure.
If demand for risk remains in place and Chinese data are positive, the pair may resume growth. Consolidation above 0.7274 will open potential for movement to 0.7340 and higher, where new medium-term targets for buyers will be located. The Elliott wave structure indicates the completion of the impulsive phase and the market’s transition into corrective consolidation before the next directional move.
AUDUSD forecast scenarios
Bearish scenario (baseline): a decline from 0.7274 may lead to a correction towards 0.7093 and then to 0.6915.
Bullish scenario (alternative): if the market consolidates above 0.7274, continued growth into the 0.7340–0.7380 area is likely.
USDCAD forecast
Over the coming week, USDCAD dynamics will be shaped by several fundamental factors at once: expectations for the Federal Reserve’s interest rate, the cautious stance of the Bank of Canada, and oil market fluctuations amid persistent geopolitical tension in the Middle East. Recent US inflation data came in above expectations, increasing the probability that the Fed will maintain hawkish rhetoric for longer. US bond yields continue to rise, supporting demand for the US dollar. At the same time, the market reacted negatively to weak Canadian employment data, where the unemployment rate rose to 6.9000%, while the economy lost some jobs in the industrial sector. Uncertainty around trade negotiations between the US and Canada, as well as risks related to new tariffs, remains an additional pressure factor for the Canadian dollar. However, rising oil prices partly limit CAD weakness, as Canada remains one of the largest commodity exporters. The Bank of Canada continues to maintain a wait-and-see stance, although regulator representatives allow for policy tightening if inflation continues to rise because of high energy prices. Therefore, the fundamental backdrop remains mixed, but in the short term, the advantage remains with the US dollar.
USDCAD technical analysis
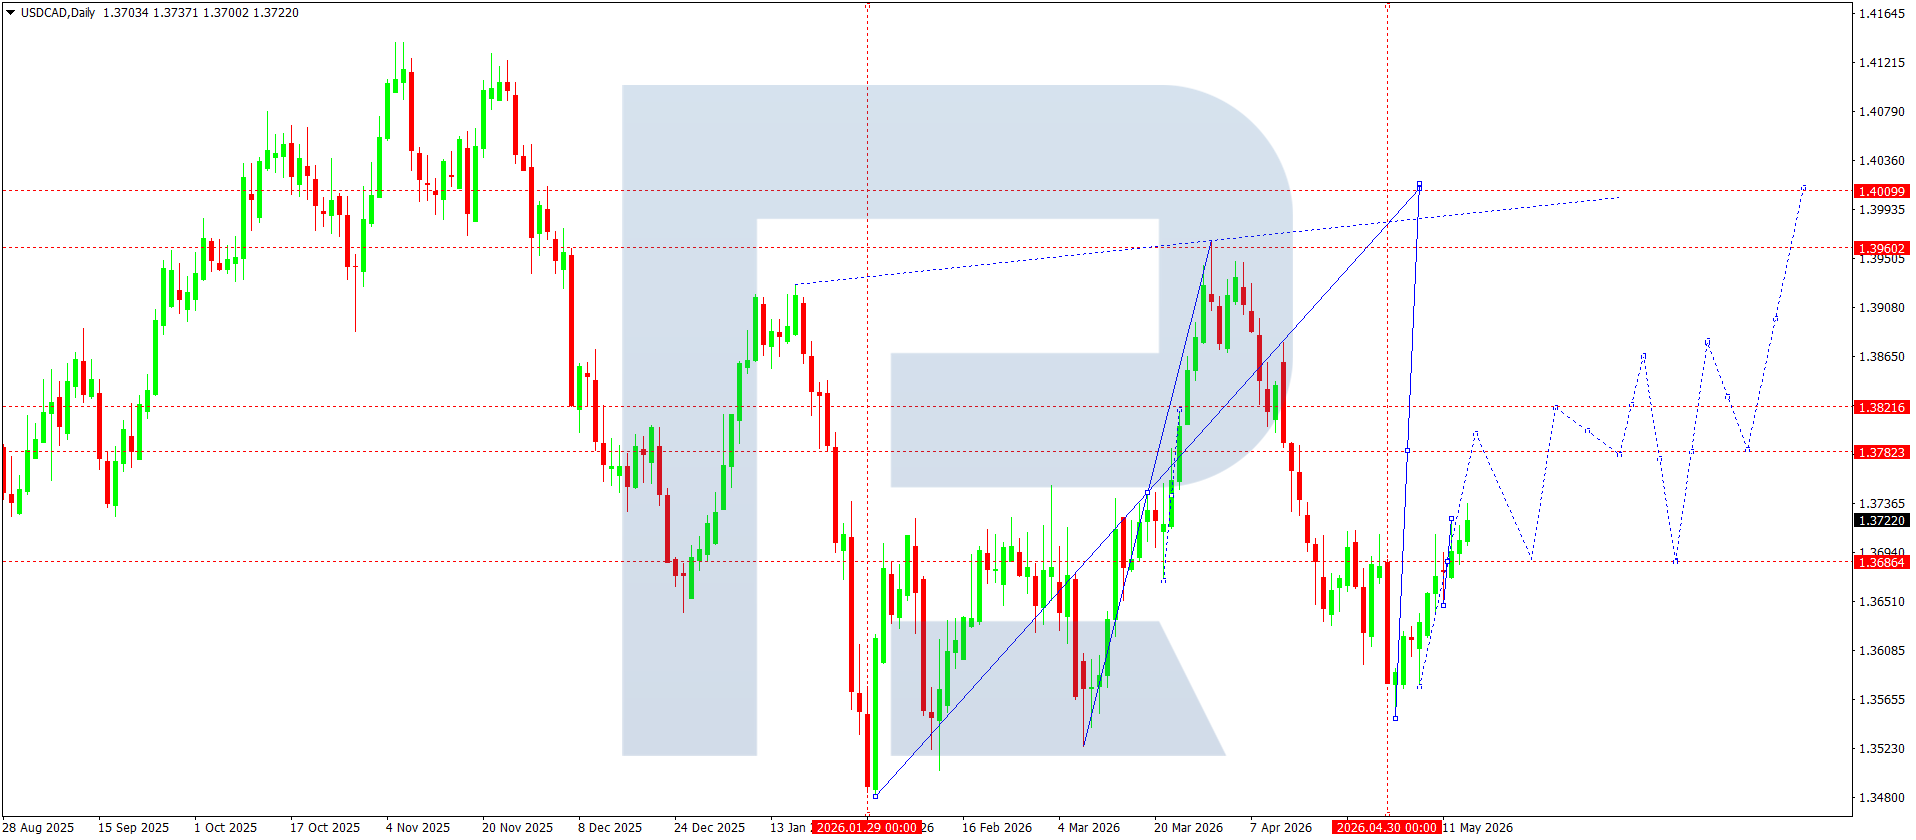
From a technical perspective, USDCAD continues to form a medium-term upward structure after the reversal from the 1.3535 area. On the daily chart, the price has held above the key support at 1.3686, from which a recovery is developing towards the upper boundary of the ascending channel. The main growth impulse was previously halted near 1.3960, after which the market entered a corrective decline. However, the current structure points to the probability of forming a new upward wave.
Locally, the price has consolidated above the 1.3686 area, which now acts as an important support zone for buyers. If demand persists, the pair may continue moving towards intermediate resistance at 1.3782. A break of this level will open the way to 1.3821 and then to the strategic target at 1.3960. In a broader perspective, the technical model allows for a retest of the 1.4010 area, which coincides with the upper boundary of the long-term channel.
The alternative scenario assumes renewed pressure on the pair if it falls below 1.3686. In that case, the probability of another decline to 1.3600 and then to 1.3535 will increase. However, while the structure of higher lows remains intact, the medium-term priority remains with buyers.
USDCAD forecast scenarios
Bullish (baseline): growth within the uptrend towards 1.3960, with a possible extension to 1.4010.
Bearish (alternative): if the market breaks 1.3686 on rising volumes, we can consider the probability of continued decline towards 1.3600 and 1.3535.
XAUUSD forecast
The gold market is ending the week amid elevated volatility. The main drivers of XAUUSD remain expectations regarding future Federal Reserve monetary policy, rising inflation pressure in the US, and persistent geopolitical tension in the Middle East. Recent US inflation data again came in above market expectations, increasing the probability that interest rates will remain high for longer. Against this backdrop, US bond yields continue to rise, putting pressure on gold as a non-yielding asset.
Expectations of more hawkish Fed rhetoric after strong macroeconomic data have added further pressure to the market. However, demand for gold persists thanks to steady interest from central banks and rising demand for safe-haven assets amid geopolitical risks and trade tensions between the world’s largest economies. Analysts also note continued long-term structural demand for gold from Asian regulators.
XAUUSD technical analysis
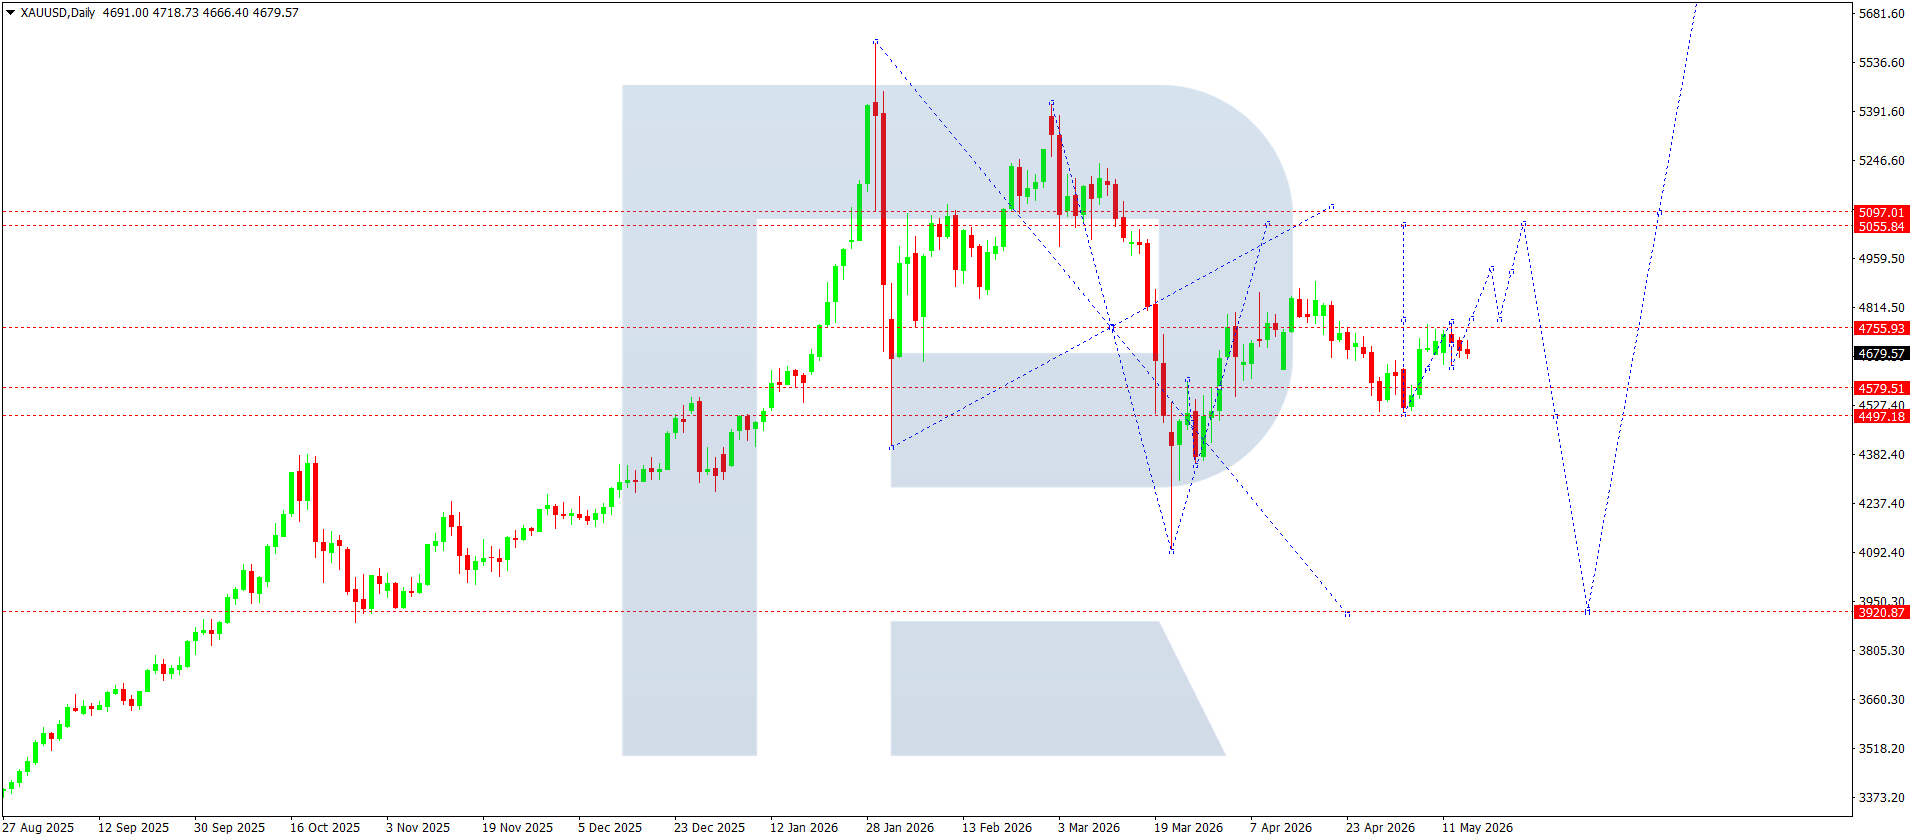
From a technical perspective, XAUUSD continues to form a corrective phase on the daily chart after reaching all-time highs near 5,500. Prices remain within a local downward structure, with the 4,665–4,770 area acting as key resistance. This is where an important seller zone and the local downward momentum line are located. As long as the market trades below this area, pressure on gold remains.
The nearest support level is located at 4,444, which repeatedly held sellers in April and May. Consolidation below this level will open the way to a decline towards 4,208, where the next medium-term support zone and potential target of the current downward wave are located. If the downward momentum strengthens, the market may test the strategic level at 3,920, which acts as the main target of the bearish scenario.
At the same time, the chart retains the probability of forming a reversal structure. If buyers manage to return prices above 4,665 and consolidate above 4,770, the market will receive a signal that the correction is ending and the uptrend is resuming. In this case, the next upside targets will be the 5,055 and 5,097 areas, with the prospect of retesting all-time highs.
XAUUSD forecast scenarios
Bearish (baseline): continued decline towards 4,444 and then to 4,208.
Bullish (alternative): if the 4,770 level is broken and prices consolidate above it, growth may recover towards 5,055 and 5,097.
Brent forecast
The oil market is ending the week amid persistently high volatility. The main driver for Brent remains geopolitical tensions around the Middle East and the situation in the Strait of Hormuz, through which a significant share of global oil supplies passes. Market participants continue to assess risks of supply disruptions, which supports prices above the psychological level of 100.00. Reports of lower global inventories and limited export infrastructure capacity in the region provide additional support for oil.
At the same time, deteriorating forecasts for global demand are putting pressure on the market. The Organisation of the Petroleum Exporting Countries (OPEC) lowered its forecast for oil demand growth in 2026, citing slower economic activity in OECD countries and rising inflation pressure. Despite this, the market is largely ignoring weak demand, as the key factor remains the risk of a supply deficit. Investors are also closely monitoring Fed policy, as high inflation amid expensive oil may force the Fed to keep monetary policy tight for longer.
Brent technical analysis
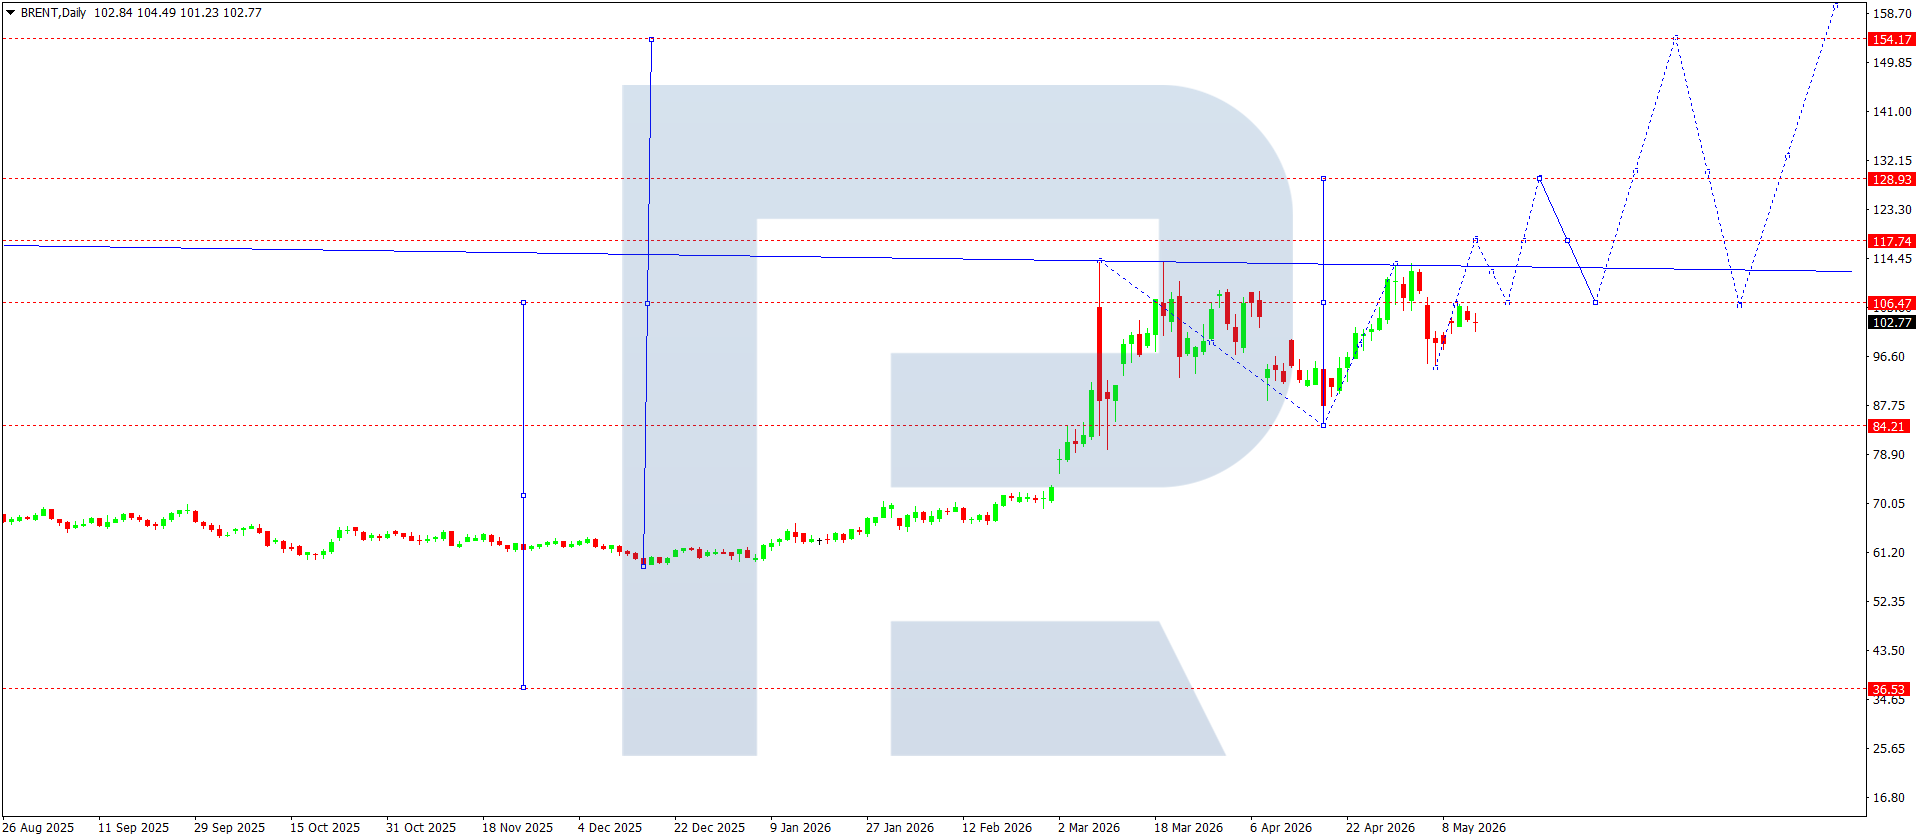
From a technical perspective, Brent maintains its upward momentum on the daily chart. After a sharp rise from the 84.20 area, prices formed consolidation in the 101.00–106.50 range. The current structure indicates a corrective phase before a possible continuation of the uptrend. The key resistance level is located at 106.50. Consolidation above this level would open the way to the main target at 118.10, where the next large seller zone is located. If strong momentum persists, the market may test the strategic target at 128.90.
The Elliott wave structure indicates the completion of a local correction after the growth impulse from 84.20. The chart also retains an ascending channel, within which prices hold above the trend midline. As long as Brent remains above the 95.00–96.00 area, the medium-term trend remains upward. A decline to this zone may be treated as a technical correction within the main bullish scenario.
An additional supportive factor is the decline in global oil inventories and strong demand for petroleum products in Asia. At the same time, the market remains extremely sensitive to any news on Iran, OPEC+ supplies, and US-China negotiations.
Brent forecast scenarios
Bullish scenario (main): if Brent consolidates above 106.50, the market may continue to rise towards 118.10, with the prospect of movement into the 128.90 area.
Bearish scenario (alternative): if prices break below 95.00 support, a decline towards 84.20 is possible.
Editors’ picks
 EURUSD 2026-2027 forecast: key market trends and future predictions
This article provides the EURUSD forecast for 2026 and 2027 and highlights the main factors determining the direction of the pair’s movements. We will apply technical analysis, take into account the opinions of leading experts, large banks, and financial institutions, and study AI-based forecasts. This comprehensive insight into EURUSD predictions should help investors and traders make informed decisions.
 Gold (XAUUSD) forecast 2026 and beyond: expert insights, price predictions, and analysis
Dive deep into the Gold (XAUUSD) price outlook for 2026 and beyond, combining technical analysis, expert forecasts, and key macroeconomic factors. It explains the drivers behind gold’s recent surge, explores potential scenarios including a move toward 4,500 to 5,000 USD per ounce, and highlights why the metal remains a strong hedge during global uncertainty.
Forecasts presented in this section only reflect the author’s private opinion and should not be considered as guidance for trading. RoboForex bears no responsibility for trading results based on trading recommendations described in these analytical reviews.