
Weekly technical analysis and forecast (25–29 May 2026)
In this weekly technical analysis, we review key chart patterns and levels for EUSUSD, USDJPY, GBPUSD, AUDUSD, USDCAD, gold (XAUUSD), and Brent oil to forecast developments for the upcoming week (25–29 May 2026)
Major technical levels to watch this week
- EURUSD: Support: 1.1442, 1.1384. Resistance: 1.1658, 1.1739
- USDJPY: Support: 156.69, 152.13. Resistance: 159.24, 160.87
- GBPUSD: Support: 1.3331, 1.3296. Resistance: 1.3476, 1.3640
- AUDUSD: Support: 0.7101, 0.7035. Resistance: 0.7155, 0.7179
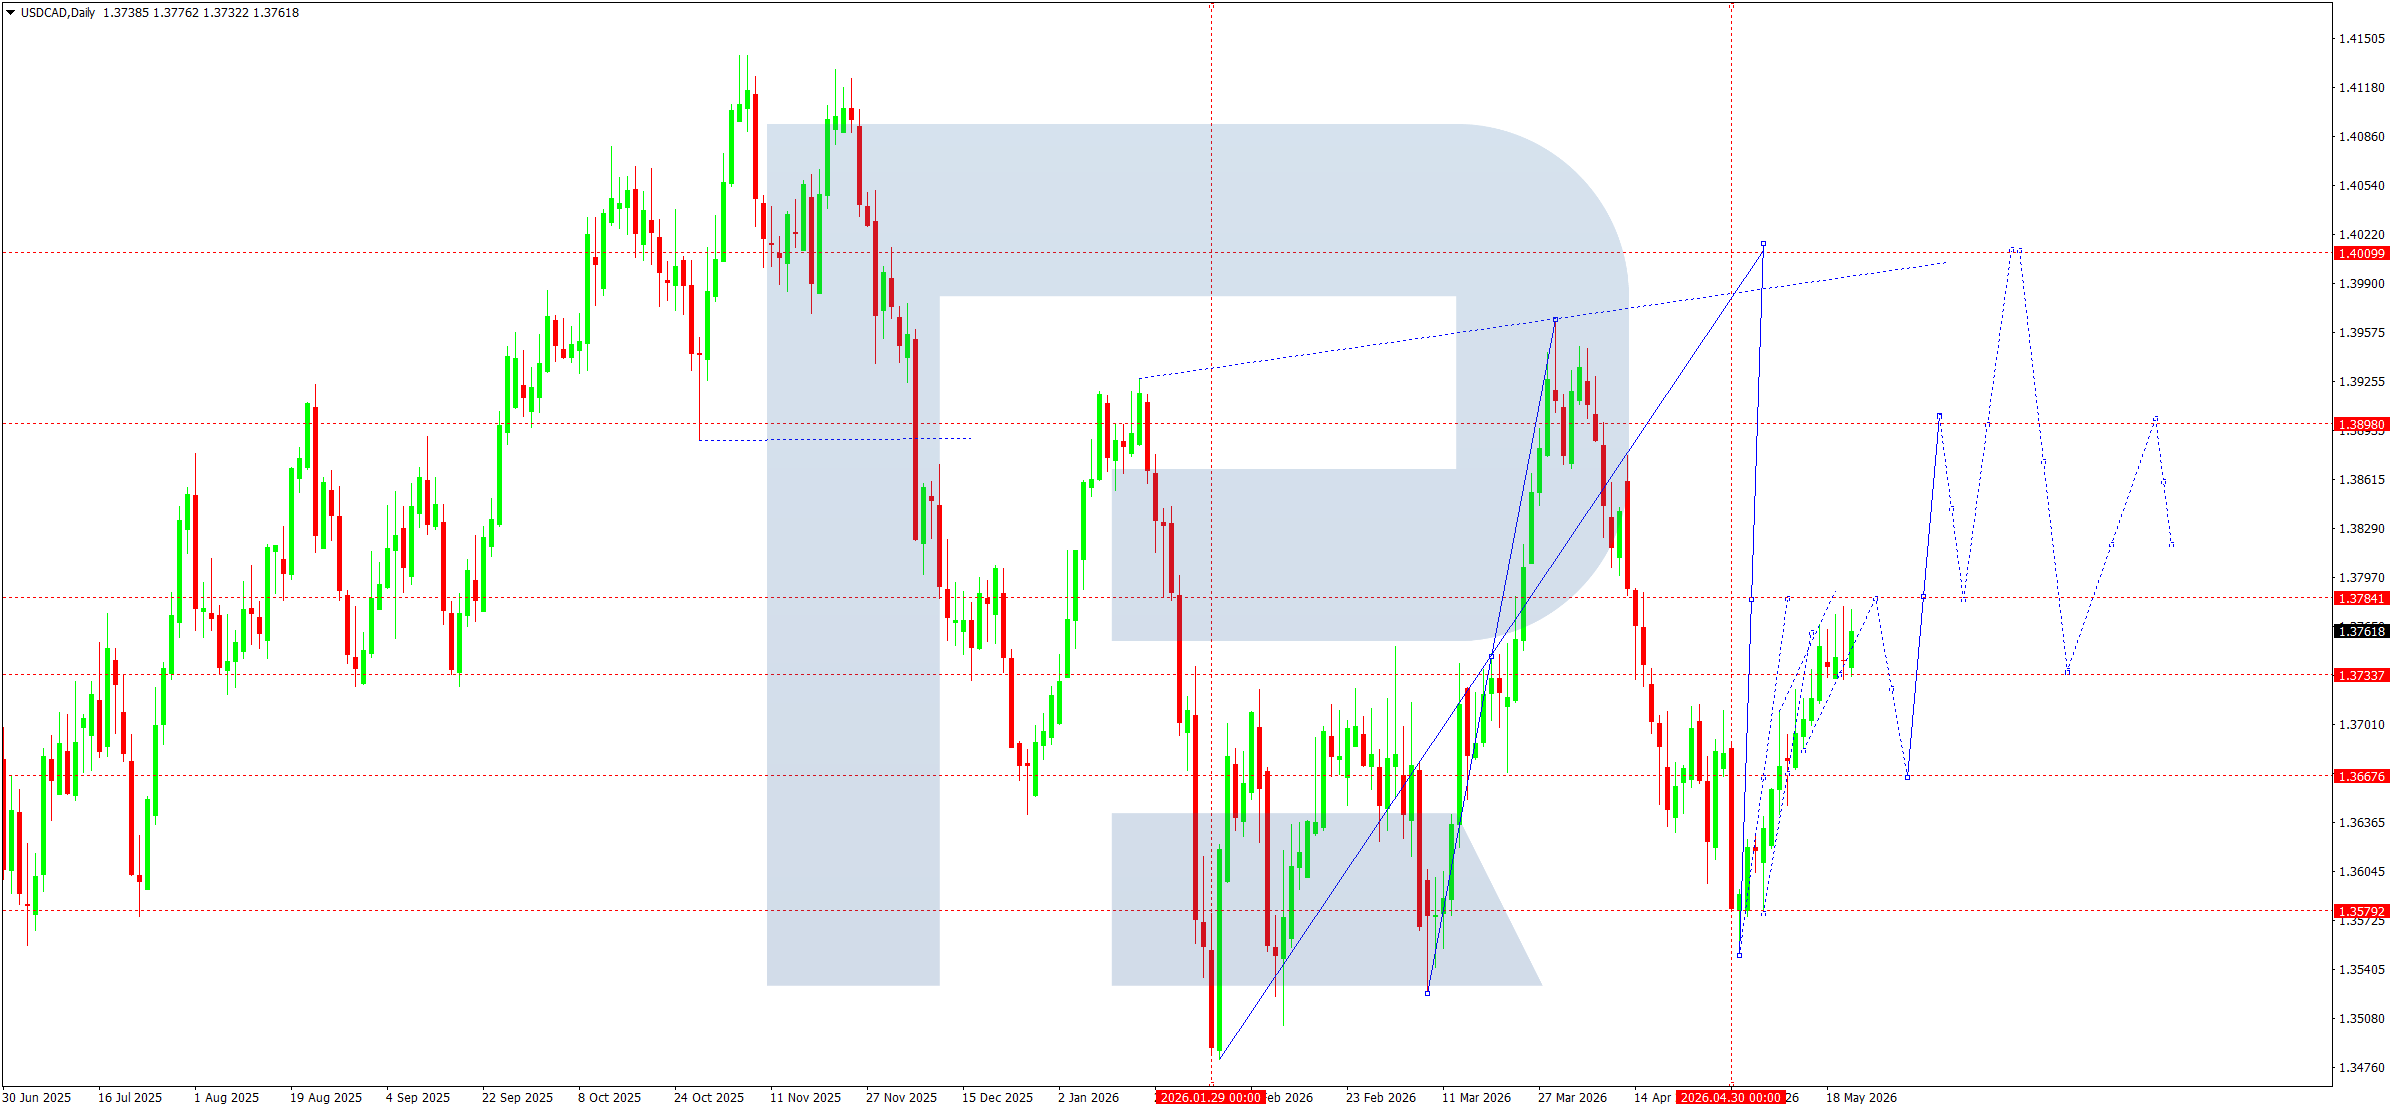
- USDCAD: Support: 1.3785, 1.3707. Resistance: 1.3860, 1.4000
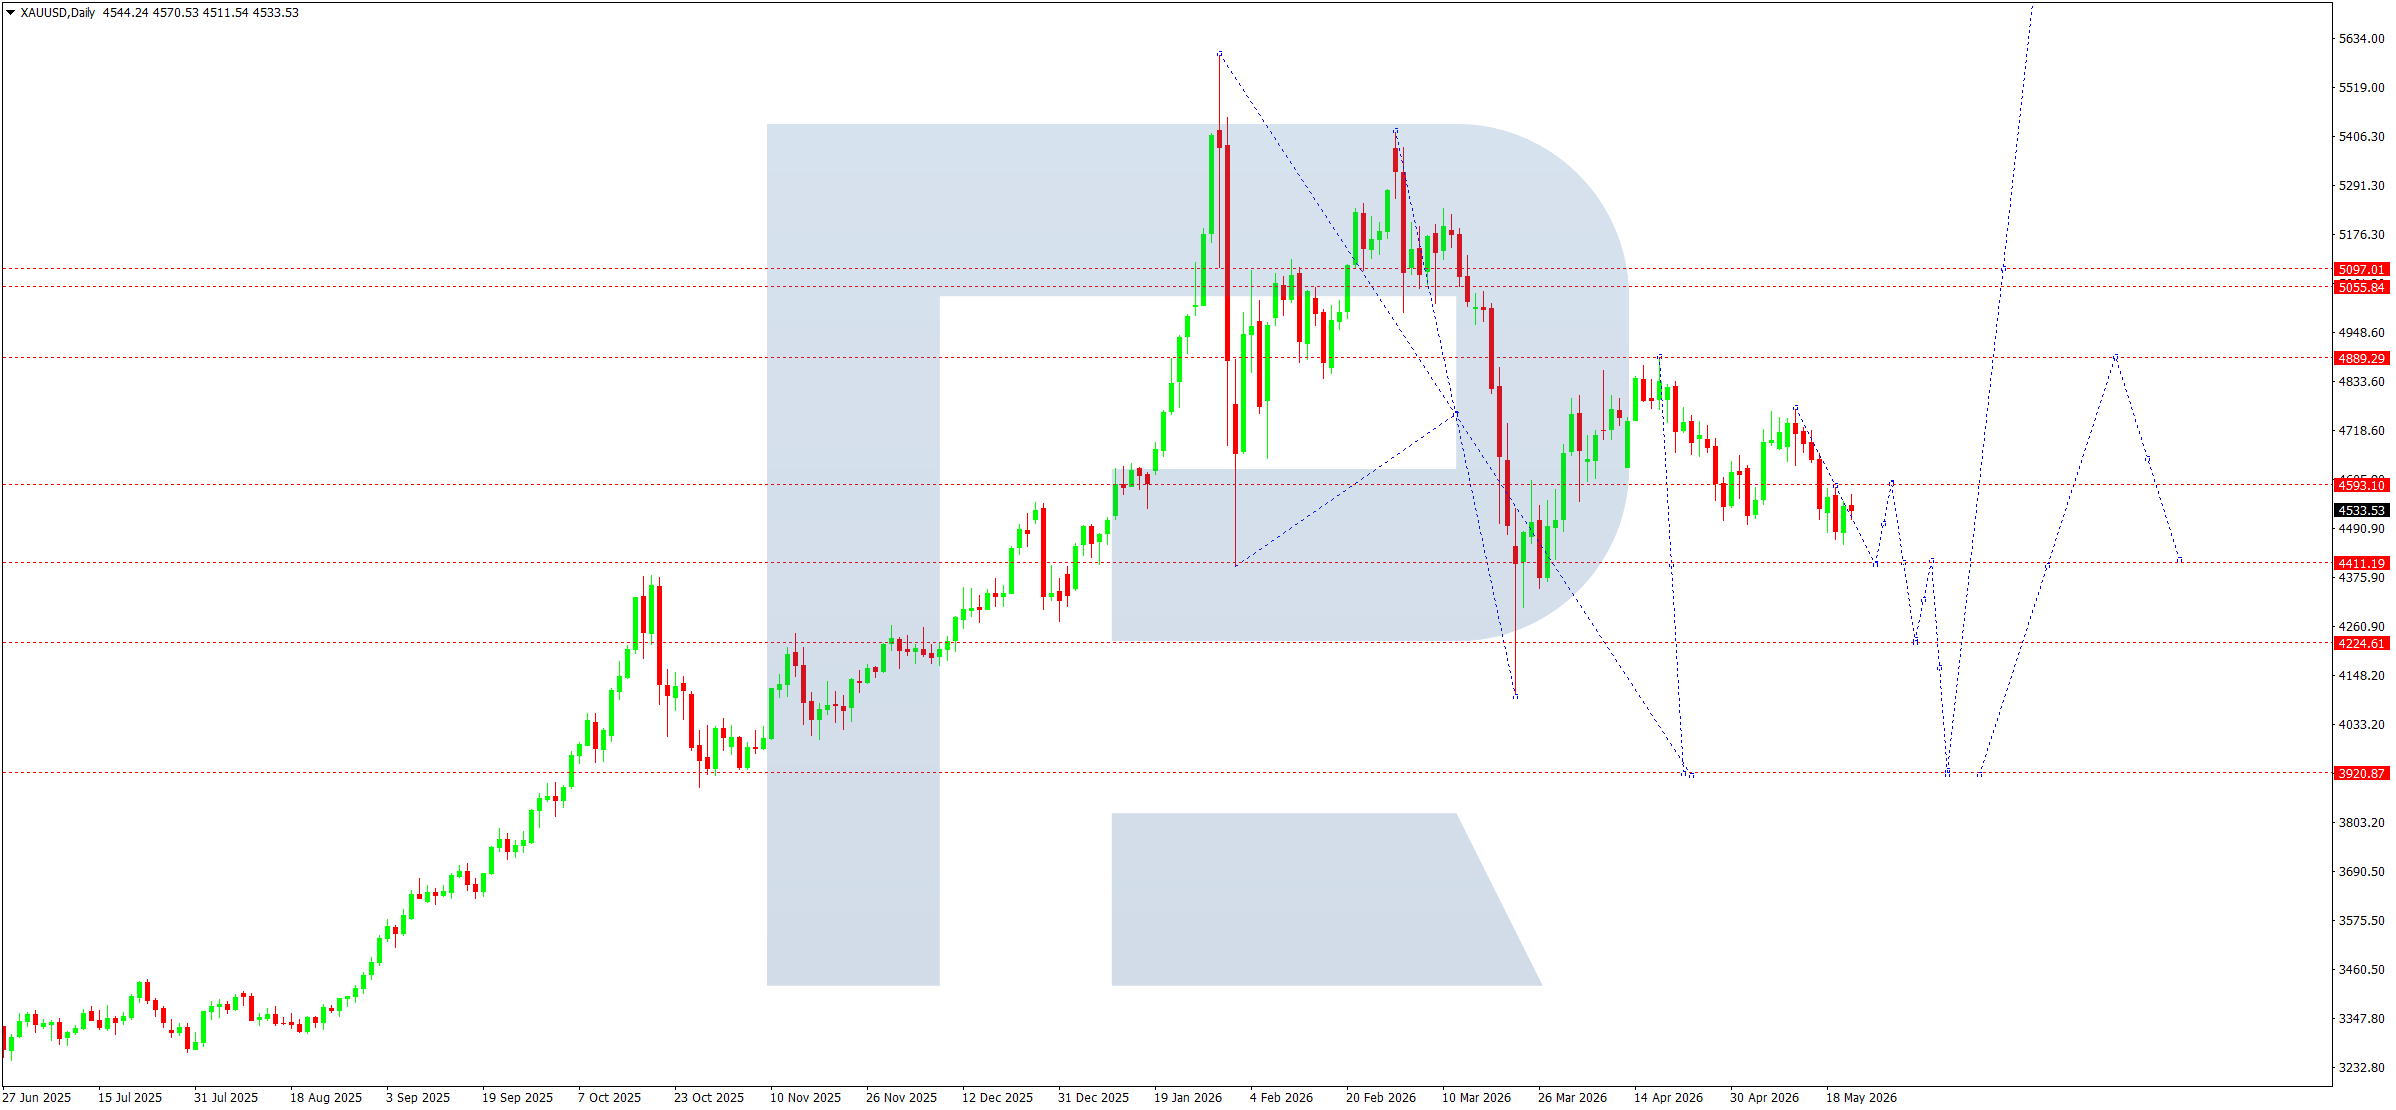
- Gold: Support: 4,411, 4,224. Resistance: 4,590, 4,890
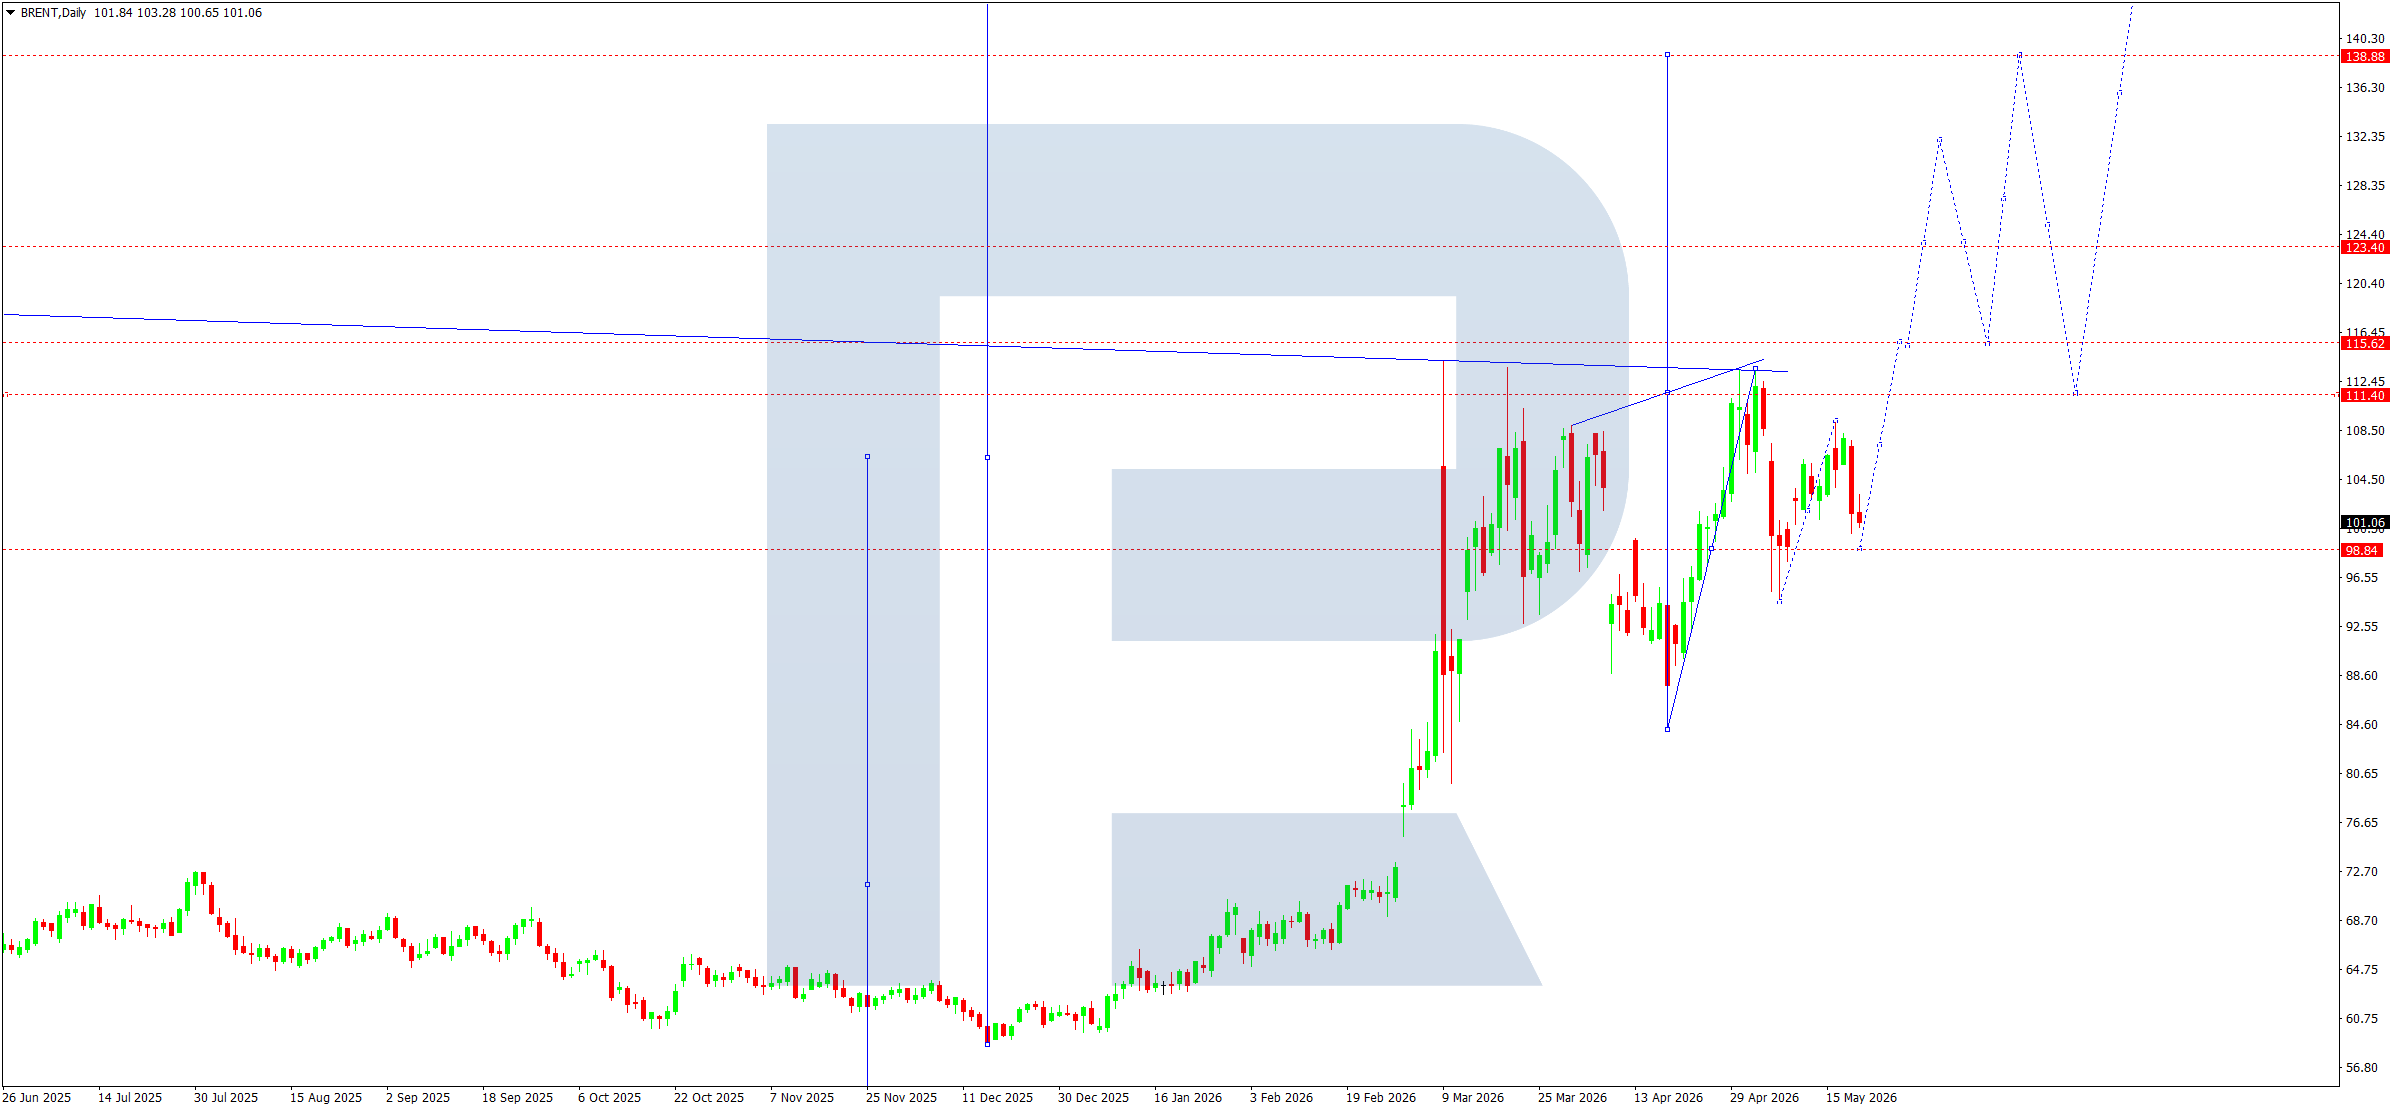
- Brent: Support: 101.00, 98.84. Resistance: 111.40, 115.62
EURUSD forecast
At the end of last week, the EURUSD pair remained under pressure from a mixed fundamental backdrop. The market focused mainly on expectations regarding the next steps from the US Federal Reserve and the European Central Bank. Rising energy prices and geopolitical tensions continue to increase inflation risks for the eurozone, while also weakening the economic growth outlook. The market is gradually pricing in the probability of more hawkish ECB rhetoric ahead of the June meeting, although weak business activity data and slowing economic growth limit the euro’s potential. In the US, the dollar remains resilient due to expectations of a longer period of high interest rates and stable demand for safe-haven assets.
EURUSD technical analysis
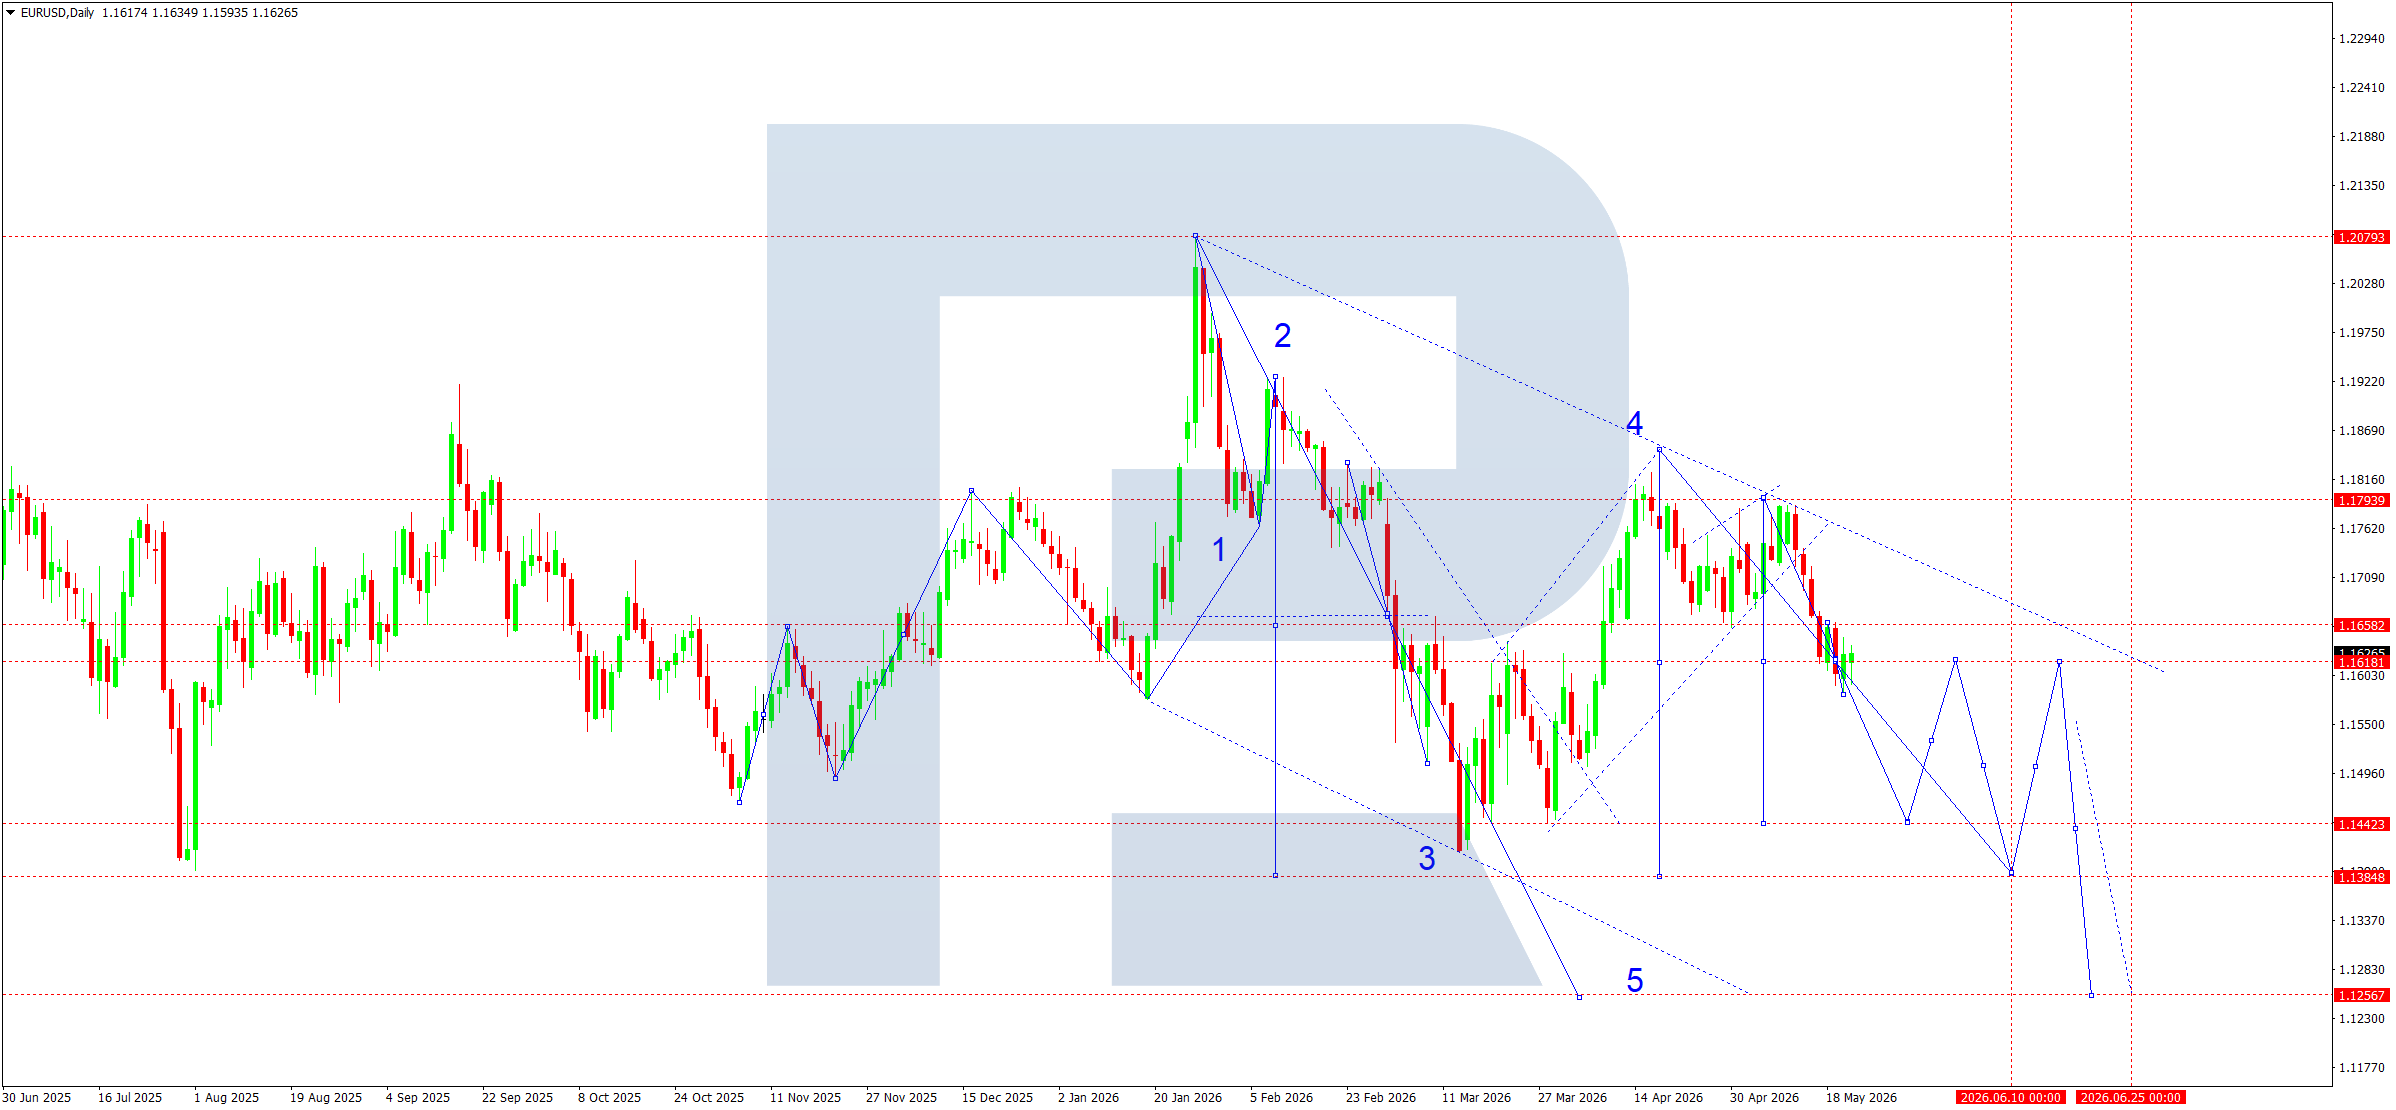
From a technical perspective, the EURUSD pair continues to form a downward structure after completing the upward impulse near 1.2079. On the daily chart, movement remains within a descending channel. According to the wave structure, the market completed the corrective phase in the 1.1816 area and resumed downward movement. The nearest selling pressure zone runs around 1.1658–1.1739, where local reversal points previously formed.
The current structure suggests a third downward wave, with an intermediate target at 1.1442. If the downward momentum strengthens, the market could test the 1.1384 level, where the next important support is located. The main medium-term target under the model shifts to the 1.1257 area, corresponding to the lower boundary of the expanding descending channel.
Recovery attempts still look corrective. To change the current structure, buyers need to gain a foothold above 1.1658 and break above the 1.1739 level. Only in this case, a deeper correction towards 1.1810–1.1860 can be possible. For now, the trend remains predominantly bearish, and a series of lower highs confirms seller dominance.
EURUSD forecast scenarios
Bearish scenario (baseline): continuation of the downtrend towards 1.1442. The local target is the development of the third downward wave. The main target is 1.1257.
Bullish scenario (alternative): if the market consolidates above 1.1658 on rising momentum, a correction towards 1.1739 and then 1.1810 is possible.
USDJPY forecast
The overall fundamental backdrop for USDJPY remains moderately bullish for the dollar. Expectations regarding the monetary policy of the Federal Reserve and the Bank of Japan remain the main market drivers. Recent statements from Fed officials confirm a cautious approach to rate cuts, while rising inflation risks through the energy sector keep US bond yields elevated.
On the Japanese side, the market continues to factor in the likelihood of further BoJ policy tightening. Some Japanese regulator representatives allow for a rate hike at upcoming meetings, as inflation pressure remains persistent and rising energy prices could push inflation further above the target level. However, the still-wide yield differential between the US and Japan continues to support demand for the dollar against the yen. An additional risk factor remains the potential for increased verbal intervention by the Japanese authorities as the pair approaches the 160.00-161.00 zone.
USDJPY technical analysis
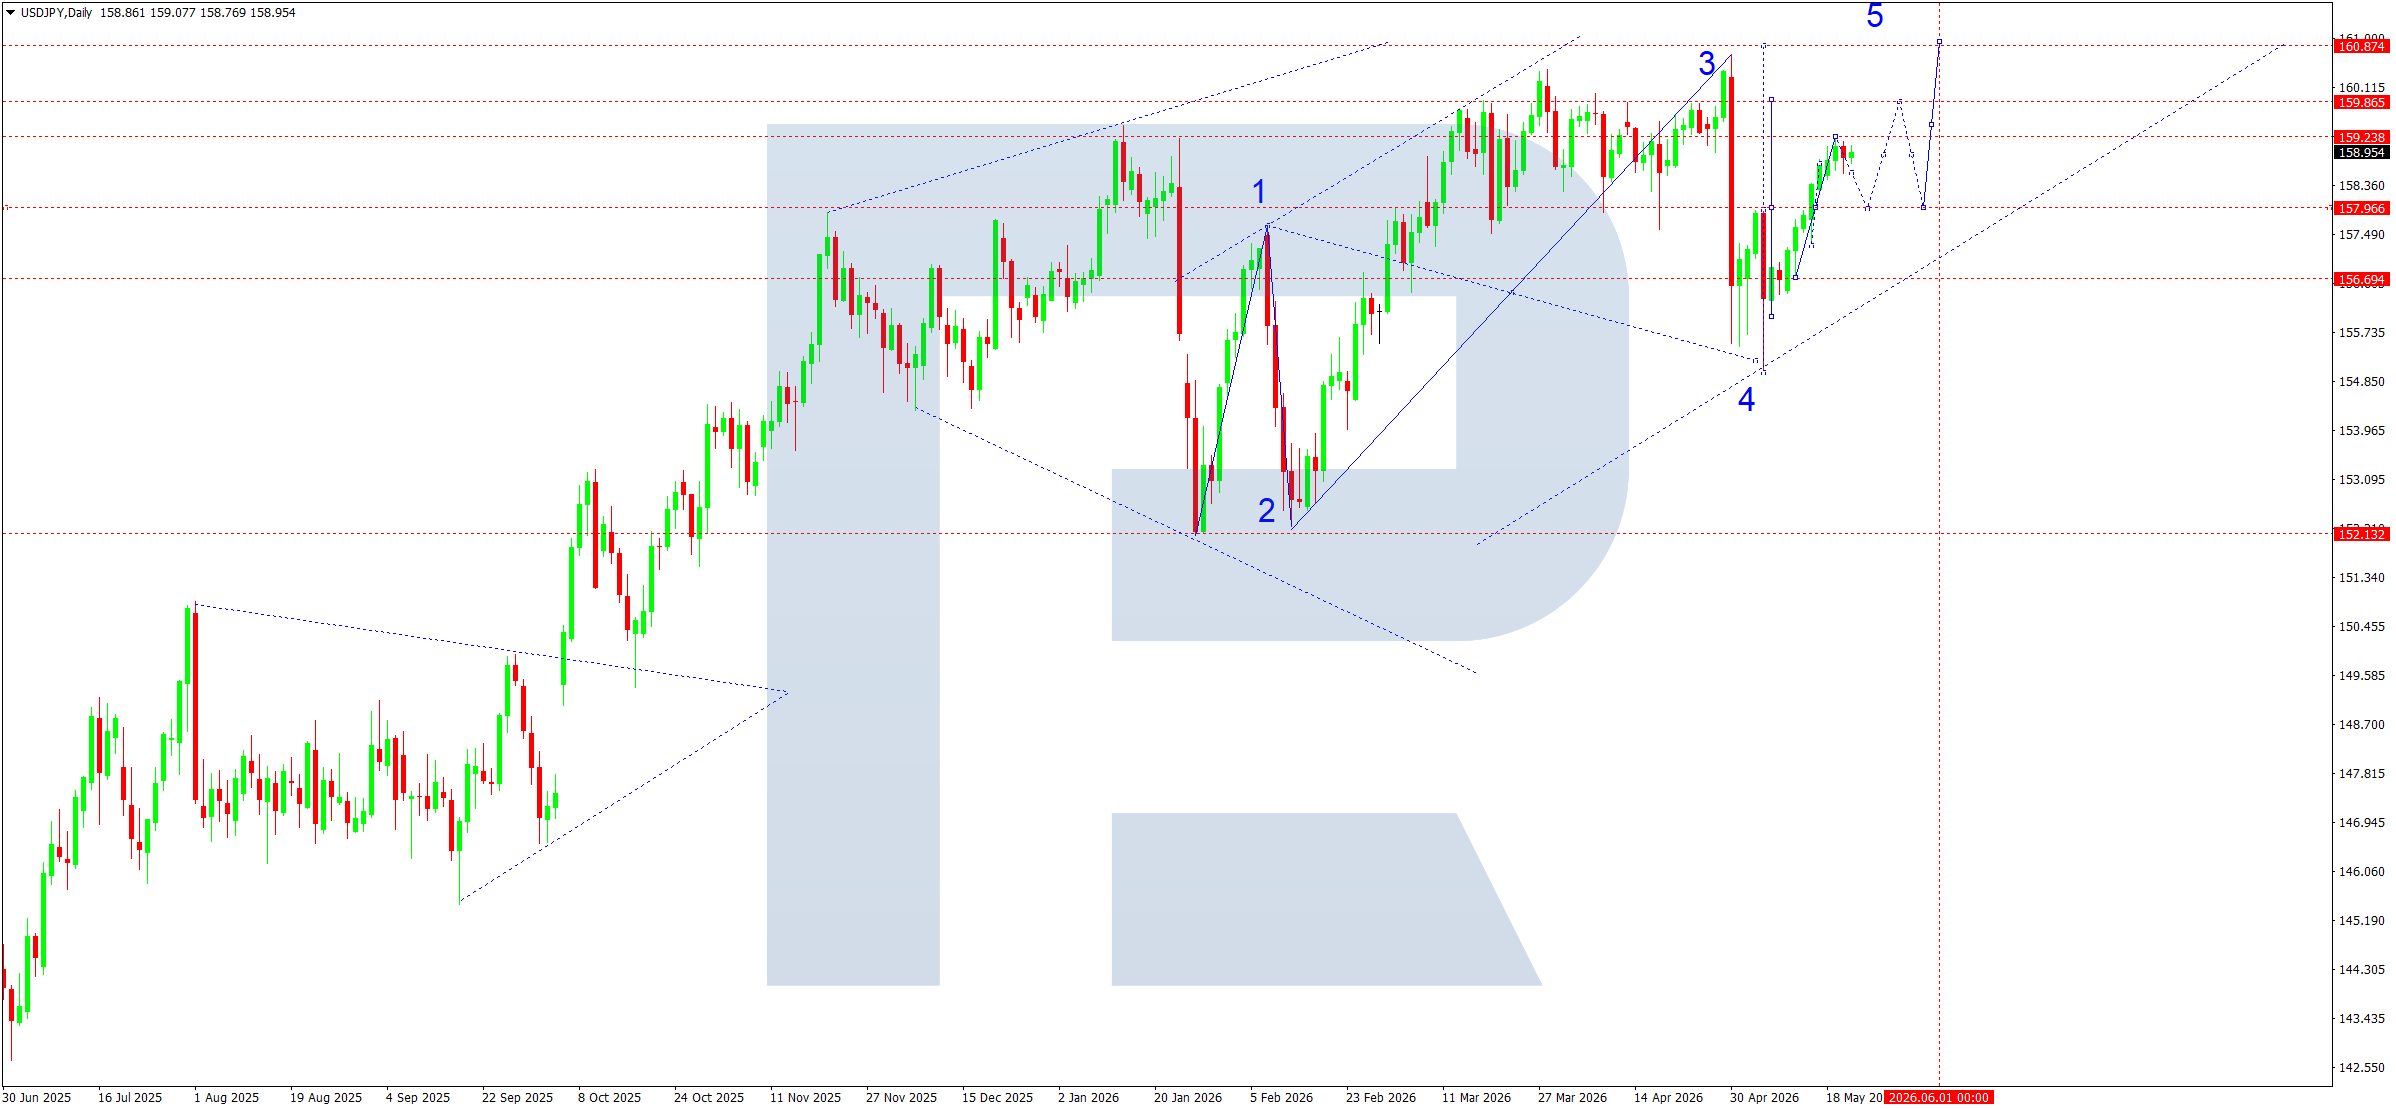
On the daily chart, the USDJPY pair maintains an upward structure within an ascending channel. After forming corrective wave 4, the market is again trying to develop an upward impulse towards wave 5. The nearest technical task for buyers is consolidation above the 159.24–159.86 area. A successful breakout of this zone will confirm the continuation of the main upward movement.
The current wave configuration suggests a potential final upward impulse with a target around 160.87, the upper boundary of the local range and one of the key targets of the larger structure. At the same time, the market remains sensitive to local corrections: within wave 5, a pullback towards the 156.69 support level is possible before another growth attempt.
The 156.69 level acts as an important pivot point for the current cycle. While the price holds above it, the medium-term priority remains with buyers. A loss of this support will strengthen the corrective scenario and open the way for movement towards 152.13, where the next strong demand zone and the lower support of the medium-term structure are located.
USDJPY forecast scenarios
Bullish scenario: a breakout above 159.24 will open potential for continued growth to 159.86 and then to the main target at 160.87.
Bearish scenario: if the market consolidates below 156.69, the likelihood of a correction towards 152.13 will increase.
GBPUSD forecast
The pound sterling closed last week under pressure from a mixed fundamental backdrop. Expectations regarding Fed and Bank of England rates remain key for the market. Recent UK data showed slowing inflation, but weak business activity and worsening manufacturing indicators are increasing concerns about the pace of economic growth. At the same time, the BoE maintains cautious rhetoric as it assesses the impact of the energy factor and geopolitical tensions on the inflation outlook. In the US, Treasury yields remain high, while the market is gradually reducing expectations of rapid Fed policy easing, which continues to support the dollar.
GBPUSD technical analysis
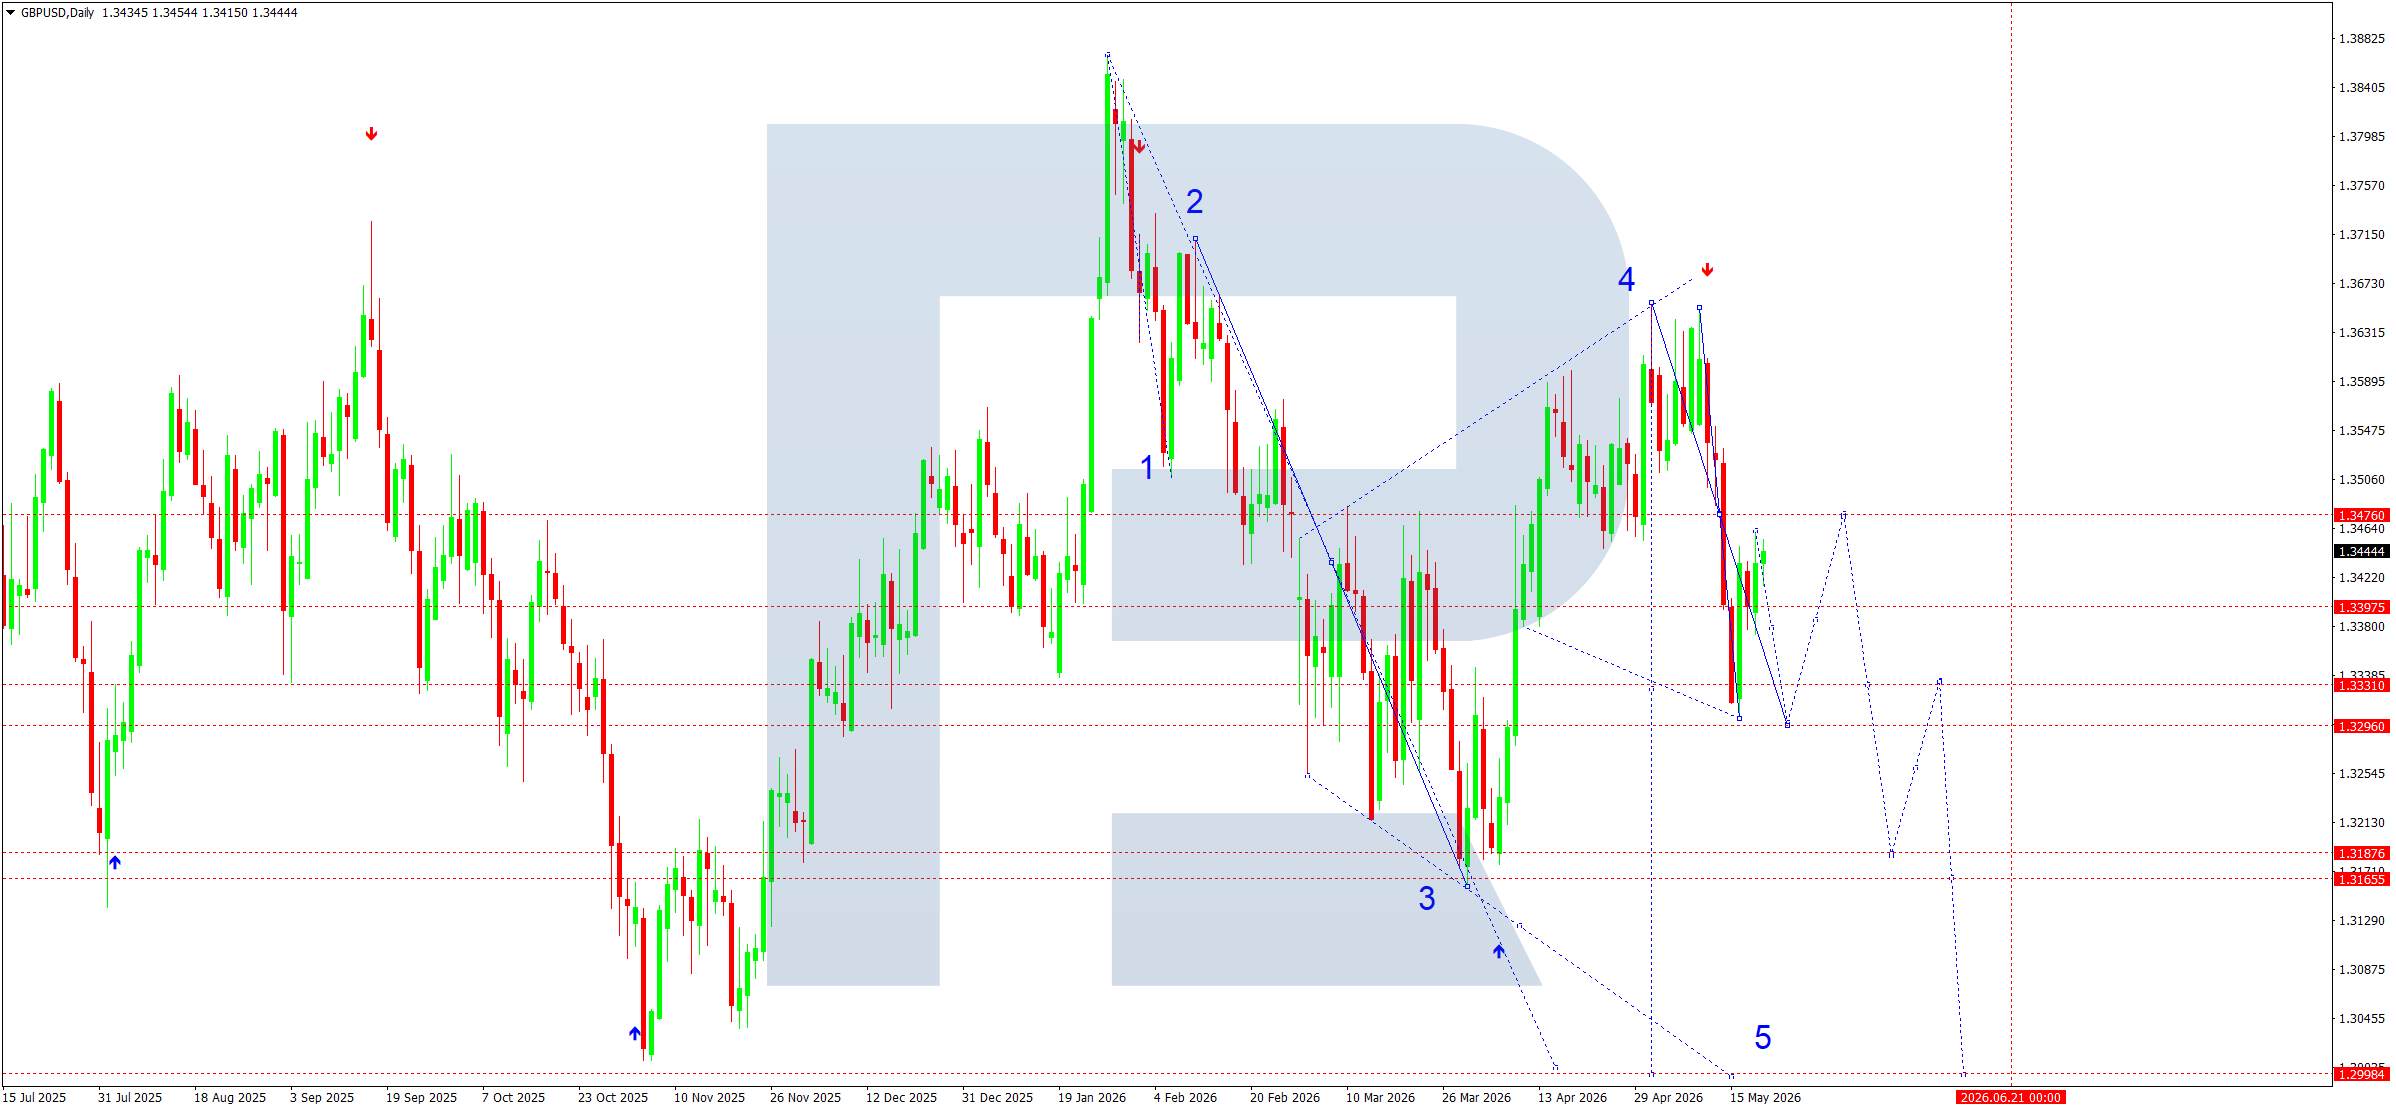
From a technical perspective, the daily GBPUSD chart maintains a downward correction structure. After forming a peak around wave 4, the market came back under selling pressure. The chart shows the completion of a local corrective rally and an attempt to develop downward momentum towards wave 5.
The key pressure zone is the 1.3476–1.3397 area. While the price holds below this range, the bearish scenario remains the priority. The nearest support levels are located near 1.3331 and 1.3296. A break below these marks could strengthen the downward movement towards 1.3187, followed by a test of the main medium-term target at 1.2998.
The structure indicates that the move from the February highs is developing within a descending channel. The recent rebound was corrective and has not yet changed the overall trend structure. Holding below the peak of wave 4 supports the scenario of continued decline. Consolidation below 1.3296 will act as an additional signal in favour of sellers, possibly extending the downward momentum.
At the same time, an alternative scenario cannot be excluded. If the pound receives support from more hawkish BoE expectations or a weaker dollar, the market may retest the 1.3476 resistance level. A confident move above this level will call the current downward structure into question and increase the probability of a return to 1.3550–1.3640.
GBPUSD forecast scenarios
Bearish scenario (main): a decline from 1.3450 along the downtrend towards 1.3296 and then 1.3187.
Bullish scenario (alternative): if the market breaks above the 1.3476 level with volume confirmation, continued growth towards 1.3550 and 1.3640 is possible.
AUDUSD forecast
The Australian dollar ended last week under pressure after failing to consolidate above local highs. The main drivers for AUDUSD remain the divergence in monetary expectations, commodity market performance, the situation in China, and overall demand for safe-haven assets. The Reserve Bank of Australia maintains hawkish rhetoric after raising the rate to 4.3500, citing persistent inflation risks, especially amid rising energy prices. At the same time, the regulator allows for a cautious approach at upcoming meetings as it assesses the impact of economic slowdown and external risks.
For the US dollar, expectations regarding the next steps from the Fed remain important. Rising inflation risks due to high oil prices support US bond yields and limit demand for risk-sensitive currencies, including the AUD. The Chinese economy remains another uncertainty factor: any signs of slowing industrial demand or worsening external trade could quickly weaken the Australian currency.
AUDUSD technical analysis
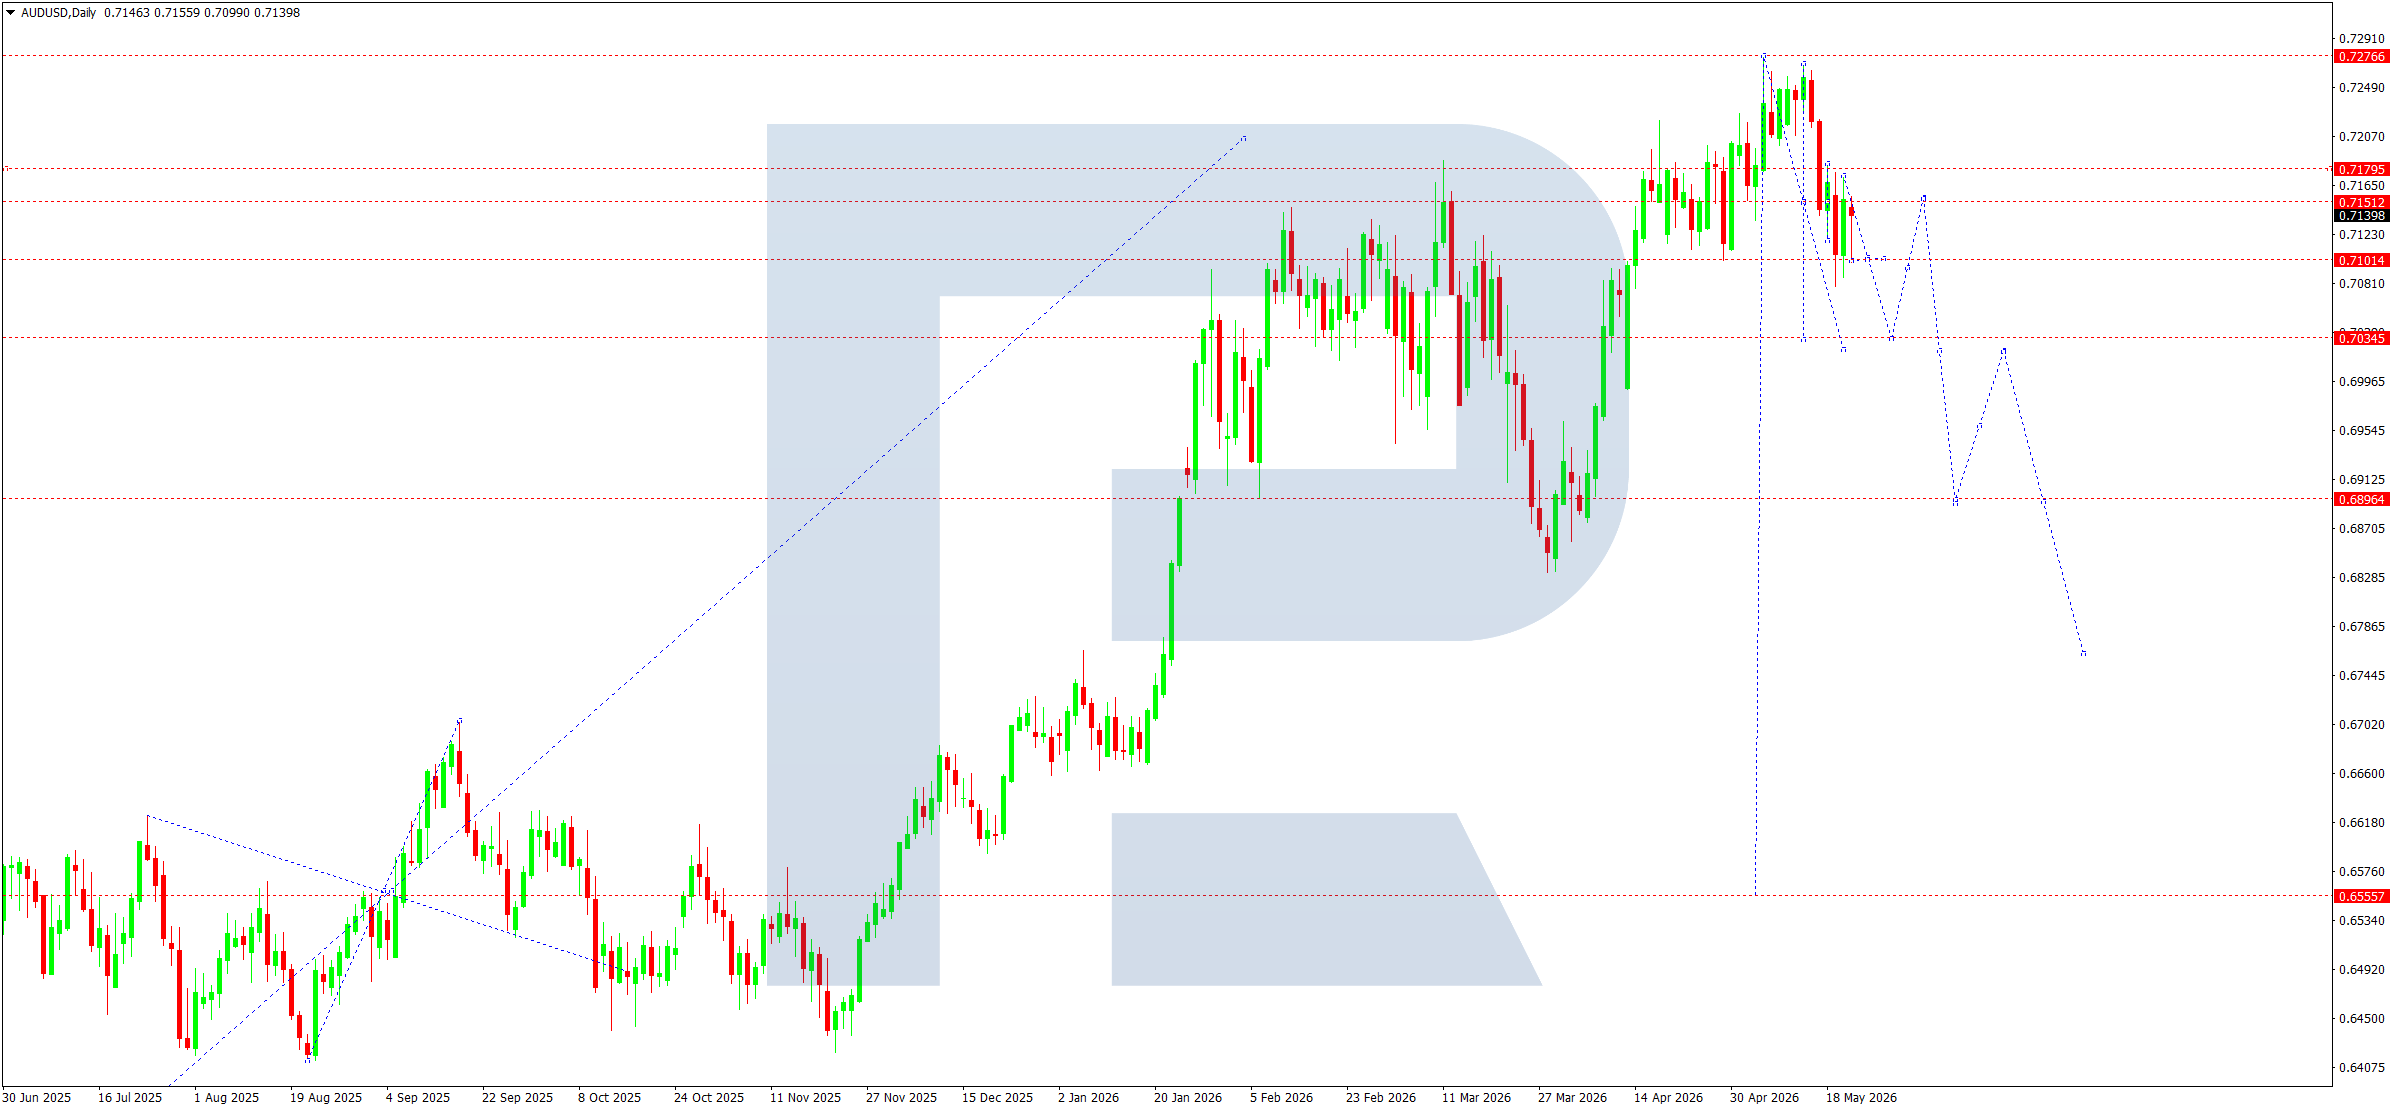
From a technical perspective, the daily AUDUSD chart shows a reversal pattern forming after testing the 0.7266–0.7277 zone. The market failed to hold above the 0.7179 resistance level, which increased the probability of a downward wave. The current decline from the 0.7171 area maintains bearish momentum and opens the potential for movement towards the 0.7035 support level.
The nearest resistance area is located in the 0.7155–0.7179 range. While the price remains below this zone, selling pressure persists. Intermediate support runs near 0.7101. A breakout of this level will confirm the decline towards 0.7035, and then increase the probability of a test of the 0.6896 level. The chart structure shows a sequence of lower highs, which is consistent with the scenario of continued correction after the previous upward cycle was completed.
The bullish scenario remains an alternative. For it to materialise, buyers need to push the price back above 0.7179 and gain a foothold above this level. In this case, the market will be able to retest the 0.7266 mark, with the potential for further gains.
AUDUSD forecast scenarios
Bearish scenario (baseline): a decline below 0.7101 will strengthen the downward momentum and open the door for movement towards 0.7035.
Bullish scenario (alternative): a breakout above 0.7179 will enable continued growth towards 0.7266.
USDCAD forecast
The US dollar ended last week maintaining an advantage over the Canadian dollar amid steady demand for safe-haven assets, hawkish expectations for US interest rate policy, and a weaker oil factor for the CAD. Recent Canadian data showed weaker inflation dynamics, reducing expectations of further policy tightening by the Bank of Canada. At the same time, the market continues to closely monitor signals from the Federal Reserve regarding the rate path. A strong dollar, US bond yields, and cautious BoC rhetoric form a moderately positive fundamental backdrop for the USDCAD pair. Oil market instability remains an additional pressure factor for the Canadian dollar: the corrective decline in oil prices limits support for the commodity currency.
USDCAD technical analysis
From a technical perspective, the daily chart maintains the structure of an uptrend. The key event of the week was a breakout of the 1.3780 level on rising volumes, which practically confirms the continuation of the fifth upward wave. The market is consolidating above the 1.3785 pivot point, keeping buyers in control of the short-term movement structure.
The nearest local target of the fifth wave is 1.3860, which is now becoming the main upside target. Consolidation above 1.3860 could open the way for a test of the upper resistance level at 1.4000, which is viewed as the strategic target of the current upward cycle.
At the same time, local pullbacks towards the 1.3785 pivot point cannot be ruled out during the week, where the market will test the sustainability of the breakout. While the price holds above this area, the baseline scenario suggests an upward trend. The structure of sequential higher lows formed after the reversal from the 1.3579 level remains an additional technical argument in favour of buyers.
USDCAD forecast scenarios
Bullish (baseline): continued growth in the fifth wave to 1.3860, followed by movement towards the strategic target at 1.4000.
Bearish (alternative): if the market breaks below 1.3785 with volume confirmation, the probability of a corrective decline towards 1.3707 will increase.
XAUUSD forecast
Gold closed last week under pressure from a strong dollar, high US bond yields, and persistent expectations of tight monetary policy from the US Federal Reserve. The market continues to reassess the likelihood of high rates remaining for a longer period amid persistent inflationary pressure, fuelled by high energy prices and geopolitical tensions. Rising UST yields act as an additional pressure factor for safe-haven assets, increasing the opportunity cost of holding gold. At the same time, the geopolitical backdrop and inflation risks continue to maintain interest in the metal, although this is not yet enough to form a sustainable upward reversal.
XAUUSD technical analysis
From a technical perspective, XAUUSD continues to trade the fifth downward wave within the main downtrend. Within it, the structure of the first wave in the fifth has already appeared, confirming continued bearish momentum. The nearest estimated target of the current movement is located at 4,411. At the same time, the market may extend the move towards the psychological 4,400 area at minimum before a corrective pullback forms.
After the 4,411–4,400 zone is reached, a truncated corrective wave is expected to develop, with a potential return to the 4,590 resistance level. This area looks key for assessing the strength of sellers. If corrective growth remains limited and the market confirms the 4,411 pivot point, the probability of renewed downward movement with the next target at 4,224 will be high.
The next phase of the decline is seen as a higher-order corrective wave. The local structural target is at 4,224, while the strategic target of the current wave is the 3,920 area. This is where the entire corrective decline model may end.
In the broader wave context, the current bearish phase remains corrective within the senior uptrend. After this correction is completed, the baseline long-term scenario remains a recovery in global growth, with a potential target at 6,260.
XAUUSD forecast scenarios
Bearish (baseline): a decline to 4,411–4,400, followed by a correction towards 4,590 and renewed decline to 4,224. The main strategic target is 3,920.
Bullish (alternative): if the market consolidates above 4,590 on rising volumes, a deeper correction is possible, with prices retesting the upper resistance levels.
Brent forecast
The oil market ended last week amid elevated volatility, where geopolitical risks, producer policy, and expectations for global demand remain the key drivers. Market participants are focused mainly on the situation in the Middle East, uncertainty over supplies through the Strait of Hormuz, and expectations regarding OPEC+ decisions on June-July quotas. US oil inventory dynamics and industrial demand from China also have an impact. At the same time, some investors continue to price in the likelihood of higher OPEC+ production, while supply disruptions are preventing the oil market from entering a deep correction.
Signals of slower refining activity in China and revisions to global demand forecasts remain restraining factors, but the supply deficit still gives buyers the advantage. At the same time, the market is closely monitoring prospects for Iran negotiations, as any signs of supply normalisation could quickly change the price balance.
Brent technical analysis
From a technical perspective, Brent maintains a medium-term upward structure on the daily chart. After an impulsive rise, the market formed a corrective phase in the 98.84–111.40 range. The 98.84 level acts as the key pivot point and important support for the current wave structure. As long as prices hold above this level, the probability of the correction ending and upward movement resuming remains.
The nearest target for buyers is around 111.40. Consolidation above this level will open the way for the next impulse towards 115.62. If the breakout is confirmed on rising volumes, the market may continue to move towards 123.40, and in the broader strategic perspective, test the 138.88 area.
At the same time, an intermediate volatile correction remains possible. Selling pressure may increase if prices return below 101.00, followed by a test of 98.84. However, the current chart structure still points more towards an upward scenario, with a new impulse forming towards the upper resistance levels.
Brent forecast scenarios
Bullish scenario (main): the market is completing the correction near 98.84–101.00. Further growth towards 111.40 follows. A breakout above the 111.40 level on rising volumes would open the potential for continued movement towards 123.40 and then 138.88.
Bearish scenario (alternative): the market remains under downward pressure towards 98.84. If this level is broken downwards with volume confirmation, the probability of a corrective move along the downtrend towards 92.50–88.00 will increase.
Editors’ picks
 EURUSD 2026-2027 forecast: key market trends and future predictions
This article provides the EURUSD forecast for 2026 and 2027 and highlights the main factors determining the direction of the pair’s movements. We will apply technical analysis, take into account the opinions of leading experts, large banks, and financial institutions, and study AI-based forecasts. This comprehensive insight into EURUSD predictions should help investors and traders make informed decisions.
 Gold (XAUUSD) forecast 2026 and beyond: expert insights, price predictions, and analysis
Dive deep into the Gold (XAUUSD) price outlook for 2026 and beyond, combining technical analysis, expert forecasts, and key macroeconomic factors. It explains the drivers behind gold’s recent surge, explores potential scenarios including a move toward 4,500 to 5,000 USD per ounce, and highlights why the metal remains a strong hedge during global uncertainty.
Forecasts presented in this section only reflect the author’s private opinion and should not be considered as guidance for trading. RoboForex bears no responsibility for trading results based on trading recommendations described in these analytical reviews.