Weekly technical analysis and forecast (1–5 June 2026)
In this weekly technical analysis, we review key chart patterns and levels for EUSUSD, USDJPY, GBPUSD, AUDUSD, USDCAD, gold (XAUUSD), and Brent oil to forecast developments for the upcoming week (1–5 June 2026)
Major technical levels to watch this week
- EURUSD: Support: 1.1575, 1.1444. Resistance: 1.1617, 1.1847
- USDJPY: Support: 158.92, 156.42. Resistance: 160.45, 161.21
- GBPUSD: Support: 1.3290, 1.3180. Resistance: 1.3400, 1.3490
- AUDUSD: 0.7073, 0.7014. Resistance: 0.7172, 0.7203
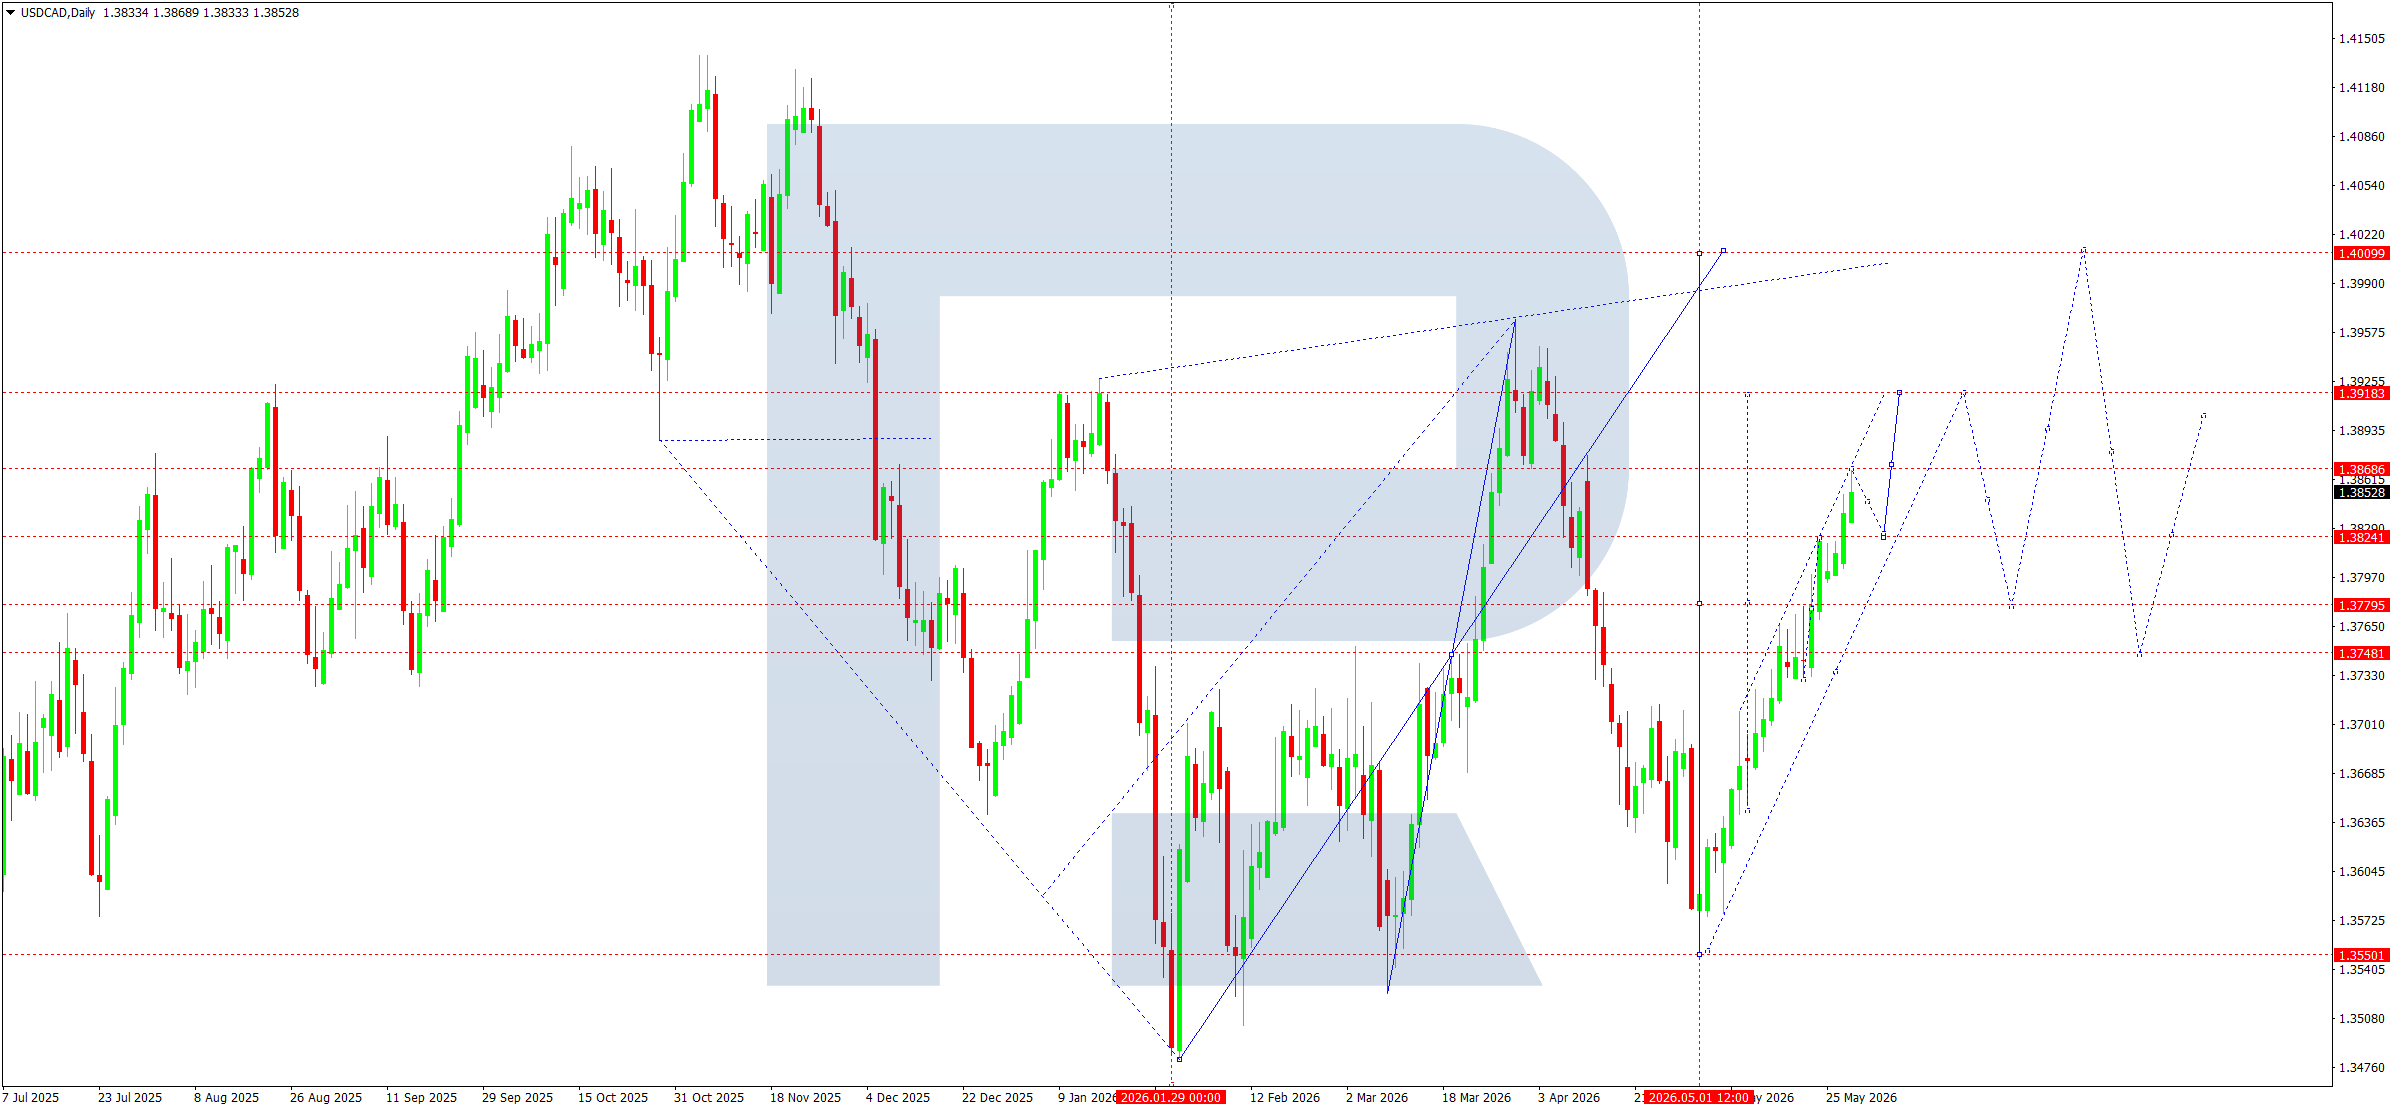
- USDCAD: Support: 1.3780, 1.3748. Resistance: 1.3918, 1.4000
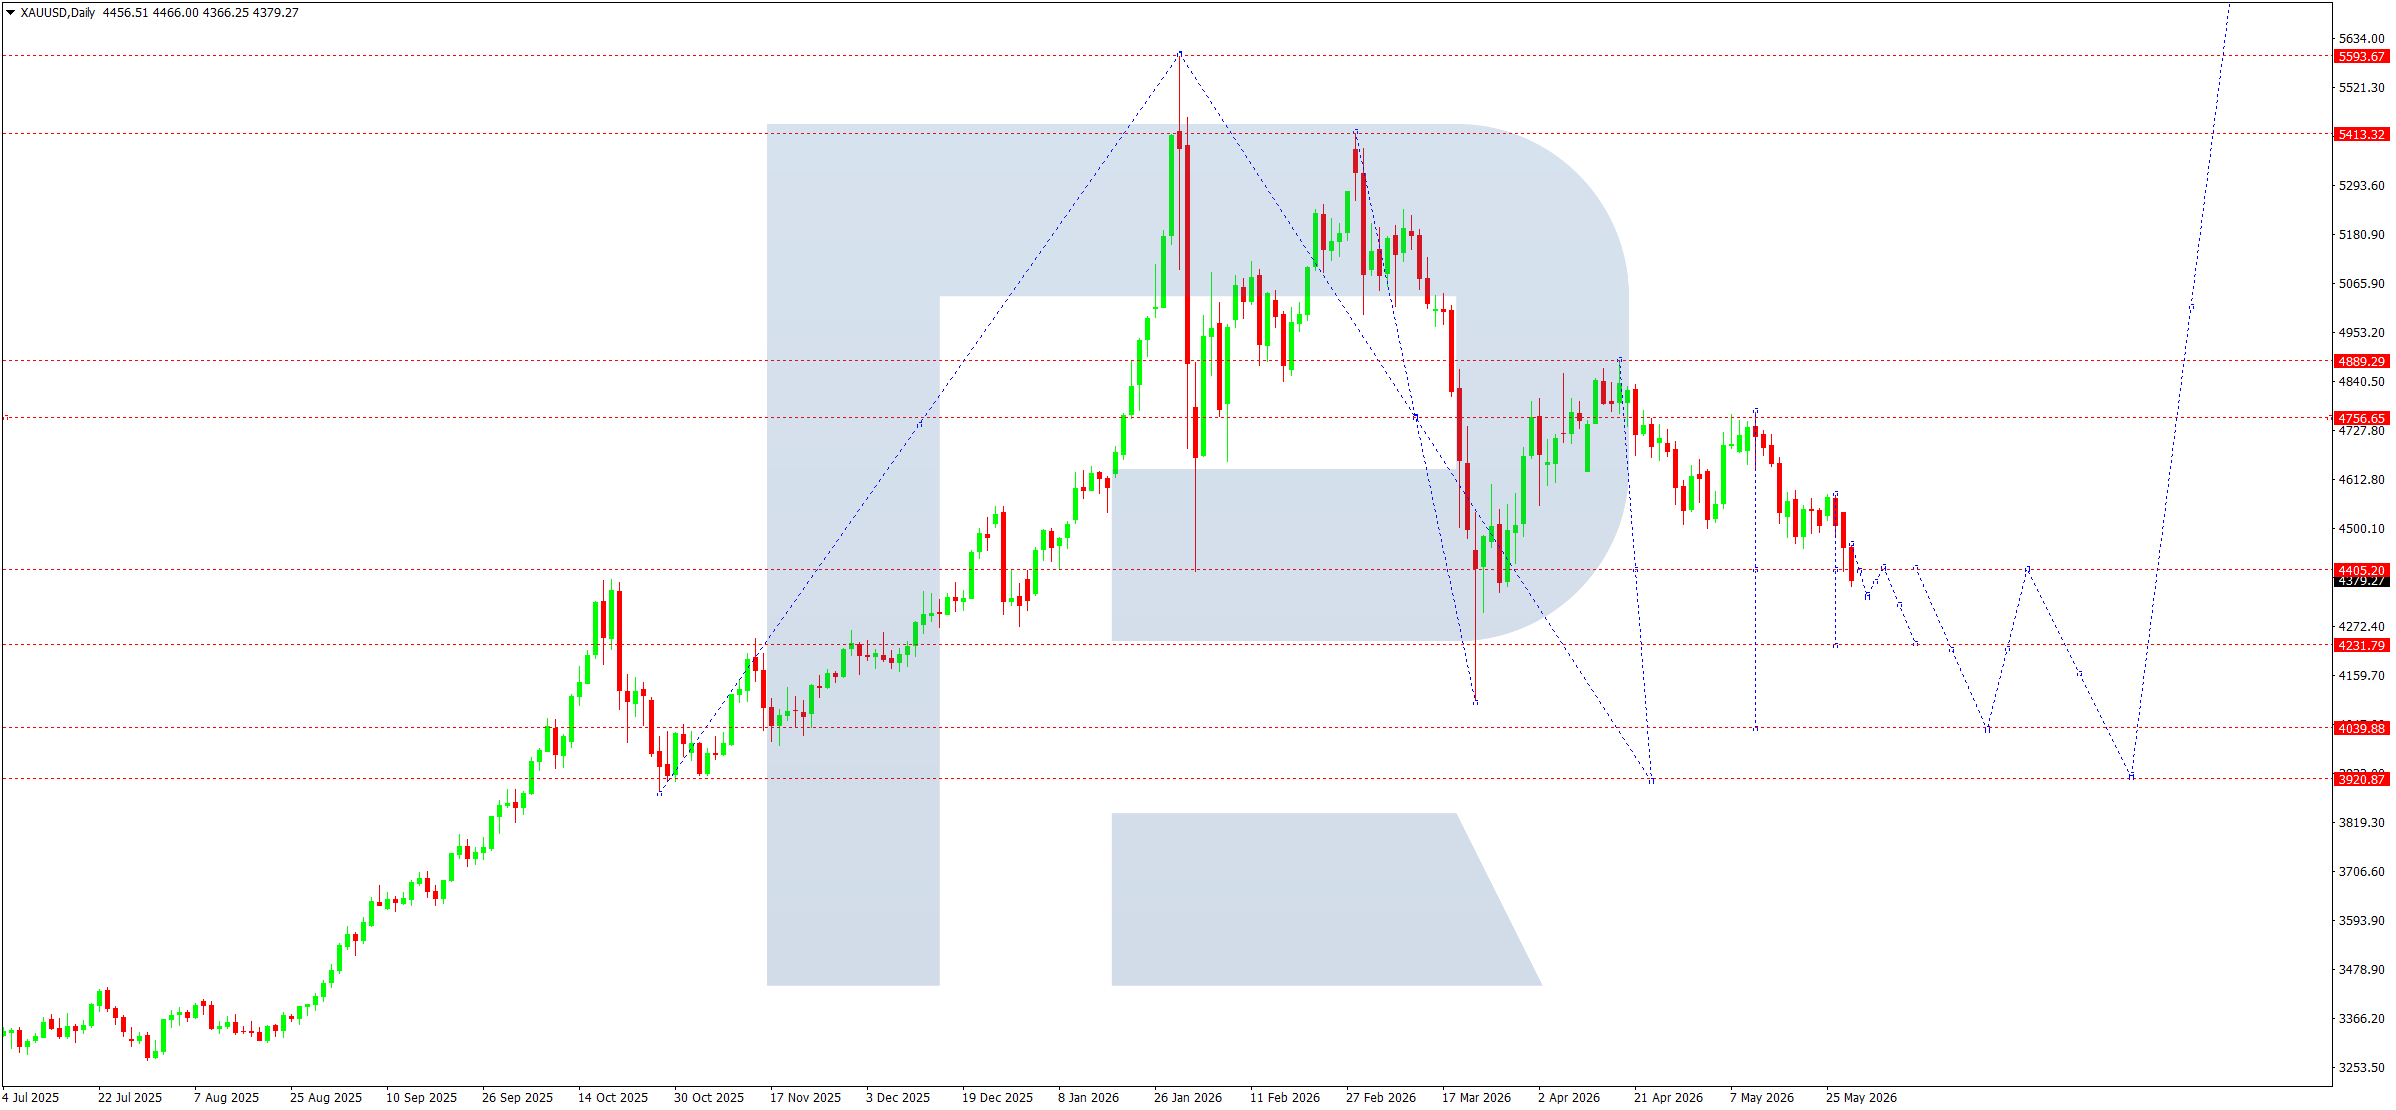
- Gold: Support: 4,222, 4,044. Resistance: 4,500, 4,765
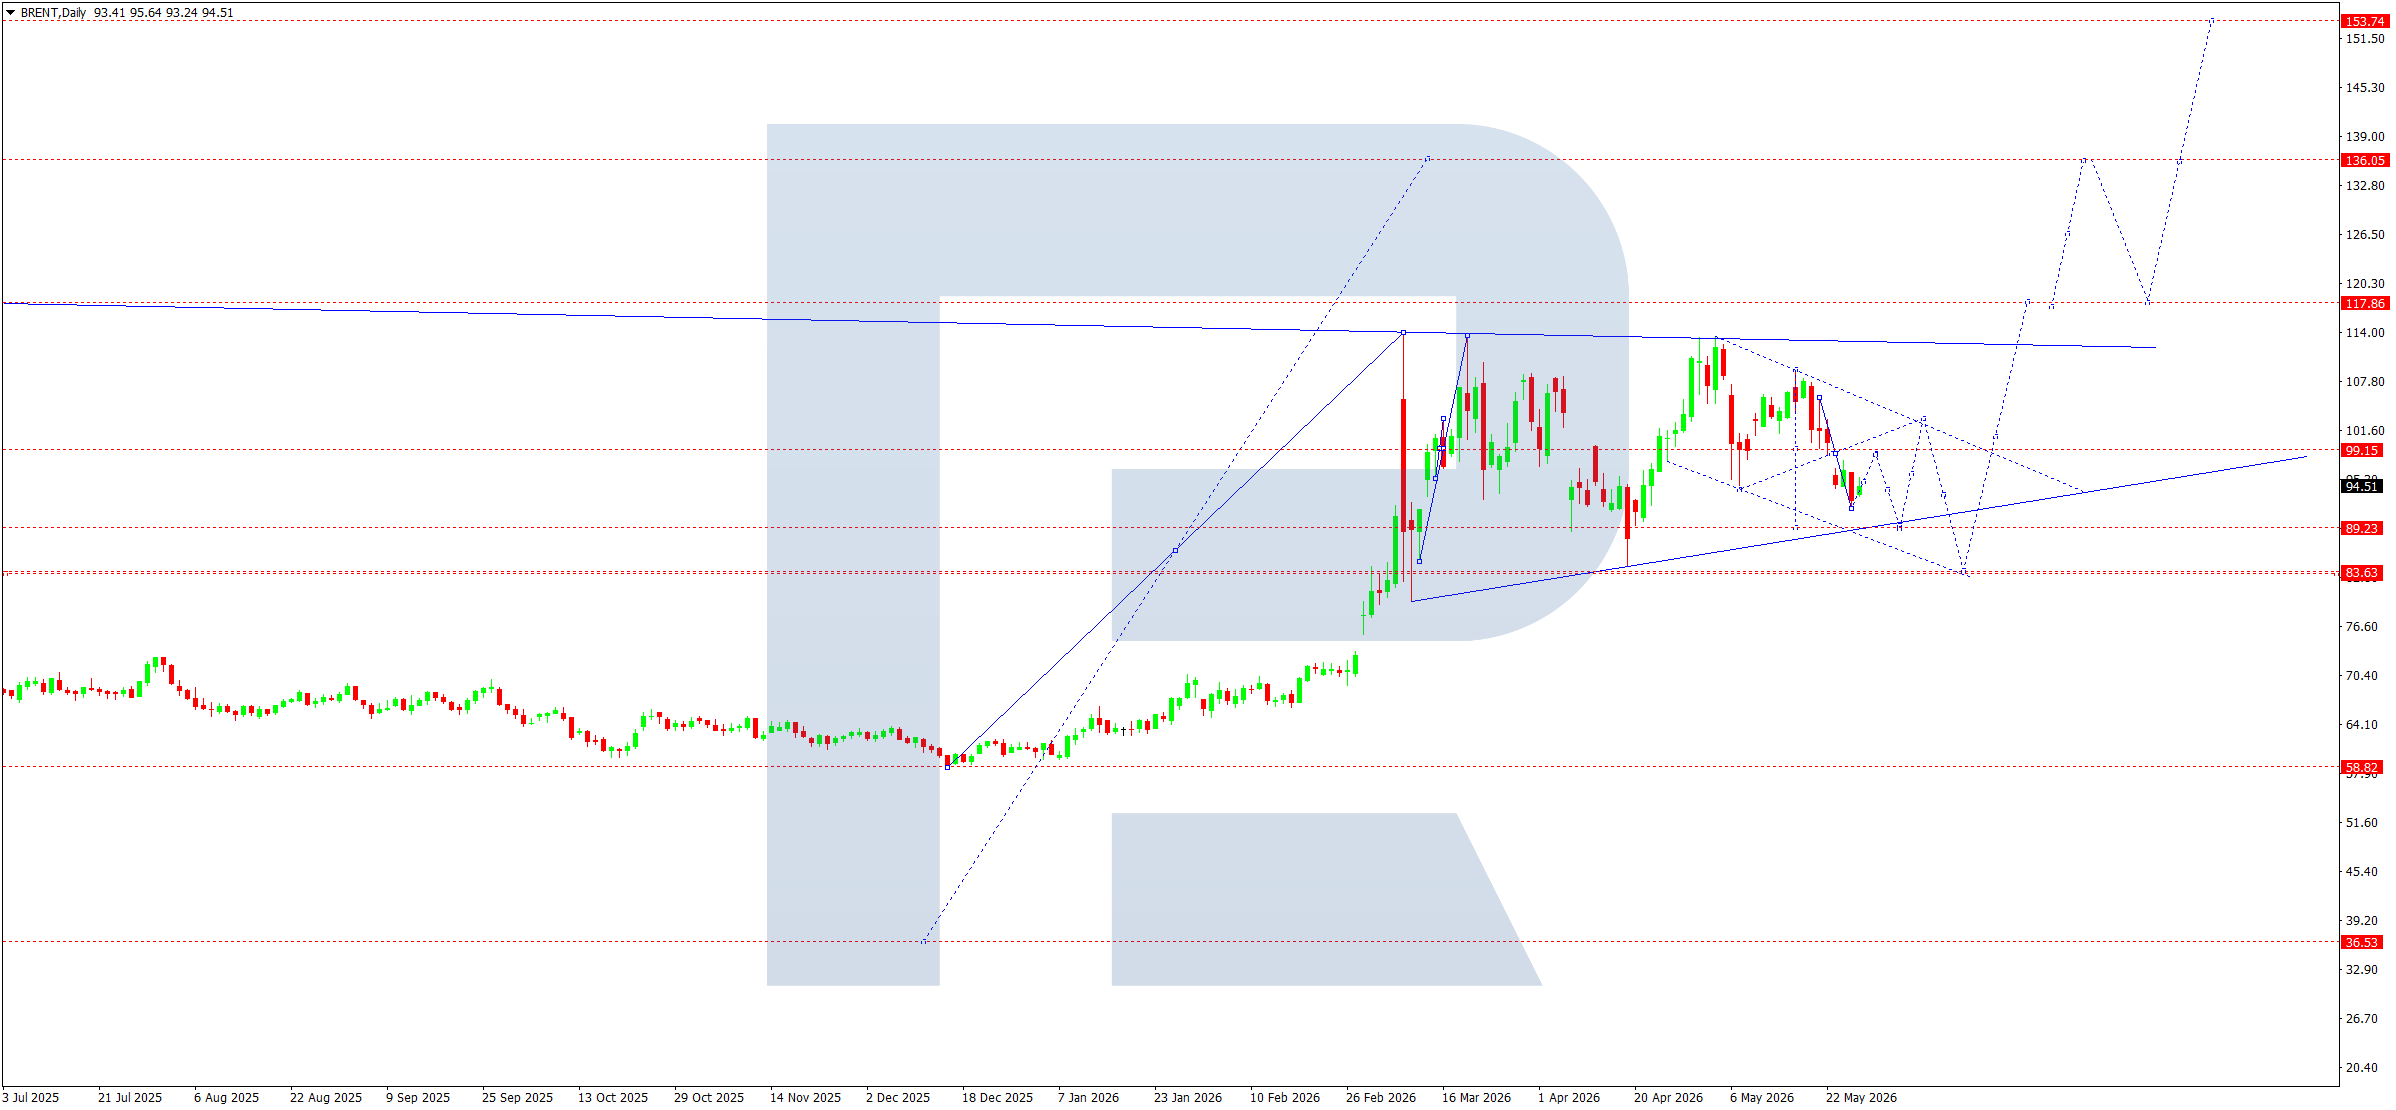
- Brent: Support: 89.23, 83.63. Resistance: 99.15, 101.60
EURUSD forecast
EURUSD ended the week under pressure from stronger demand for the US dollar. The combination of geopolitical tension in the Middle East, rising oil prices, and revised interest rate expectations remains the key market driver. Escalation around Iran supports safe-haven demand for the US currency, while the market is again discussing the probability of a more hawkish stance from the US Federal Reserve. Investors will also focus on US inflation statistics and comments from Fed representatives.
For the euro, the backdrop remains mixed. The European Central Bank maintains a cautious approach, although rising energy prices increase inflation risks in the eurozone. At the same time, weak economic growth prospects limit the single currency’s upside potential. The market continues to assess the probability of more hawkish ECB rhetoric, but the advantage remains with the dollar.
EURUSD technical analysis
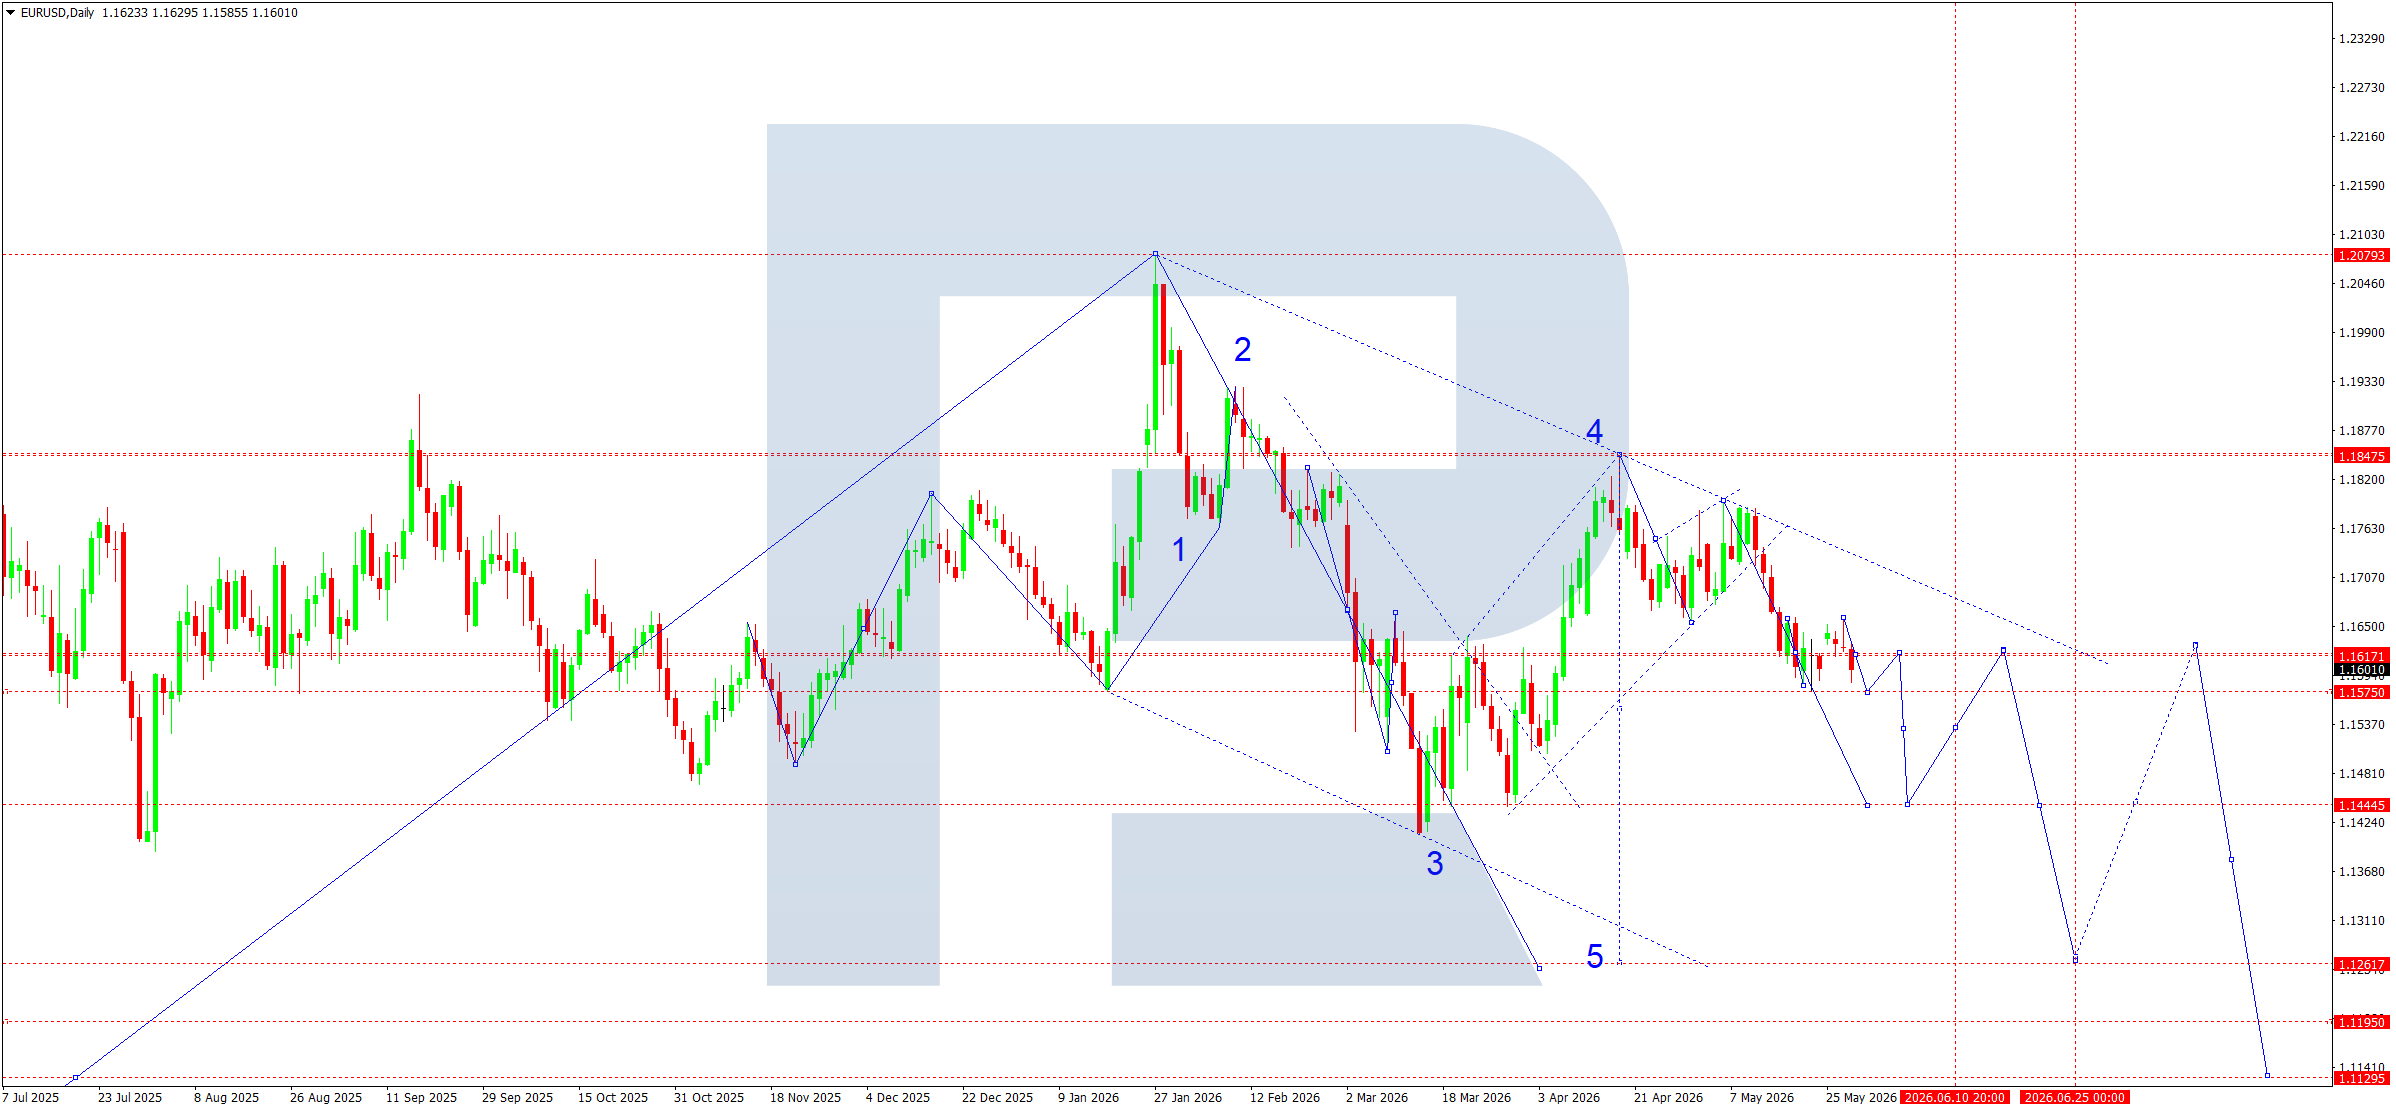
The daily chart maintains a medium-term bearish structure. After forming a peak near 1.2079, the market continues to develop a downward impulse. Within the broader structure, a corrective pattern is visible, with waves 1–4 already confirmed and a high probability of the fifth downward wave forming.
At present, the market is trading near the 1.1617–1.1601 Pivot Point. From a technical perspective, this range acts as a short-term equilibrium zone. The risk remains that a broad sideways range may form between 1.1575 and 1.1617 before the next downward impulse.
The nearest local target for sellers is 1.1444. This level corresponds to support within the assumed third wave of a lower order and has already triggered an active buyer reaction. However, the main technical target under the current structure remains significantly lower, in the 1.1261–1.1195 area. This area is viewed as a potential completion zone for the fifth downward wave.
From above, the descending channel continues to apply pressure. Any corrective rises towards 1.1617 and then 1.1847 still look like corrections against the main trend. Only stable consolidation above 1.1847 could call the baseline bearish scenario into question and open the way to a deeper upward correction.
EURUSD forecast scenarios
Bearish scenario (baseline): consolidation around 1.1601–1.1575, followed by a downside breakout towards 1.1444. The main downside target is 1.1261.
Bullish scenario (alternative): if 1.1617 is broken upwards on rising volumes, a correction towards 1.1847 may develop.
USDJPY forecast
USDJPY ends the week near the 159.40–159.50 zone, maintaining a clear upward bias amid high US bond yields and expectations of continued policy tightness from the Fed. The divergence in monetary expectations between the US and Japan remains at the centre of market attention. Recent Japanese inflation data confirm persistent price pressure, while Bank of Japan officials allow for further rate hikes. However, the market still views the pace of Japanese policy tightening as limited. Geopolitical risks, higher energy prices, and continued demand for US assets provide additional support for the dollar.
USDJPY technical analysis
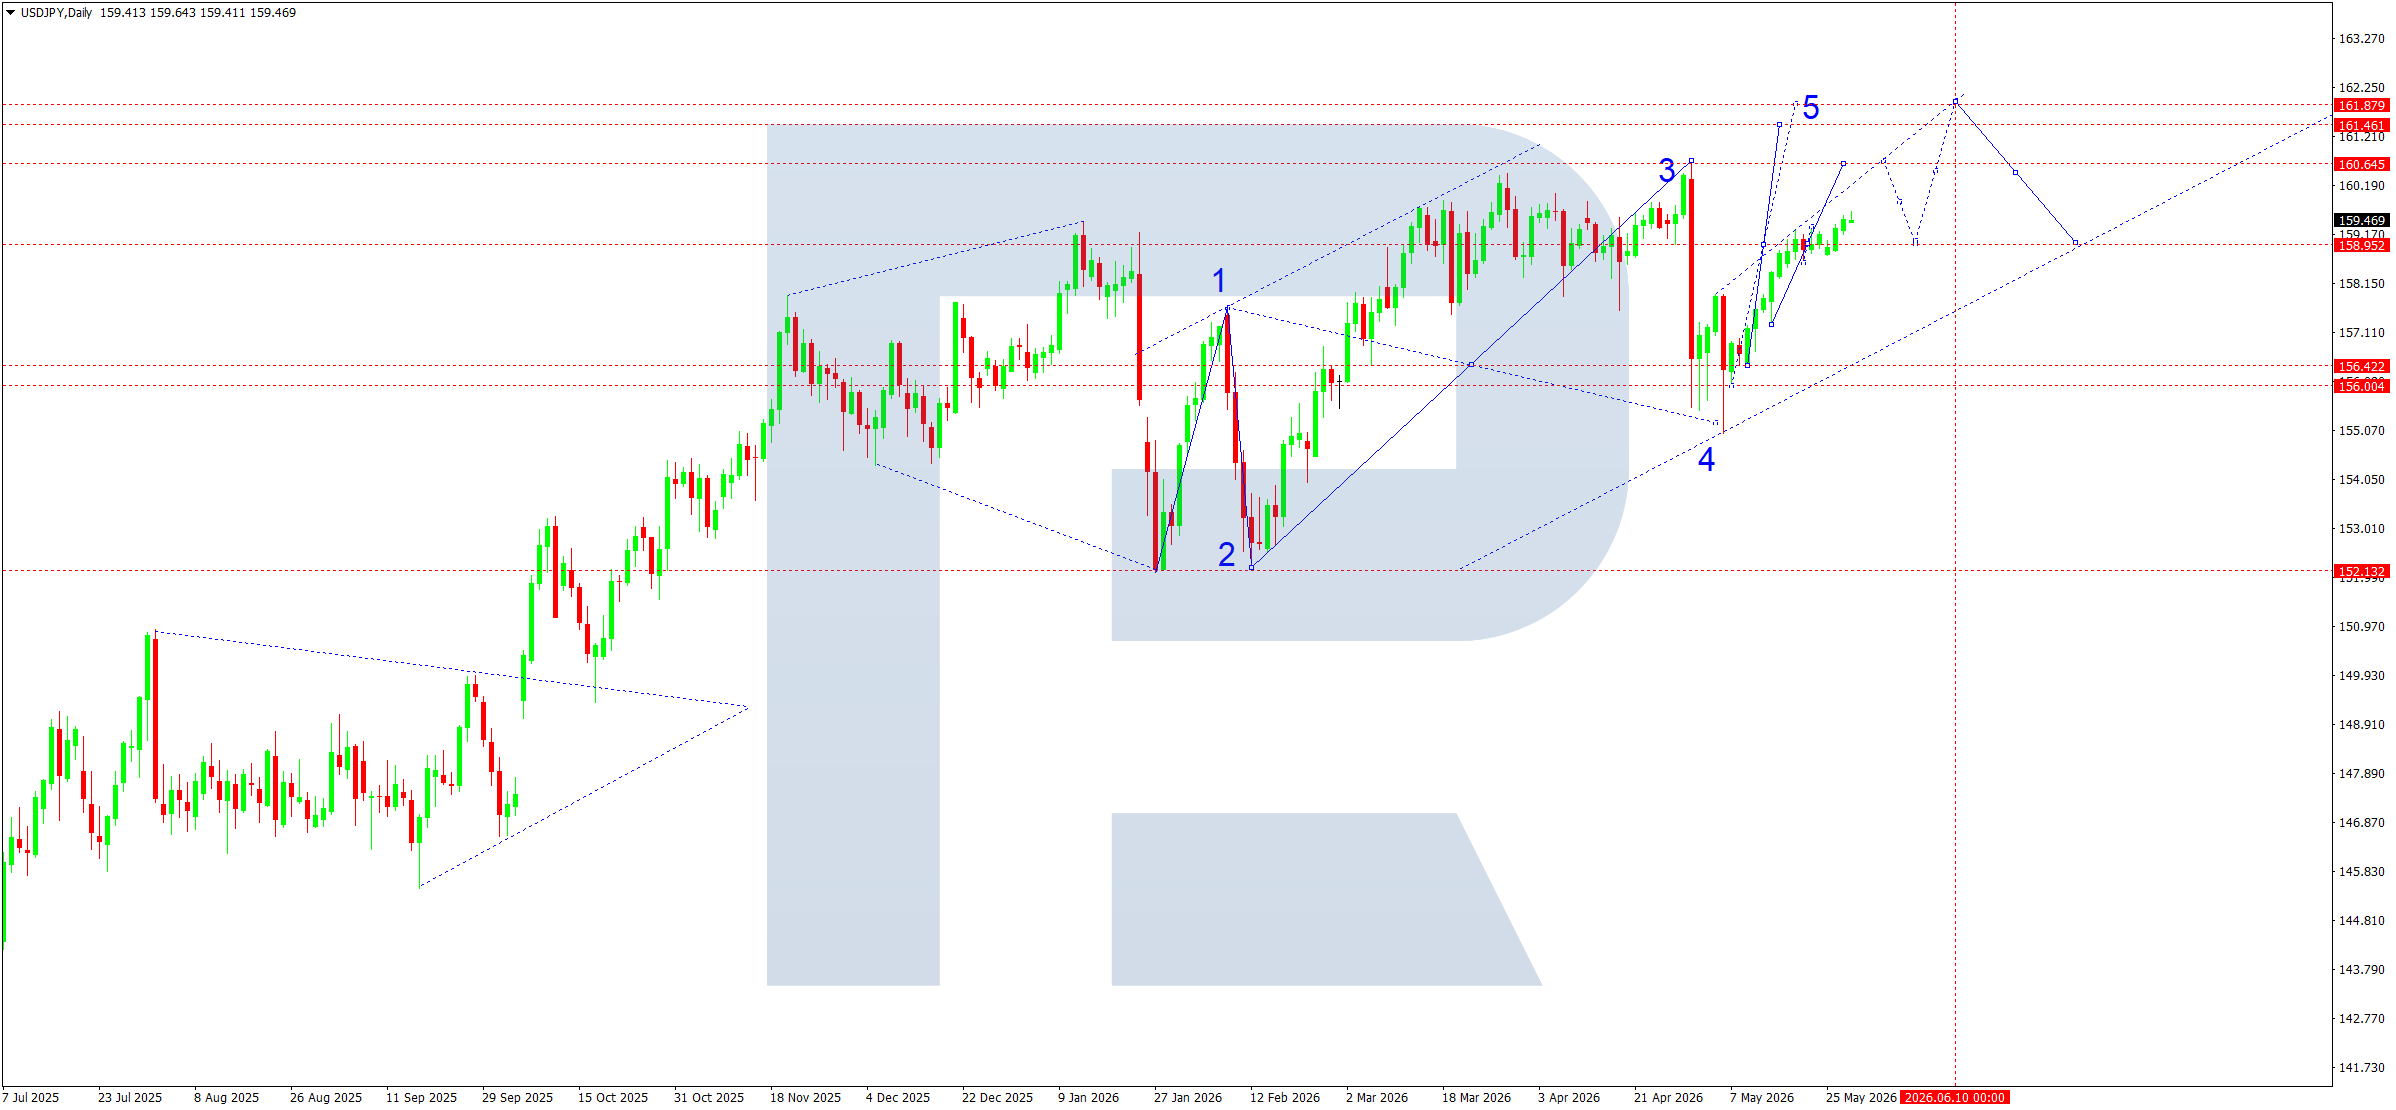
From a technical perspective, the daily chart continues to show the development of an Elliott upward structure. After wave 4 formed in the 156.00–156.40 area, the market moved into a new upward impulse phase. The current rise is forming the internal structure of the fifth wave. The key Pivot Point is located in the 158.92–159.17 area. Holding above this zone keeps priority with the scenario of continued upward movement.
The nearest target for buyers is resistance at 160.45. A break of this level will practically confirm the development of the final part of the impulse, with potential movement towards 161.21 and then to the main strategic target at 161.88. The channel structure also supports the scenario of movement towards the upper boundary of the rising range. At the same time, an interim correction after a test of the 160.45–160.65 zone cannot be ruled out before growth resumes.
The alternative scenario is linked to the formation of a corrective phase within the fifth wave. A loss of 158.92 will increase pressure on the pair and open room for a decline towards 156.42, where the nearest strong support and the lower boundary of the local rising channel are located. However, while price holds above the 158.90 area, the medium-term structure remains bullish.
USDJPY forecast scenarios
Bullish (baseline): a break of 160.45 opens potential for continued growth towards 161.21 and then 161.88.
Bearish (alternative): if the market breaks 158.92 on rising volumes, a decline towards 156.42 can be considered.
GBPUSD forecast
The pound ends the week under pressure from stronger demand for the US dollar. The market continues to reassess the interest rate outlook after hawkish comments from Federal Reserve officials, while rising geopolitical tensions in the Middle East support safe-haven demand for the US currency. Inflation risks through the energy sector remain an additional factor, limiting the scope for Fed policy easing.
For the British currency, the backdrop remains more restrained. The market assesses the mixed outlook for the UK economy: slowing domestic demand, lower consumer activity, and persistent fiscal risks are putting pressure on expectations for future Bank of England policy. At the same time, rising domestic political uncertainty in the UK also reduces the pound’s appeal.
GBPUSD technical analysis
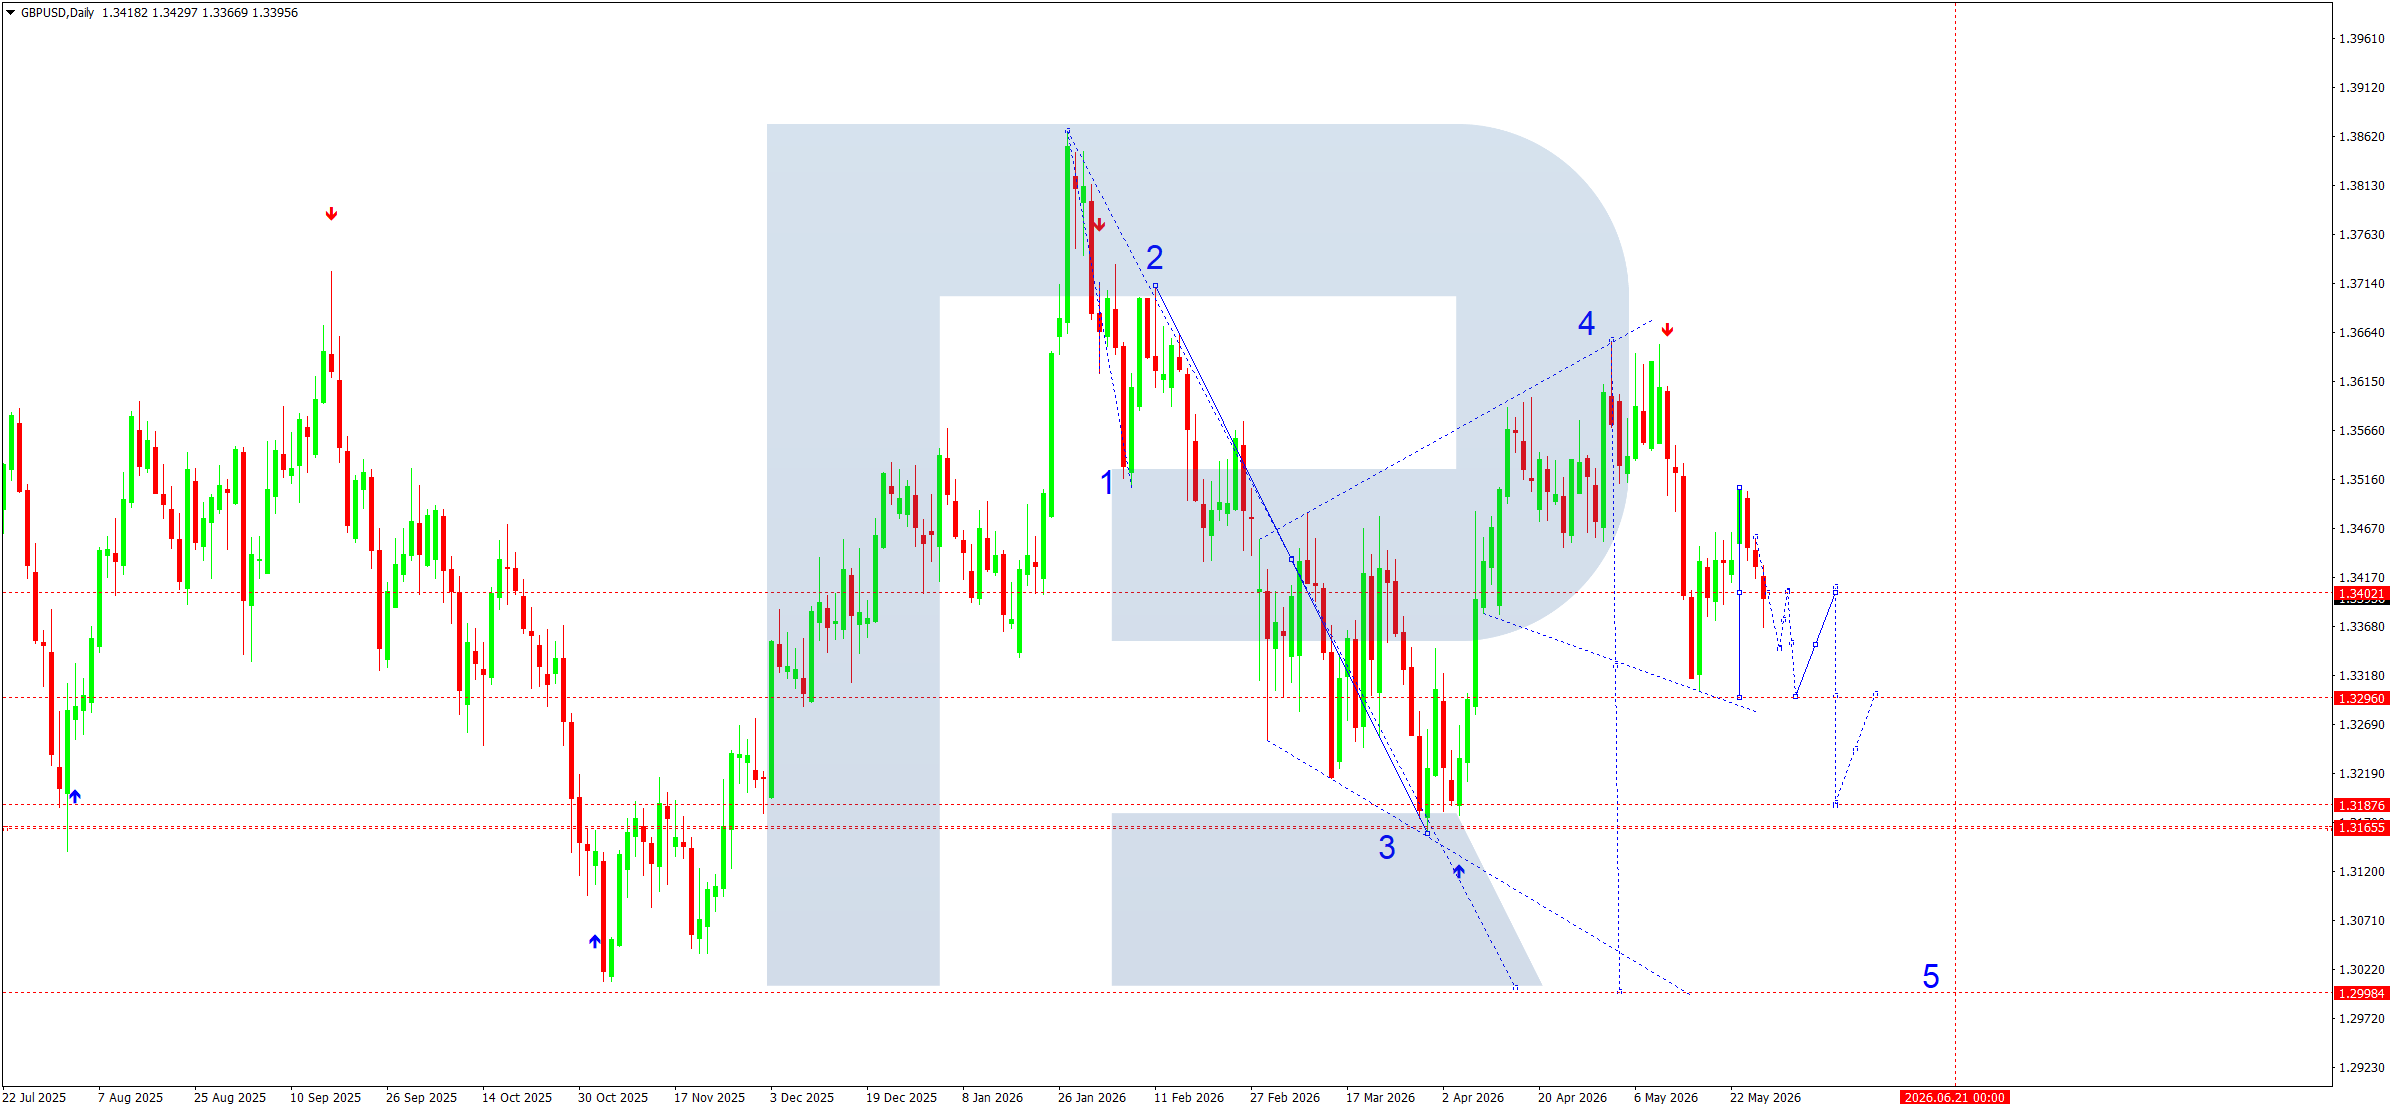
From a technical perspective, the daily GBPUSD chart maintains the development of the fifth downward wave in the main downtrend. At this stage, the market is forming the internal structure of the fifth wave. The first wave within the fifth has already received confirmation at 1.3290, after which the market formed a corrective second wave towards 1.3400.
The current structure assumes the development of the third wave within the fifth, with a calculated target at 1.3180. After this zone is reached, a corrective fourth wave may form, returning towards 1.3290. This level acts as the key Pivot Point within the entire fifth wave and will play a decisive role in confirming the next downward impulse.
While the market trades below 1.3400, the medium-term priority remains with sellers. A break of support at 1.3290 could accelerate the development of the downward impulse towards 1.3180, followed by a transition to the final phase of the fifth wave. The main strategic downside target is located around 1.3000. This level corresponds to the completion of the entire current wave structure and may become the zone where most of the downward movement is realised.
GBPUSD forecast scenarios
Bearish scenario (main): a decline below 1.3290 along the downtrend towards 1.3180 and then to the main target at 1.3000.
Bullish scenario (alternative): if the market consolidates above 1.3400 on rising volumes, a corrective recovery towards 1.3490 can be considered.
AUDUSD forecast
The Australian dollar ends the week under pressure after a local pullback from yearly highs, although the medium-term fundamental backdrop for AUD remains mixed. The market is focused on expectations for Fed interest rates, US inflation and UST yield dynamics, and the resilience of the Australian economy. Recent Australian inflation data showed a slowdown in the headline figure, although underlying price pressure remains above the target range, keeping the Reserve Bank of Australia cautious. Chinese demand and the outlook for China’s economy remain additional factors for AUD, as any slowdown in Chinese industrial activity directly affects Australia’s export sector. At the same time, the market is closely assessing the probability that the Fed will maintain more hawkish rhetoric, which continues to support the US dollar.
AUDUSD technical analysis
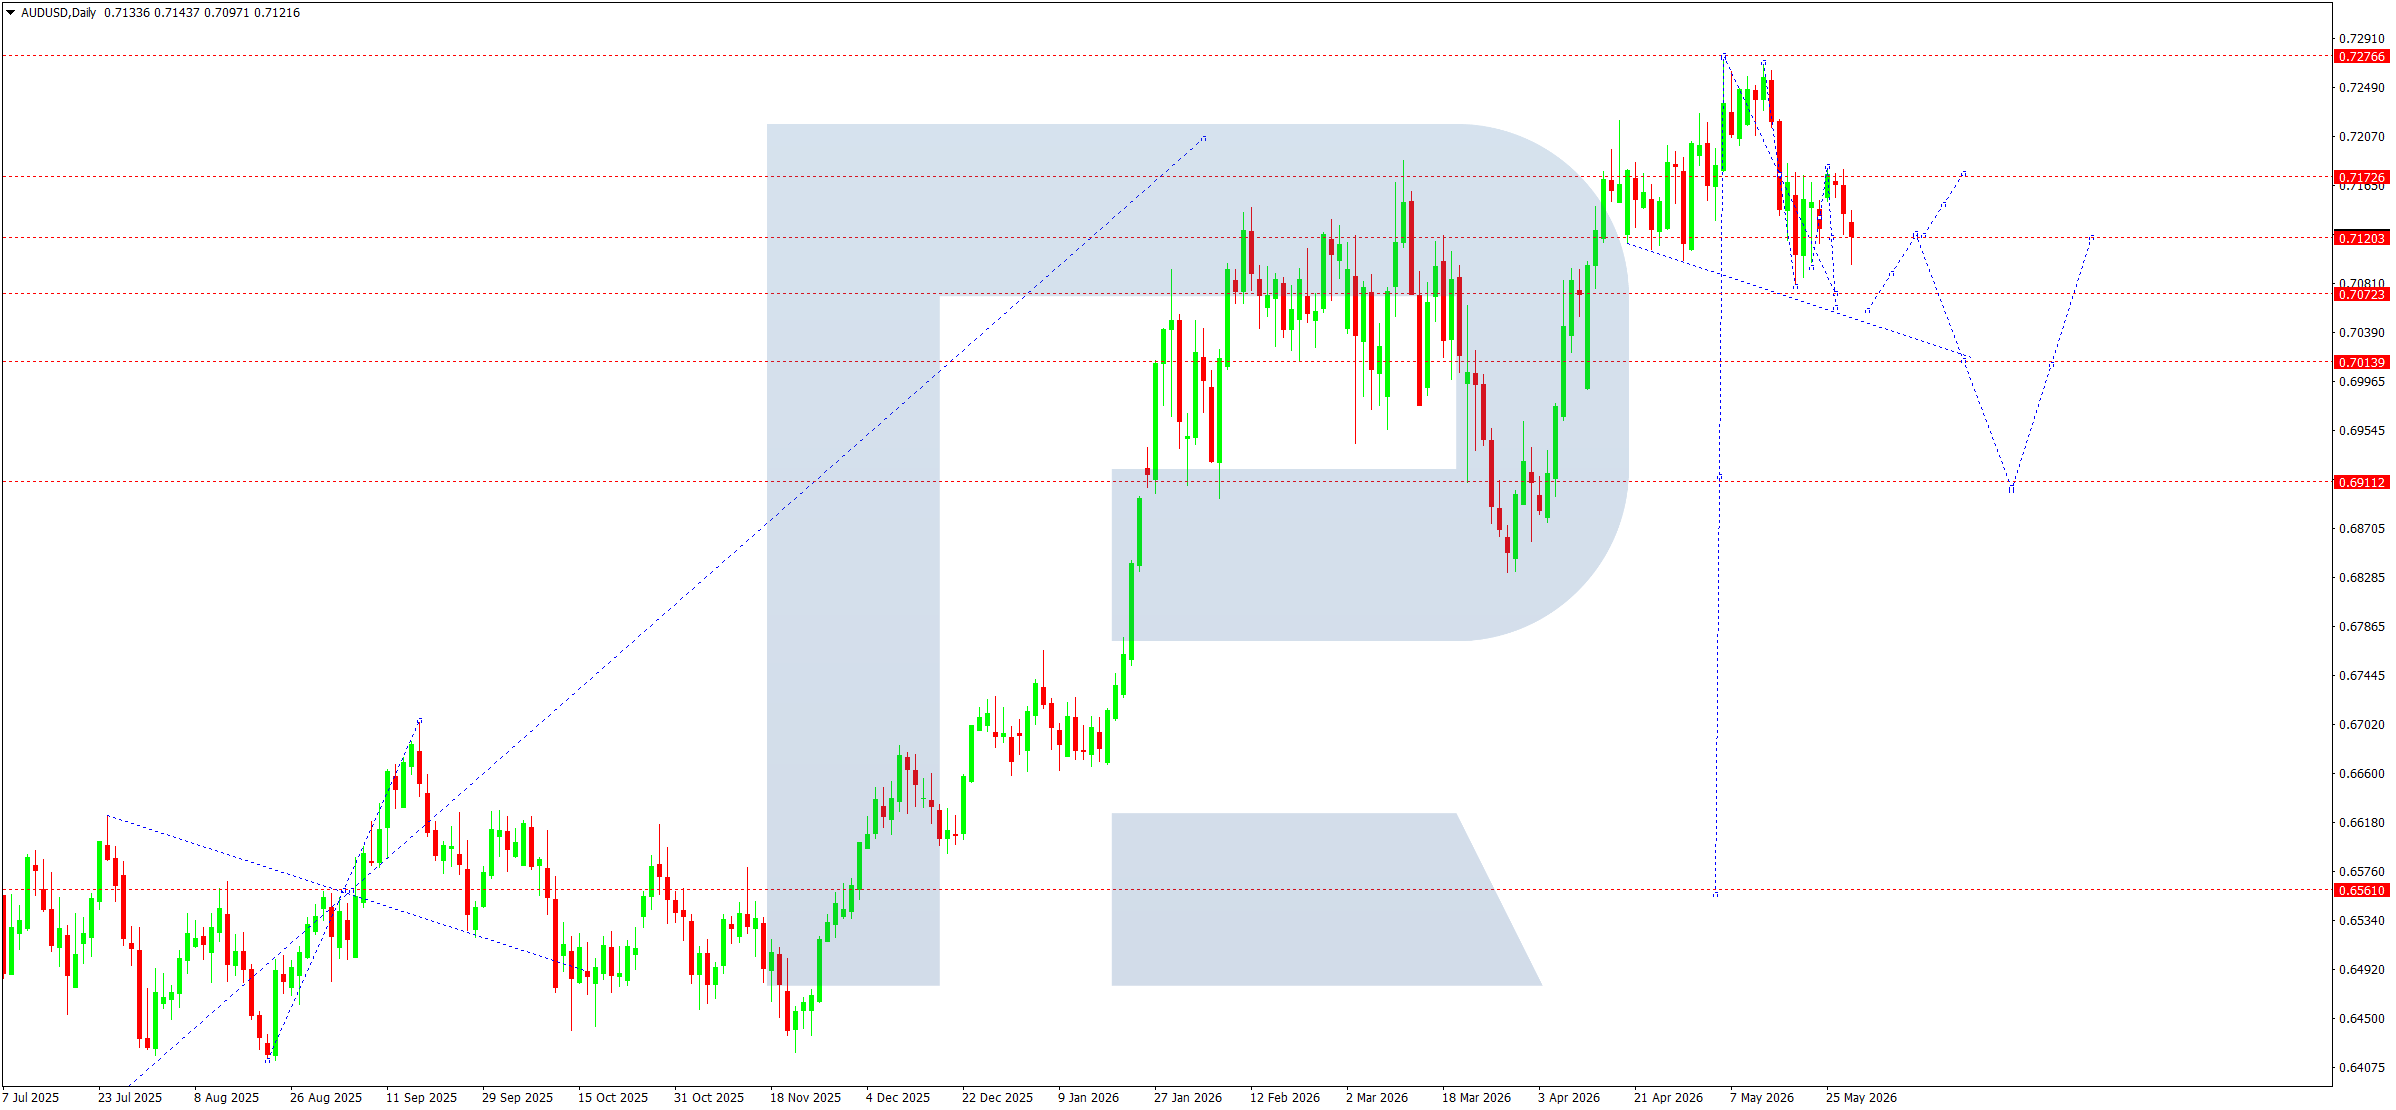
From a technical perspective, AUDUSD is trading in a corrective phase after forming a peak near 0.7276. A downward wave structure is developing on the daily chart, where the market has already tested the 0.7120–0.7073 area. Current dynamics indicate that seller pressure remains below resistance at 0.7172.
The key zone remains the 0.7073–0.7120 range. Holding below 0.7172 preserves the risk of a continuation of the downward correction, with a retest of 0.7073. If seller momentum strengthens, the move may deepen towards 0.7014, which acts as the next local downside target. The chart structure also suggests the probability of a corrective recovery wave from 0.7073, although this scenario will require confirmation from rising volumes and a return above 0.7120.
Resistance at 0.7172 remains an important Pivot Point for the short-term range. Consolidation above this level will open the way to another move into the 0.7203 area, followed by a test of 0.7276 – the main resistance of the current cycle.
AUDUSD forecast scenarios
Bearish scenario (baseline): a decline along the downtrend forms a continuation of the correction towards 0.7073, with a likely extension into the 0.7014 area.
Bullish scenario (alternative): if the market breaks 0.7172 upwards on rising volumes, growth towards 0.7203–0.7276 is possible.
USDCAD forecast
USDCAD ends the week with the US dollar still holding an advantage amid hawkish interest rate expectations and an elevated geopolitical premium in commodity assets. Recent US inflation data increased market caution regarding the next steps from the Federal Reserve: inflation pressure remains persistent, while some regulator representatives allow for tight policy to remain in place for longer than expected.
For the Canadian dollar, the key factors remain Bank of Canada expectations, oil price movements, and the state of the domestic economy. The market continues to price in a cautious BoC stance ahead of the next rate decision, while mixed economic growth and labour market data limit CAD’s strengthening potential. High energy prices provide additional support for the Canadian currency, although this effect is partly offset by the strong USD and rising US bond yields.
USDCAD technical analysis
From a technical perspective, the market continues to trade within the structure of the fifth upward wave, with the main strategic target near 1.4000. On the daily chart, the Pivot Point of the current wave is forming around 1.3780, which is becoming the key reference point for assessing the next direction.
After recovering from the 1.3550 zone, the market formed a stable upward structure, confirming the persistence of the medium-term bullish impulse. Holding above 1.3780 will support the scenario of further fifth-wave development, with a local target in the 1.3918 area. Consolidation above this resistance could open the way to a test of the psychologically important 1.4000 level.
At the same time, the 1.3868–1.3918 area acts as the nearest resistance zone, where short-term corrections and elevated volatility are likely. Any pullbacks towards the Pivot Point should be viewed as a test of the uptrend’s sustainability. While the market holds above 1.3780, the growth structure remains relevant.
USDCAD forecast scenarios
Bullish (baseline): growth along the uptrend towards 1.3918. After a correction to 1.3780, further growth towards 1.4000 is possible.
Bearish (alternative): if the market breaks below 1.3780 on rising volumes, the probability of a corrective decline towards 1.3748 will increase, with the risk of a deeper move.
XAUUSD forecast
The gold market is ending the week under the influence of a contradictory fundamental backdrop. On the one hand, investors continue to assess the outlook for Fed monetary policy amid persistent inflation and mixed US macroeconomic data. Recent inflation data maintain the risks of a prolonged period of high interest rates, which supports US bond yields and limits demand for non-yielding assets, including gold. On the other hand, the geopolitical premium remains an important pricing factor: the market is closely watching the situation around the Middle East, oil market dynamics, and the inflationary consequences of potential energy supply disruptions.
XAUUSD technical analysis
From a technical perspective, XAUUSD continues to develop the fifth downward wave from 4,885. The nature of the current movement remains corrective within the broader uptrend. At the moment, the market is trading within the structure of the third wave inside the fifth, which keeps pressure on quotes and points to the risk of further decline.
The key calculated level for the current structure is the 4,405 Pivot Point. While the market holds below this area, the downward impulse keeps priority. After breaking support around 4,405, the market is creating space for a continuation of the decline towards 4,231 and then the 4,044 zone.
A consolidation range is expected to develop near 4,405. This area may become an intermediate liquidity accumulation zone before the next impulse. A downside breakout from the range will open potential for movement towards 4,044 as the local target of the downward structure. After the impulsive part of the decline is completed, a corrective phase is likely, with a return test of the 4,0404 area from below.
The main calculated target of the entire fifth downward wave remains 3,920. Completion of this corrective structure may become the starting point for a new upward wave within the global uptrend, with a long-term target towards 6,262.
XAUUSD forecast scenarios
Bearish (baseline): a decline below 4,405, with impulse development towards 4,044 and then 3,920 – the main target of the fifth wave.
Bullish (alternative): a return above 4,570 could lead to a correction towards 4,765, but without cancelling the medium-term downwards scenario.
Brent forecast
The oil market remains highly volatile. The main theme remains the geopolitical situation in the Middle East, where market participants continue to assess risks to supplies through the Strait of Hormuz. Reports of possible diplomatic progress between the US and Iran temporarily reduced the risk premium in prices, although uncertainty around supply logistics continues to support the market. The Federal Reserve’s monetary policy also has an impact: persistent inflation risks limit expectations of rapid policy easing, creating pressure on commodity assets. At the same time, global oil inventory forecasts and OPEC+’s cautious stance continue to provide fundamental support for Brent.
Brent technical analysis
From a technical perspective, Brent continues to form a broad consolidation structure after an impulsive rise. On the daily chart, the market remains inside a narrowing range with support along the upward trend line. At present, prices are trading near 94.50, preserving a neutral-positive balance.
Locally, a corrective phase is developing in the form of a consolidation triangle. The lower boundary of the structure is in the 89.23–83.63 area, while the upper resistance is concentrated in the 99.15–101.60 zone. Holding above 89.23 allows current dynamics to be viewed as preparation for continued growth.
The baseline scenario assumes the completion of the corrective model, followed by a move towards 99.15. Consolidation above this level opens potential for a test of 101.60 and then 117.86. If momentum strengthens, the market could move into the development of a medium-term upward wave with targets at 136.05 and a strategic target near 153.74.
The alternative scenario is linked to a break below support at 89.23. In this case, the probability of a decline towards 83.63 will increase, with the risk of a deeper correction. A loss of this area could temporarily cancel the bullish structure and move the market into a deeper redistribution phase.
Brent forecast scenarios
Bullish scenario (main): the market is completing a correction within the triangle. Further growth towards 99.15 follows. A break above 101.60 on rising volumes will open potential for continued movement towards 117.86 and 136.05.
Bearish scenario (alternative): the market remains under pressure for a decline towards 89.23. If this level is broken downwards with volume confirmation, potential for a decline towards 83.63 will emerge.
Editors’ picks
 EURUSD 2026-2027 forecast: key market trends and future predictions
This article provides the EURUSD forecast for 2026 and 2027 and highlights the main factors determining the direction of the pair’s movements. We will apply technical analysis, take into account the opinions of leading experts, large banks, and financial institutions, and study AI-based forecasts. This comprehensive insight into EURUSD predictions should help investors and traders make informed decisions.
 Gold (XAUUSD) forecast 2026 and beyond: expert insights, price predictions, and analysis
Dive deep into the Gold (XAUUSD) price outlook for 2026 and beyond, combining technical analysis, expert forecasts, and key macroeconomic factors. It explains the drivers behind gold’s recent surge, explores potential scenarios including a move toward 4,500 to 5,000 USD per ounce, and highlights why the metal remains a strong hedge during global uncertainty.
Forecasts presented in this section only reflect the author’s private opinion and should not be considered as guidance for trading. RoboForex bears no responsibility for trading results based on trading recommendations described in these analytical reviews.