
Weekly technical analysis and forecast (24–28 August 2026)
In this weekly technical analysis, we examine the key chart patterns and price levels for EURUSD, USDJPY, GBPUSD, AUDUSD, USDCAD, Gold (XAUUSD), US 500, and Bitcoin (BTCUSD) to forecast market developments for the week ahead (24–28 August 2026).
Major technical levels to watch this week
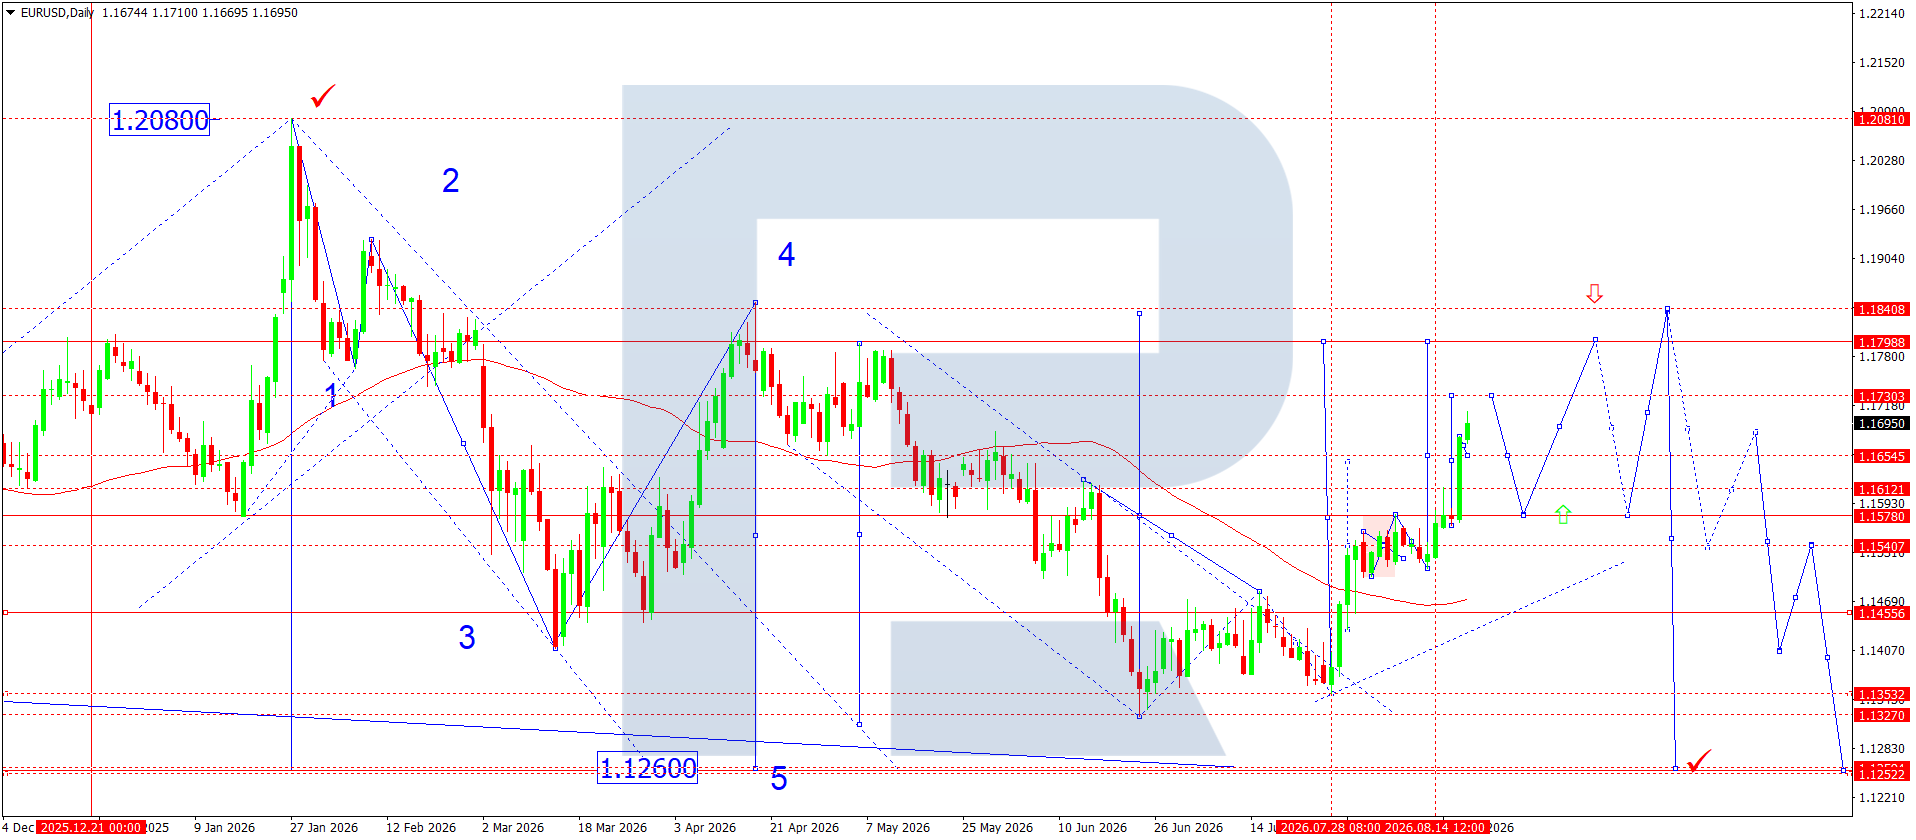
- EURUSD: Support: 1.1578, 1.1541. Resistance: 1.1730, 1.1798
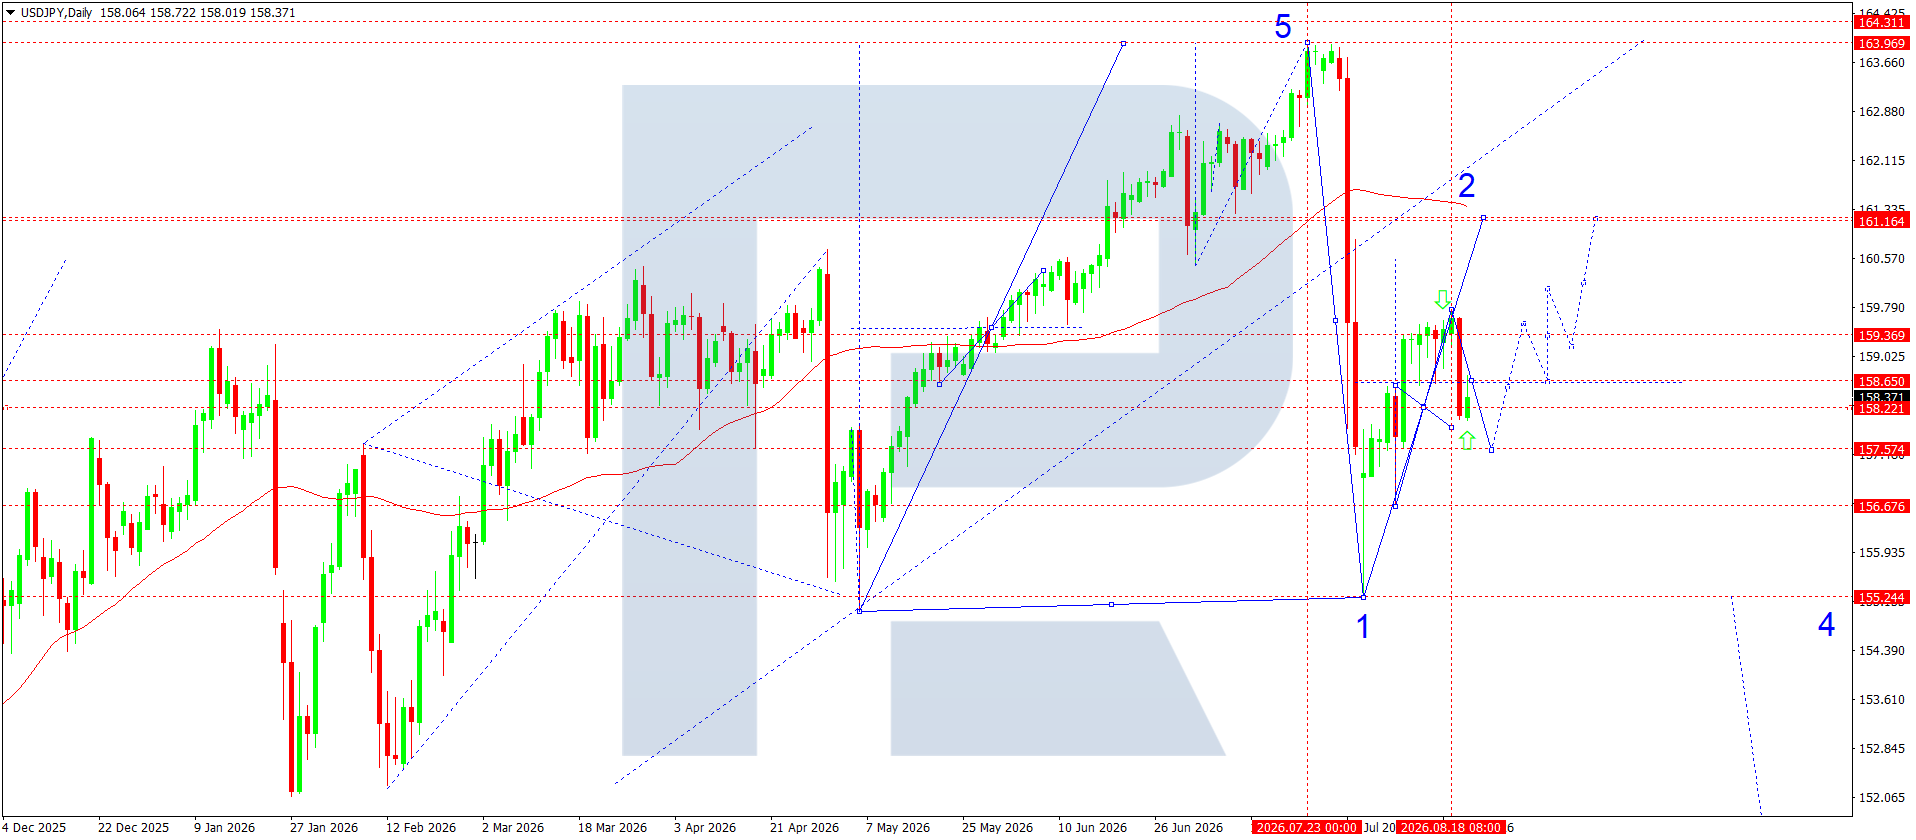
- USDJPY: Support: 158.22, 157.57. Resistance: 159.37, 161.16
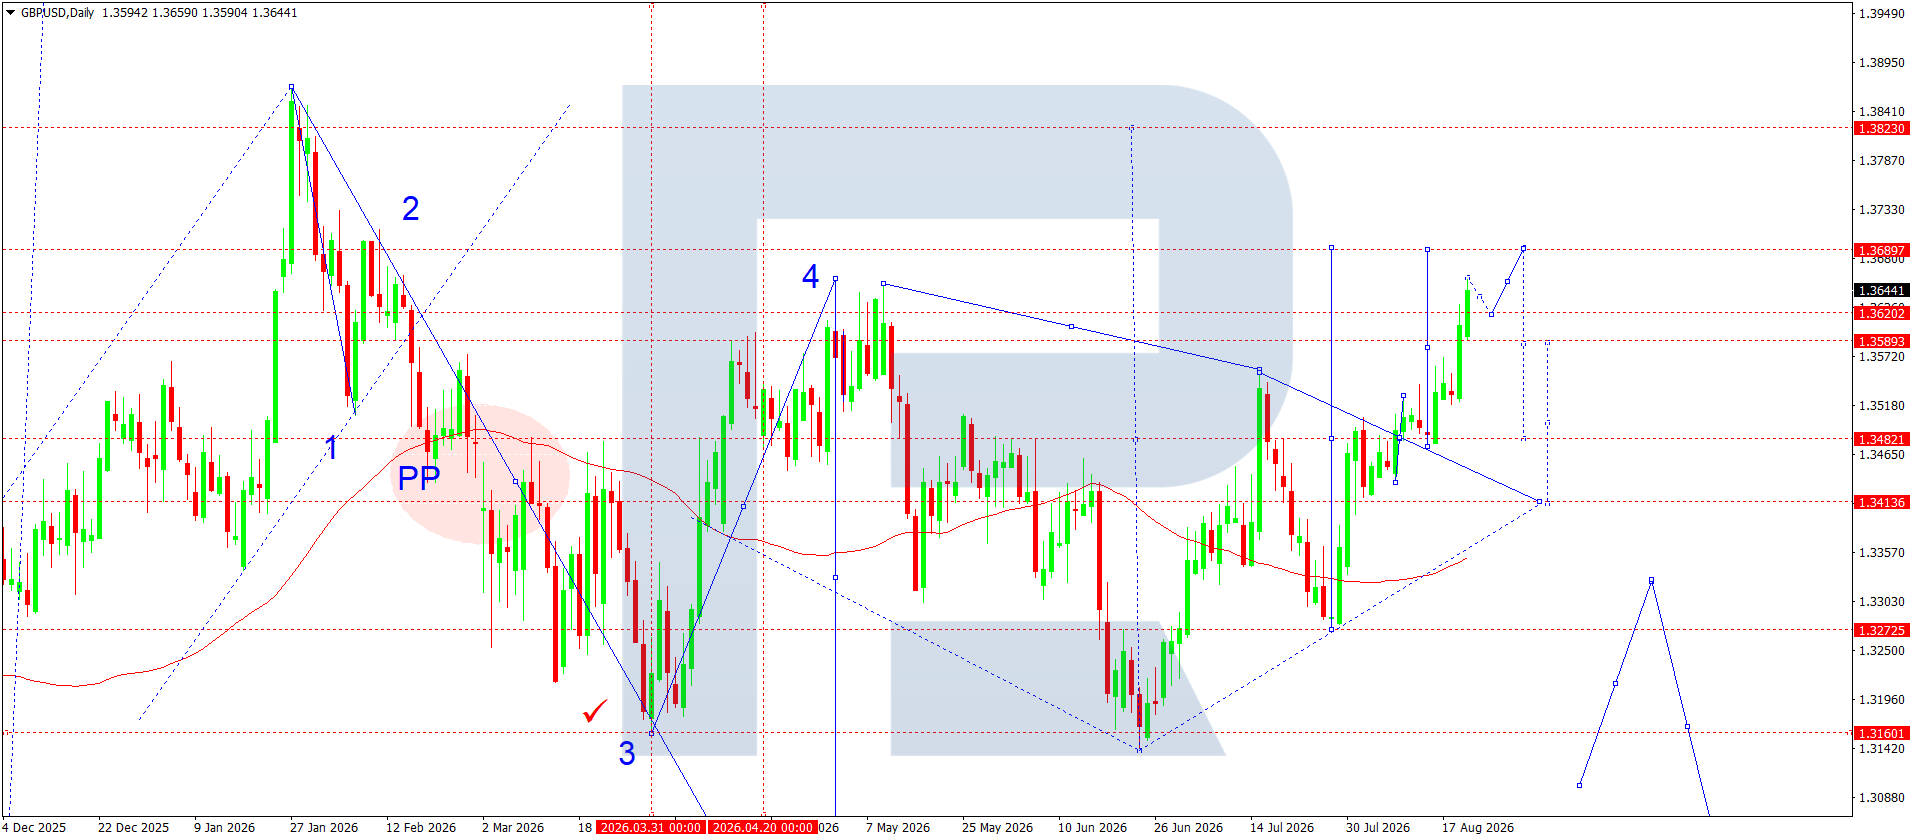
- GBPUSD: Support: 1.3589, 1.3481. Resistance: 1.3697, 1.3901
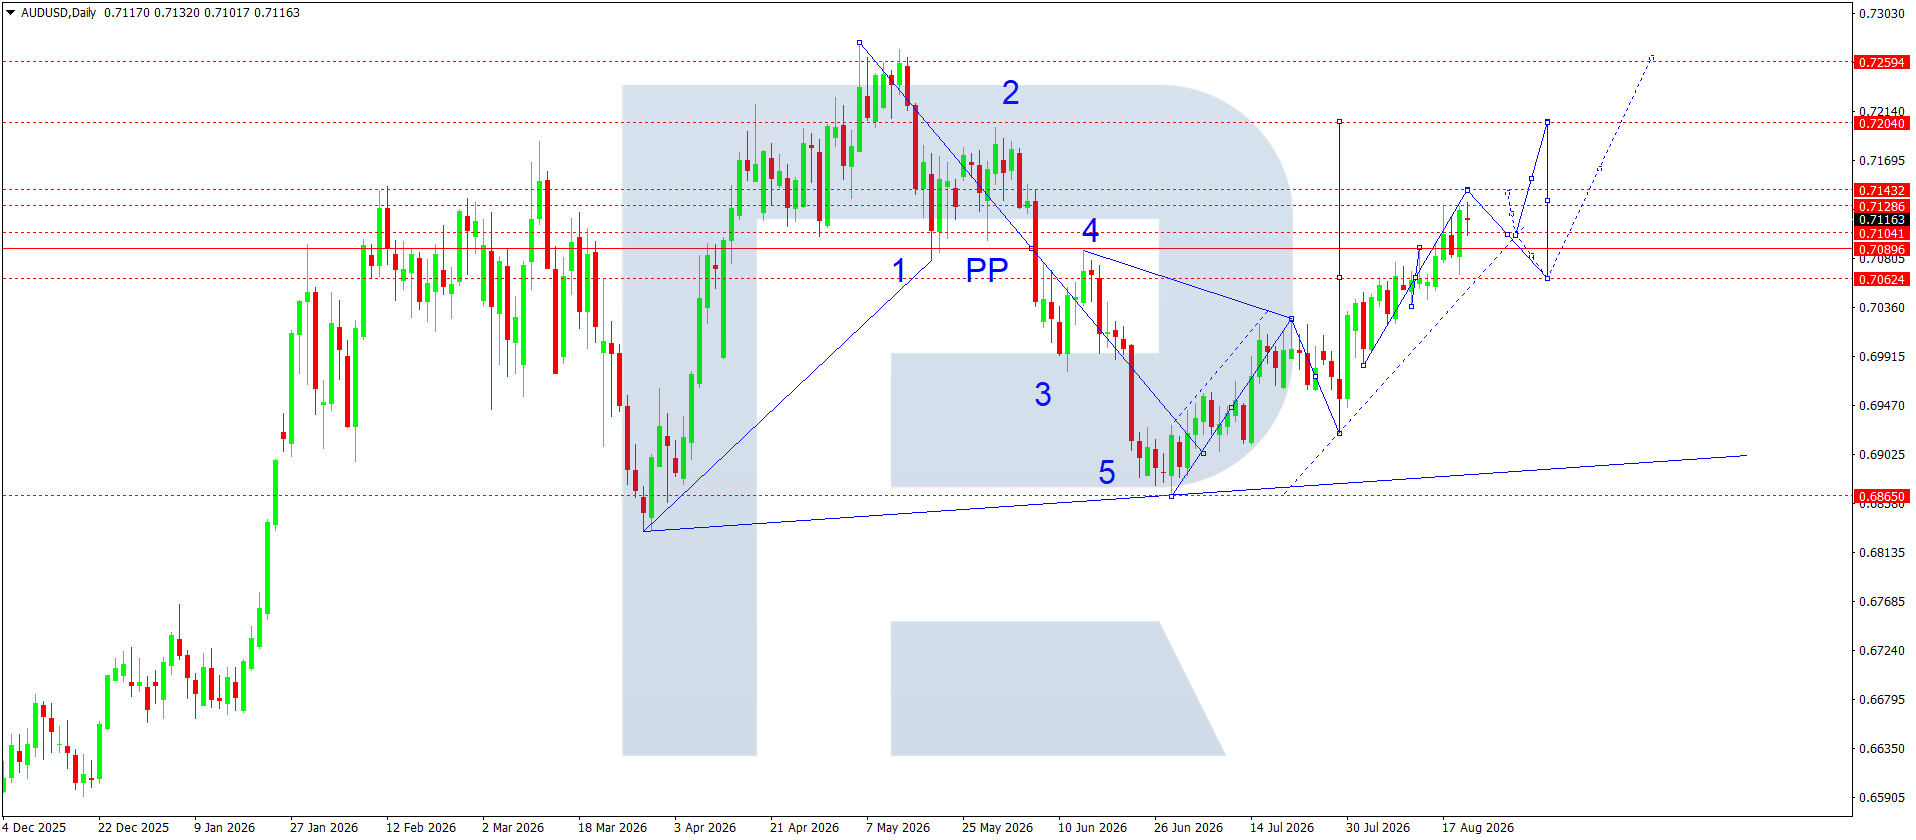
- AUDUSD: Support: 0.7090, 0.7062. Resistance: 0.7143, 0.7204
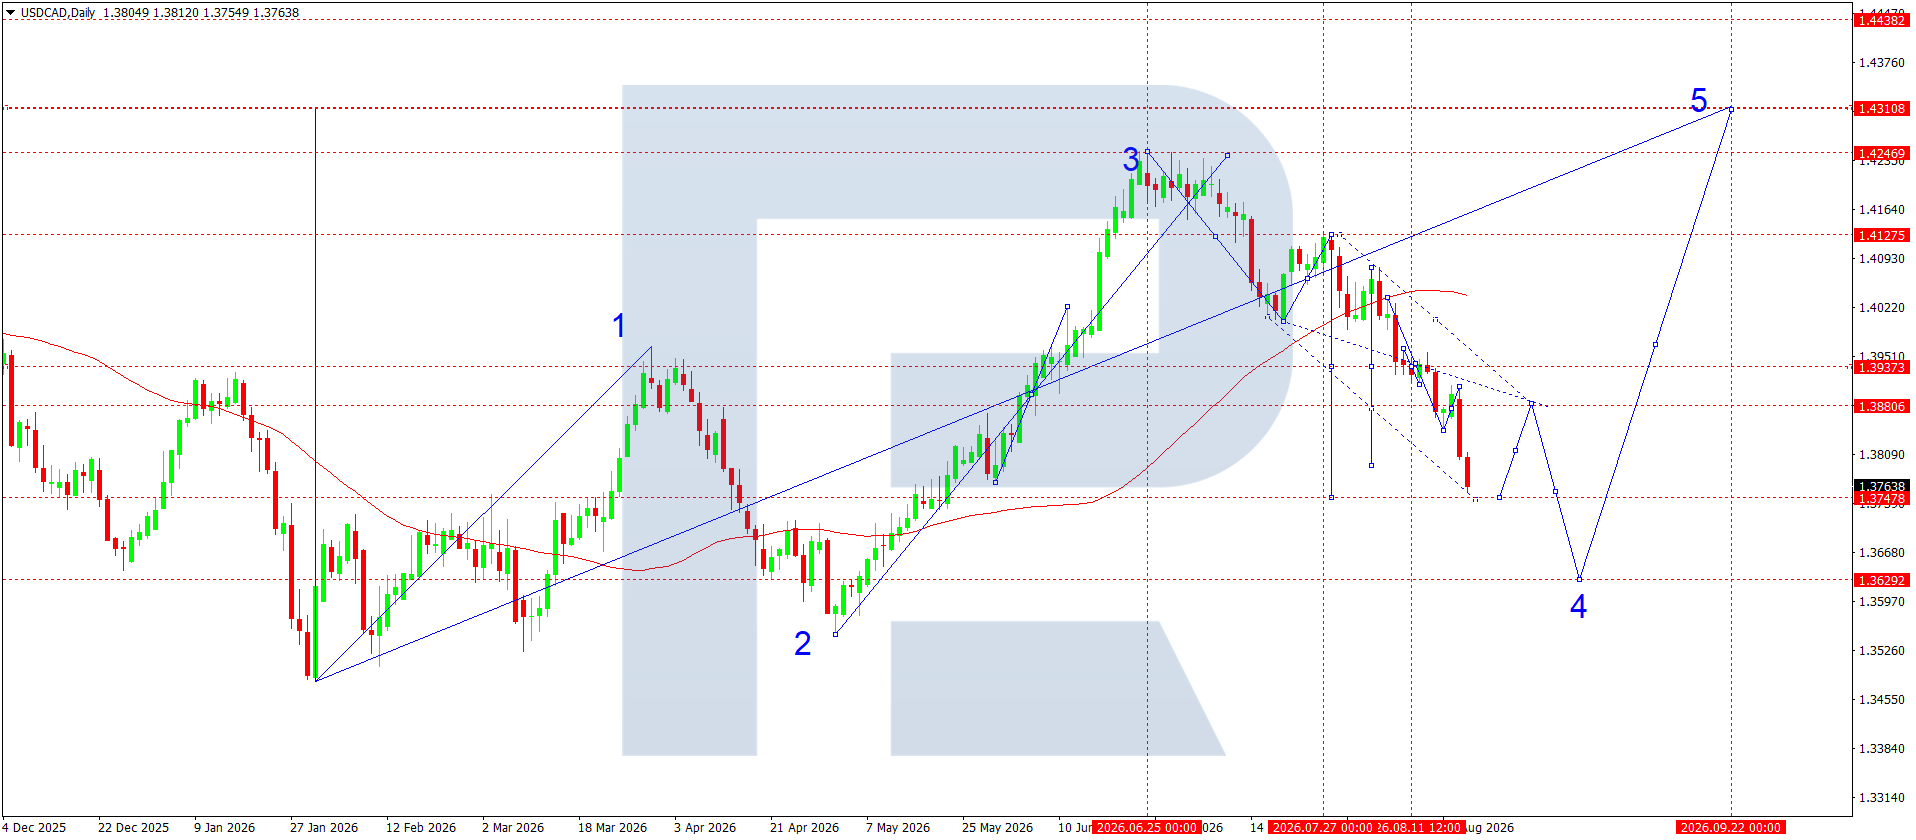
- USDCAD: Support: 1.3748, 1.3629. Resistance: 1.3881, 1.3937
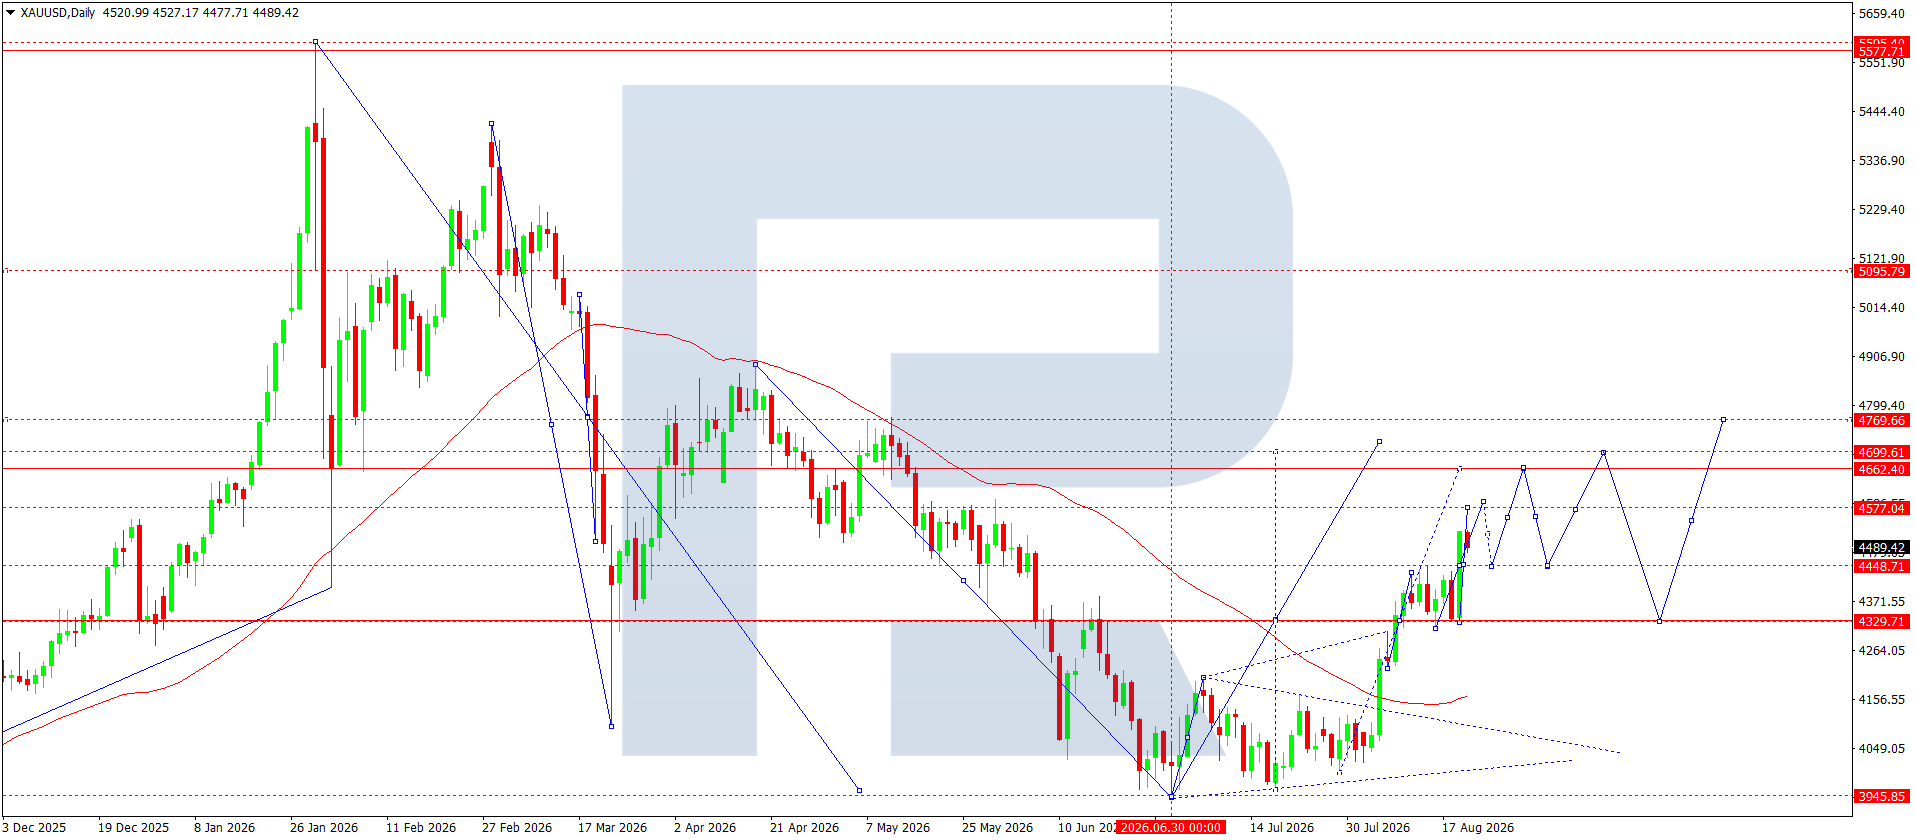
- Gold: Support: 4,448, 4,329. Resistance: 4,577, 4,662
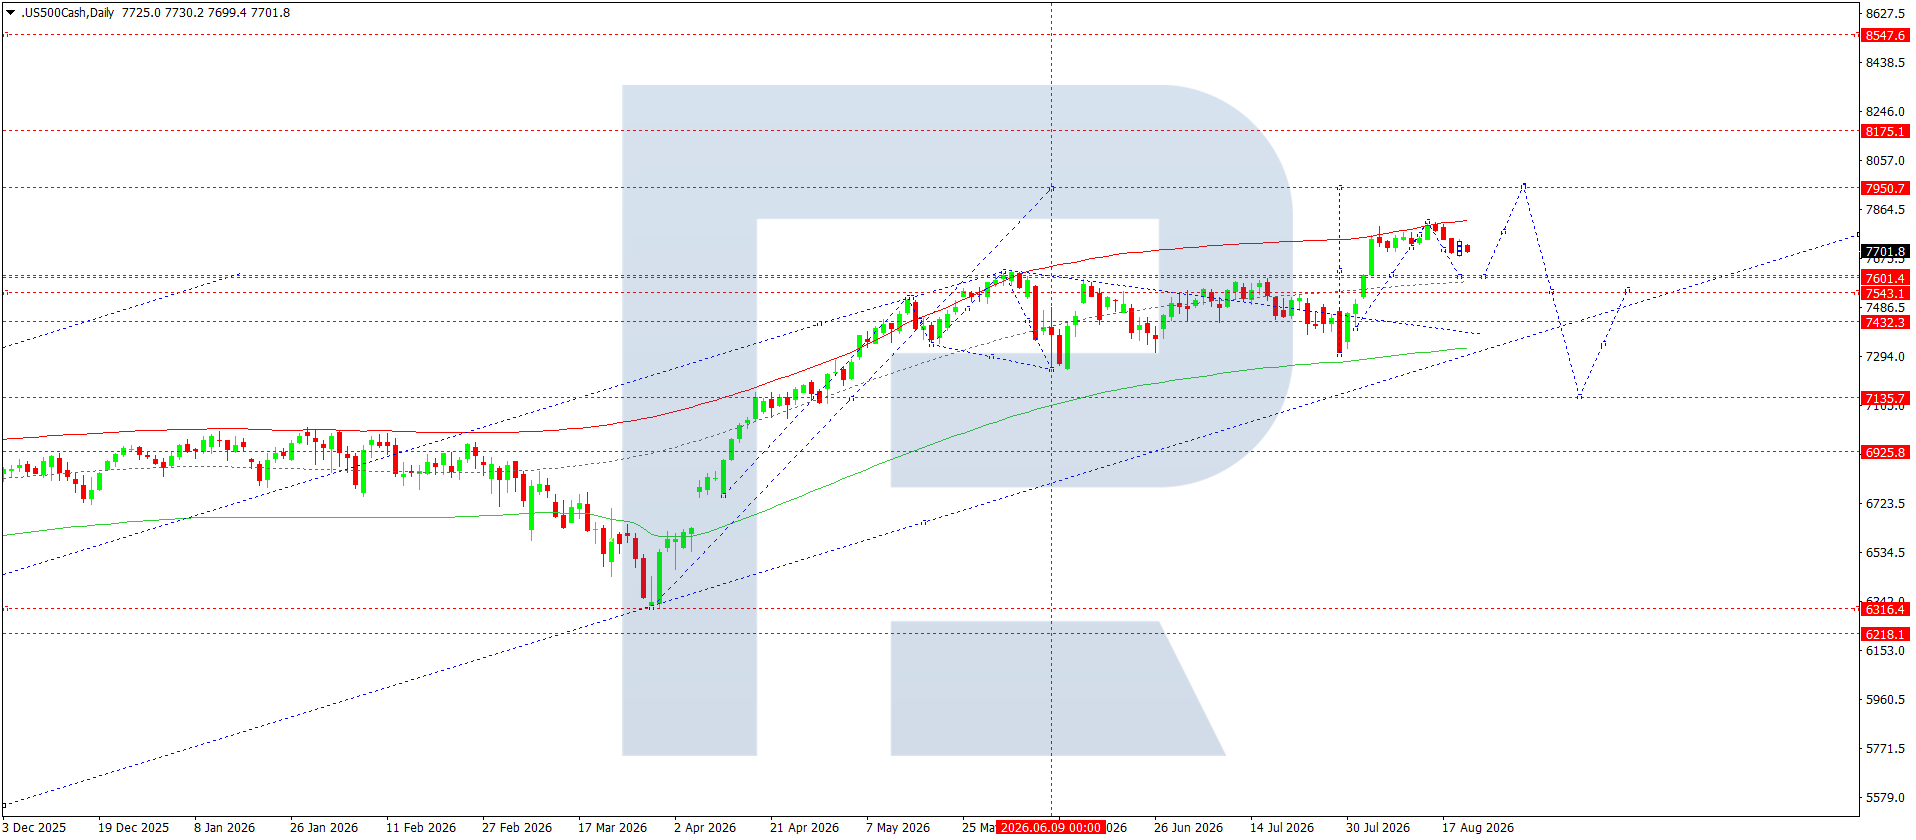
- US 500: Support: 7,739; 7,627. Resistance: 7,967; 8,175
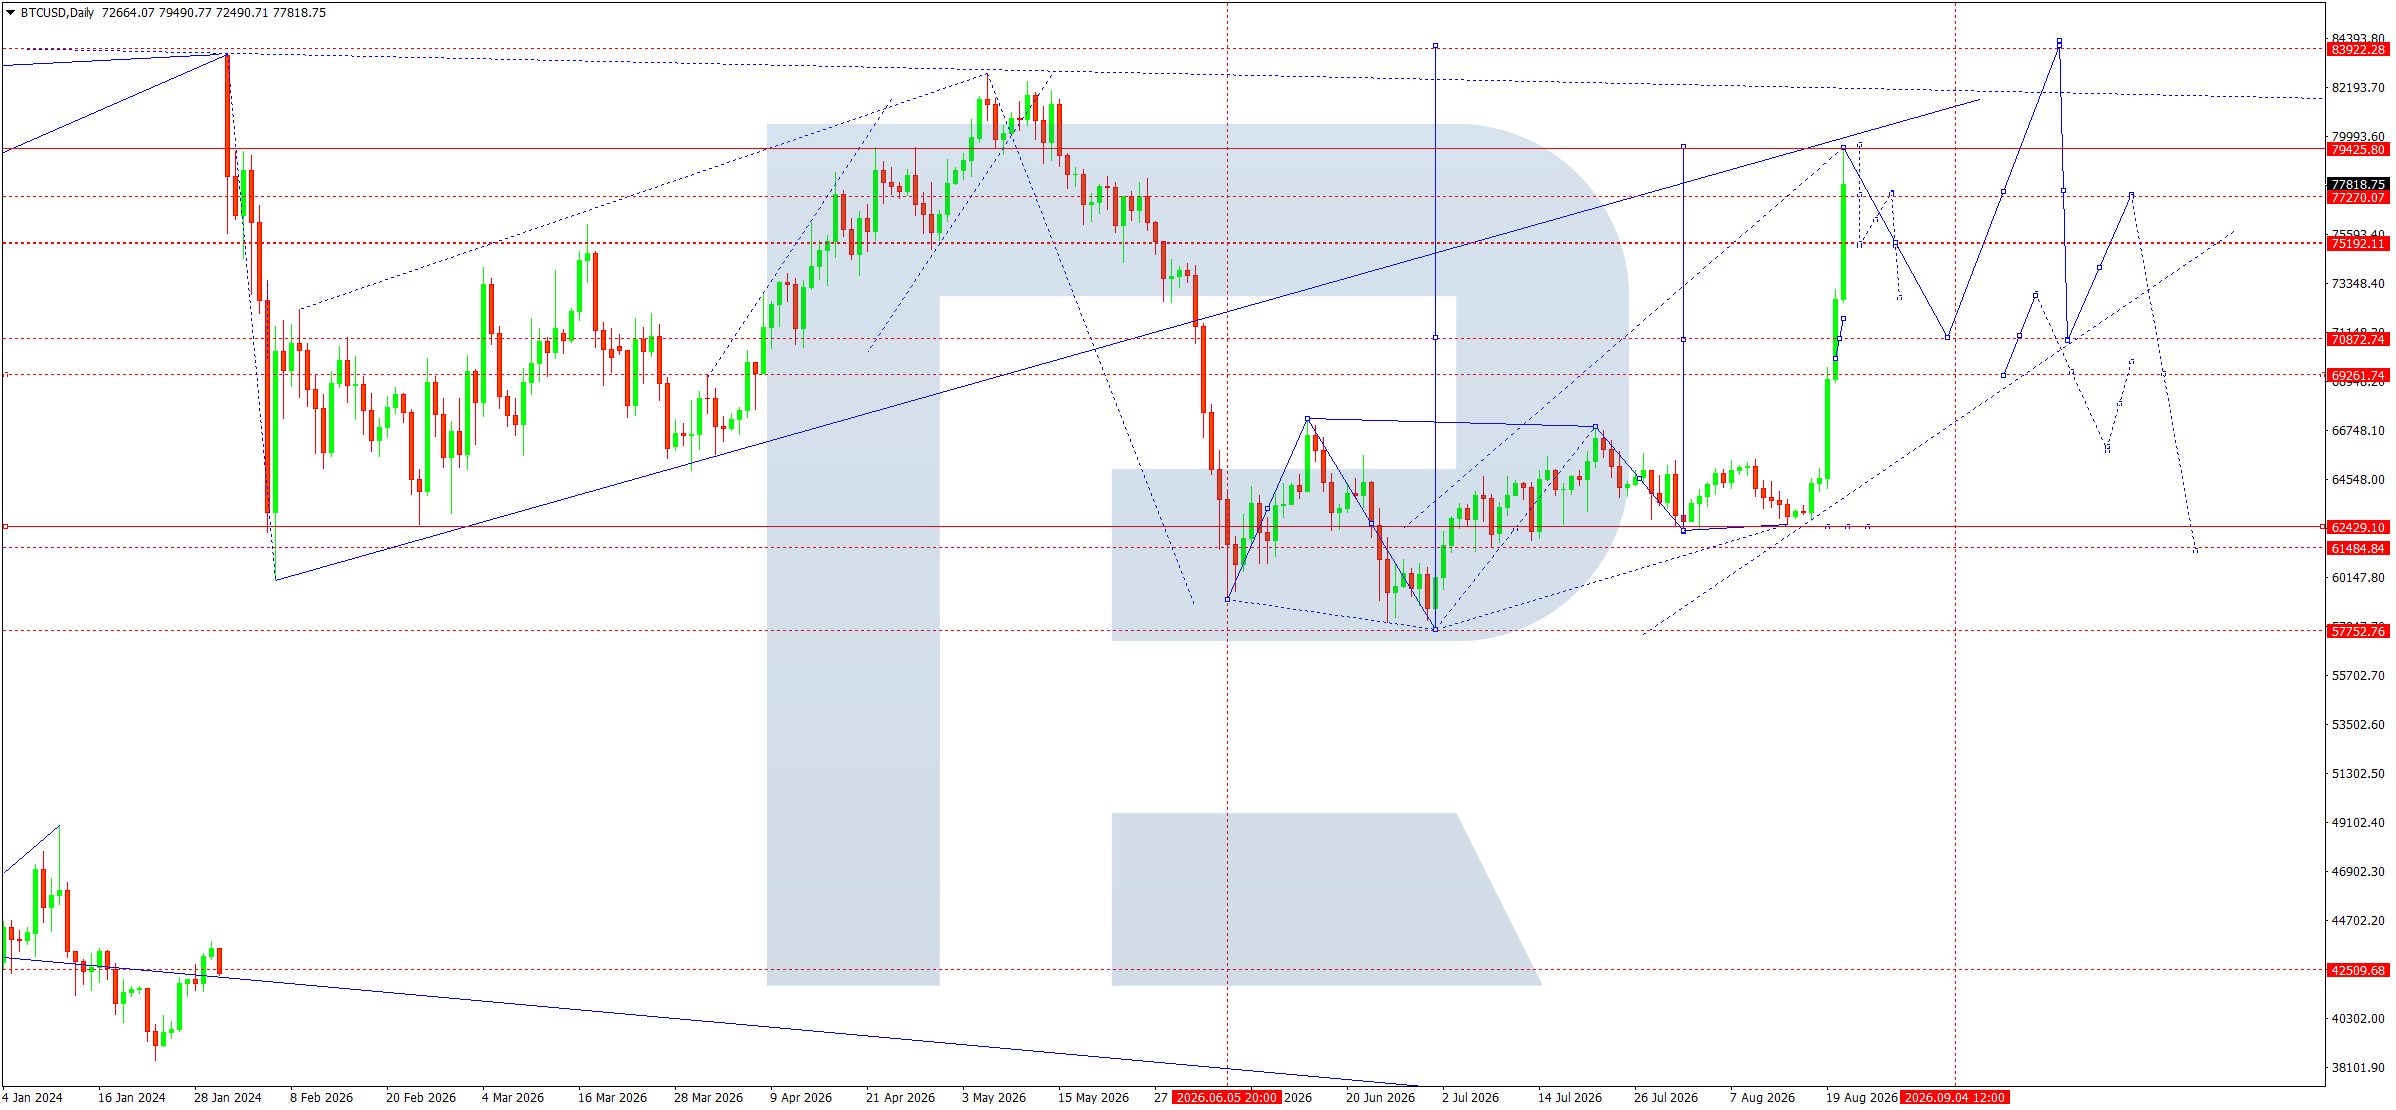
- BTCUSD: Support: 75,192; 70,928. Resistance: 79,426; 79, 993
EURUSD forecast
The fundamental backdrop for next week remains mixed, although the euro still has a short-term advantage. The US dollar came under pressure after the release of the minutes from the Federal Reserve’s July meeting: concerns over persistent inflation increased within the regulator, while several participants also supported a rate increase, even as the market as a whole reduced expectations of policy tightening in September. The Fed rate remains within the 3.5000–3.7500% range. Another factor weakening the US dollar was the US Treasury’s decision to increase buybacks of long-term bonds, which reduced yields and temporarily lowered the appeal of US dollar assets.
The euro is supported by the more hawkish stance of the European Central Bank. Eurozone inflation accelerated to 2.9000% in July, well above the 2.0000% target, leaving room for further cautious policy tightening. At the same time, rising energy costs and geopolitical tensions remain sources of risk for the European economy. The key event next week will be the Jackson Hole symposium: comments from Fed officials could quickly change rate expectations and the direction of the US dollar. In the current balance of factors, the fundamental backdrop is moderately positive for EURUSD, although the probability of sharp fluctuations remains high.
EURUSD technical analysis
On the daily EURUSD chart, the market is trading around 1.1695 after a strong upward impulse from the 1.1353–1.1456 zone. The price has consolidated above the SMA50 and restored the short-term upward structure. At the same time, the 1.1730–1.1798 area remains an important resistance zone, while 1.1841 corresponds to the upper boundary of the current corrective structure and a local target.
From an Elliott wave perspective, the broader structure remains bearish. After waves 1–4 formed within the 1.2080 to 1.1841 range, the chart allows for the development of a final fifth wave with a strategic target around 1.1252. However, before this scenario unfolds, the market may form a deeper upward correction. According to the Matrix, the most likely near-term sequence is a move towards 1.1730, a pullback to 1.1578, another rise into the 1.1798–1.1841 area, and then a reversal to the downside.
The Matrix pivot point and the 1.1578–1.1541 zone form the nearest support area. As long as the price remains above this zone, the corrective growth scenario remains valid. A breakout below 1.1541 would increase the probability of a move towards 1.1456 and then 1.1353. Below 1.1353, there would be room for the fifth wave to develop towards the final target at 1.1252. MACD and Stochastic, after recovering, allow for further short-term growth, but approaching 1.1798–1.1841 increases the risk of a reversal pattern forming.
EURUSD forecast scenarios
Bullish (base case): holding 1.1578 would allow the corrective rise to continue. A breakout above 1.1730 would open the potential for a move towards 1.1798 and then 1.1841.
Bearish (alternative): after a rise towards 1.1798–1.1841, the market encounters resistance and begins the fifth downward wave. A breakout below 1.1541 would open the way to 1.1456 and 1.1353, followed by 1.1252.
USDJPY forecast
The fundamental backdrop for USDJPY next week is shaped by opposing signals from the US and Japan. In Japan, expectations of further policy tightening are increasing: July inflation is expected to show an acceleration in core CPI, while foreign trade data released on 20 August showed exports rising by 23.2% year-on-year. Imports also increased by 27.8%, mainly due to expensive energy. Strong exports and persistent price pressure are supporting expectations that the Bank of Japan may raise rates as early as September. Reuters estimates the probability of such a move at around 80%.
In the US, the situation is less clear. An additional risk for the yen comes from the possibility of renewed currency intervention: following joint US-Japan action in early August, authorities remain highly attentive to sharp exchange-rate movements and the 160 level. The 160 level remains an especially important psychological barrier. Minutes from the latest Federal Reserve meeting showed continued concern about inflation, although the market continues to price in a softer policy path amid a cooling labour market. Another factor was the US Treasury’s decision to increase buybacks of long-dated bonds, which initially lowered Treasury yields and put pressure on the US dollar. The main event next week will be the Jackson Hole symposium on 27–29 August, where investors will look for signals regarding the Fed’s September decision.
USDJPY technical analysis
On the daily USDJPY chart, a pronounced downward move began after the fifth wave formed around 163.97–164.31. The first corrective wave ended near 155.24, after which the market formed an upward second wave towards the 161.16 area. A new decline followed from this zone, preserving the probability of a third wave developing to the downside.
The current price around 158.37 is below the SMA50, while the moving average itself is sloping downwards. This reinforces the bearish nature of the short-term structure. The nearest directional zone lies between 158.65 and 158.22. A move below 158.22 would confirm selling pressure and open the way to 157.57. If the downward structure continues, the next target would be 156.68, while a deeper correction could return the market to 155.24.
At the same time, the chart shows an attempt to form a local base around 158.20–158.40. A return above the Matrix pivot point at 158.65 would be the first sign that the bearish scenario is weakening. Consolidation above 159.37 would allow a recovery towards 161.16 to be considered, where the key resistance zone and the SMA50 area are located. Only a sustained breakout above 161.16 would be able to change the current corrective structure and return the market towards 163.97.
USDJPY forecast scenarios
Bullish (alternative): a breakout above 158.65 and consolidation above 159.37 would open the way to 161.16. Consolidation above this level would increase the probability of a continued recovery towards 163.97.
Bearish (base case): if the market breaks below 158.22, we expect the third downward wave to continue towards 157.57, followed by a test of 156.68.
GBPUSD forecast
The fundamental backdrop for the pound next week remains moderately positive. UK inflation accelerated to 2.9000% in July from 2.6000% a month earlier, once again increasing market attention on the Bank of England’s future policy. However, the increase in inflation was largely driven by higher energy prices, meaning the regulator must take both inflation risks and signs of labour-market weakness into account.
The pound is also supported by the continued resilience of the UK economy. GDP grew by 0.4000% in the second quarter, while BoE Chief Economist Huw Pill noted that current economic momentum continues to support the case for tighter monetary policy. At the same time, wage growth is slowing and the number of vacancies has fallen to its lowest level in around five years, leaving limited scope for further rate increases.
The US dollar is becoming the main external factor for GBPUSD. On 20 August, the US currency came under pressure after the US Treasury decided to increase buybacks of long-term bonds. Another catalyst next week will be the Jackson Hole symposium on 27–29 August, where markets will look for signals on the Federal Reserve’s future policy. The preliminary US GDP data and the PCE indicator on 26 August will also be important.
GBPUSD technical analysis
On the daily GBPUSD chart, the upward structure remains intact after the fifth downward wave formed around 1.3146. The subsequent movement produced an upward impulse, while the current wave count suggests the development of a new bullish sequence.
The key technical development was consolidation above the 1.3481–1.3589 zone. After moving through 1.3589, the market approached the first significant target at 1.3697. With the current price around 1.3631, the structure remains constructive for buyers.
According to the Elliott wave count shown, the move from the 1.3273 area can be viewed as the beginning of a new upward wave. Completion of the local first wave around 1.3697 and the subsequent correction formed a base for the development of the third wave. Therefore, a breakout above 1.3697 would open the way to 1.3901. If the impulse is sustained, the next strategic target would be 1.4036.
The 1.3589 level is now particularly important as the nearest support area and a potential pivot point for the local structure. As long as the price remains above this level, buyers retain the advantage. The SMA50, which continues to turn upwards, provides additional support.
GBPUSD forecast scenarios
Bearish (alternative): a return below 1.3589 would form a local correction. A breakout below 1.3481 would increase selling pressure and create conditions for a move towards 1.3402.
Bullish (base case): consolidation above 1.3697 would confirm continuation of the third upward wave, targeting 1.3901. A breakout above 1.3901 would open the way to 1.4036.
AUDUSD forecast
The fundamental backdrop for AUDUSD next week remains mixed. The Reserve Bank of Australia kept the interest rate unchanged at 4.3500% on 11 August, while indicating that further tightening remains possible if inflation risks increase. However, the labour market report released on 20 August was weaker than expected: employment fell by 15.8000 thousand in July, while unemployment rose to 4.5000%. This reduces the probability of a near-term rate increase and limits the Australian dollar’s upside potential. The key event of the week will be the release of Australian CPI data on 26 August, while the minutes of the RBA’s August meeting will be published on 25 August. The US dollar outlook is also mixed: Fed minutes showed substantial discussion of a possible rate increase, although weak employment and inflation data are limiting tightening expectations. Further volatility may be triggered by the Federal Reserve Chairman’s speech at the Jackson Hole Symposium on 28 August. As a result, AUDUSD direction will depend on the combination of Australian inflation data and expectations for Fed policy.
AUDUSD technical analysis
On the daily AUDUSD chart, the upward structure remains intact after the fifth wave formed around 0.6865. The subsequent recovery produced a sequence of higher local lows, while the price consolidated above the Matrix pivot point at 0.7090. This keeps buyers in control despite the current consolidation after reaching 0.7143.
The nearest resistance area lies within the 0.7129–0.7143 range. A breakout above 0.7143 would confirm continuation of the local upward movement and open the way to 0.7204. On the chart, this zone is viewed as the nearest projected target for the next impulse. If the structure continues to develop and positive momentum persists, a move towards the main target at 0.7259 is possible.
At the same time, the current configuration allows for a corrective decline. After testing 0.7143, the market may pull back towards 0.7104 and then the 0.7090 pivot point. A deeper correction could take the price towards 0.7062. This level is an important boundary between preserving the bullish structure and developing a deeper correction. Holding 0.7062 would allow the decline to be treated as a corrective wave followed by renewed growth. A breakout below 0.7062, by contrast, would increase the probability of a move towards the lower part of the established range.
Given the Elliott wave structure, the base case remains a continuation of the upward move after a local correction. The technical picture would be fully confirmed by a move above 0.7143.
A new local low forming above 0.7090 would provide additional confirmation of buyers’ strength. In this case, the corrective phase would be limited and the probability of testing 0.7204 would increase. A decline below 0.7062 would change the short-term balance.
AUDUSD forecast scenarios
Bullish (base case): holding 0.7090 and breaking above 0.7143 would open the way to 0.7204 and then 0.7259.
Bearish (alternative): failure to rise above 0.7143 followed by a breakout below 0.7062 would form a correction, with a risk of further decline.
USDCAD forecast
The fundamental backdrop for USDCAD next week remains mixed, although the short-term advantage is gradually shifting towards the Canadian dollar. The main factor is US trade policy. Washington and Ottawa have made preliminary progress in negotiations, after which the introduction of new 50.0000% tariffs on Canadian goods was postponed. Continued negotiations reduce immediate risks to the Canadian economy and support the CAD. However, the final terms of the agreement have not yet been determined, so the tariff issue will continue to create elevated volatility.
The inflation picture provides additional support to the Canadian dollar. Canada’s inflation accelerated to 3.0000% in July, limiting the Bank of Canada’s ability to ease policy quickly. At the same time, core indicators remain considerably more subdued, allowing the regulator to maintain a wait-and-see stance. The next BoC meeting will take place on 2 September, so during the week of 24–28 August the market will mainly reassess expectations for future policy.
The US dollar outlook is also mixed. The US Federal Reserve (Fed) has maintained a hawkish tone: the July meeting minutes showed growing concern over persistent inflation, while weak economic data at the same time limit the scope for further tightening. An important event next week will be the release of the second estimate of US Q2 GDP on 26 August. The initial estimate showed economic growth of 1.5000%.
USDCAD technical analysis
On the daily USDCAD chart, a pronounced corrective structure remains in place after the third wave formed around 1.4246. The current price is near 1.3764, below the 1.3881 area and below the descending short-term resistance zone. This indicates that selling pressure remains in place.
From an Elliott wave perspective, the current section is viewed as the fourth corrective wave within a broader upward structure. The base-case projection assumes that the decline will end around 1.3629. This level is the key area for the completion of the correction. The price position relative to the SMA50 provides additional confirmation: the market remains below the moving average, preserving the sellers’ short-term advantage.
The nearest resistance remains at 1.3881. A recovery above it would be the first sign that the downward impulse is weakening. The next level is 1.3937. A breakout above this level would allow a stronger recovery towards 1.4128 and then 1.4246 to be considered.
If selling pressure persists, the market may first test 1.3748 and then move towards the main target of the fourth wave at 1.3629. Once the correction is complete, the chart suggests the development of a fifth upward wave with a main strategic target at 1.4311. Therefore, the current weakness in USDCAD does not yet contradict the medium-term upward structure and is instead viewed as a potential phase in the formation of a reversal point.
USDCAD forecast scenarios
Bullish (base case): after testing 1.3748, the market holds support and returns above 1.3881. A breakout above 1.3937 would open the way to 1.4128, while the potential for a fifth upward wave towards 1.4311 would remain intact.
Bearish (alternative): a breakout below 1.3748 would deepen the correction and increase the probability of a move towards 1.3629. Consolidation below this level would call the current wave count into question.
XAUUSD forecast
The fundamental backdrop for gold next week remains mixed. On the one hand, gold continues to receive support from geopolitical uncertainty, strong demand for safe-haven assets, and expectations surrounding the future path of interest rates. On the other hand, rising oil prices are increasing inflation risks and may limit expectations of US monetary policy easing. The latest Federal Reserve meeting minutes showed a fairly hawkish stance: three officials supported raising rates at the July meeting, while the rate was kept within the 3.50–3.75% range.
Another key factor will be the Jackson Hole symposium on 27–29 August. The market will closely assess signals from Fed officials regarding the future path of interest rates. At the same time, tensions surrounding the conflict in the Middle East remain elevated, supporting demand for safe-haven assets and keeping oil prices at high levels.
XAUUSD technical analysis
On the daily XAUUSD chart, an upward structure formed after the low around 3,945. A key element of the current pattern is the price holding above 4,329.71, which now acts as the nearest strategic support. The current price around 4,489 remains above this level, preserving the positive structure.
The most important pivot point in the current matrix is the 4,447–4,448 area. After the price moved above this zone, a consolidation formed that may provide the base for the next impulse. As long as the price remains above 4,448, continuation of the upward structure remains the priority.
The nearest target is 4,577.04. Consolidation above this resistance would open the way to 4,662.40, while a subsequent breakout of this zone would allow a move towards 4,699.61–4,799.66 to be considered. The chart also shows a sequence of local waves alternating between impulses and corrections, so each new resistance level may be followed by a pullback.
It is also worth noting that after the sharp rise, gold entered a phase of heightened volatility. On 20 August, the metal corrected after the previous strong advance as the market took profits. At the same time, strong US jobless claims data indicate that the US labour market remains resilient, limiting the potential for a rapid reduction in Fed interest rates.
XAUUSD forecast scenarios
Bullish (base case): holding above 4,448 would provide a base for a move towards 4,577. After a possible correction, a rise towards 4,662–4,699 is expected. If the price consolidates further above 4,699, the next target would be 4,799.
Bearish (alternative): a breakout below 4,448 would increase the probability of a return towards 4,329. A breakout below 4,329 would strengthen the corrective structure, with a potential move towards the 4,200–4,050 area.
US 500 forecast
The fundamental backdrop for next week centres on shifting expectations for US monetary policy, conditions in the bond market, and results from major technology companies. The latest minutes from the US Federal Reserve (Fed) showed a noticeably more hawkish stance: several participants supported a rate increase at the July meeting, while inflation risks remain significant. At the same time, rising Treasury yields and tensions in the Middle East are increasing pressure on equities. The key events of the week will be the release of US Q2 GDP data and the July PCE index on 26 August, as well as Nvidia’s earnings report. The Jackson Hole symposium on 27–29 August could add further volatility as the market looks for signals about the future path of interest rates.
US 500 technical analysis
On the daily US 500 chart, the medium-term upward structure remains intact after the reversal from the 6,316–6,218 zone. The subsequent impulse formed a sequence of higher highs and higher lows, while the July–August movement developed into a broad consolidation. After reaching the 7,950 area, the market formed a corrective wave towards 7,432, followed by a new upward impulse. The price is now around 7,701.8, above the nearest support zone at 7,601–7,543, but still below the main resistance at 7,950.
From a wave-structure perspective, the current rise can be viewed as a local continuation of an upward wave within a broader correction. Holding 7,601 preserves the possibility of another test of 7,950. A breakout above 7,950 would open the way to 8,175, while consolidation above this level would indicate the restoration of a full medium-term impulse. The 7,950 area therefore remains the key pivot for the near term, as it marks both the upper boundary of the current range and the zone of the previous high.
Alternatively, failure to consolidate above 7,700–7,800 followed by a move below 7,601 would increase corrective pressure. A breakout below 7,543 would raise the probability of a move towards 7,432, while losing that level could extend the correction towards 7,135. A long-term ascending channel is also visible on the chart, so a decline towards 7,135 should still be treated as a deep correction rather than an automatic reversal of the medium-term trend. The combination of high technology-sector valuations, rising yields, and Fed expectations makes the 7,950 area particularly important in determining the next impulse. Corporate earnings remain another factor: sustained profit growth supports demand for equities, but elevated valuations make the index more sensitive to disappointment. The market’s reaction to Nvidia may therefore become the catalyst for a breakout of one of the key levels.
US 500 forecast scenarios
Bullish (base case): holding 7,601 and returning above 7,700 would preserve the potential for growth towards 7,950. A breakout above 7,950 would open the way to 8,175.
Bearish (alternative): a move below 7,601 and then 7,543 would strengthen the correction, targeting 7,432. If 7,432 is broken, the next target would be 7,135.
BTCUSD forecast
The fundamental backdrop for Bitcoin has improved noticeably ahead of next week. Over the current week, BTC has recovered sharply and returned to the 77,000–78,000 USD area. The rise has been supported by a weaker US dollar, improved liquidity, and renewed institutional demand: on 19 August, US spot Bitcoin ETFs recorded around 517 million USD in net inflows. Further progress in US cryptocurrency regulation remains another supportive factor, reducing regulatory uncertainty. At the same time, the market remains sensitive to US monetary policy. Federal Reserve minutes released this week showed that some policymakers are open to higher interest rates if inflation remains persistent. Additional support came from US Treasury plans to increase purchases of long-term bonds, which market participants interpreted as improving liquidity and putting pressure on the US dollar. However, the rally remains dependent on risk appetite.
BTCUSD technical analysis
On the daily BTCUSD chart, after a prolonged consolidation around 62,400–65,000, the market formed a strong upward wave. The key development was a breakout from the local structure and a successive move through 69,261 and 70,927. The price then accelerated and reached 79,490, coming very close to the main resistance zone of 79,425–79,993.
From a wave-structure perspective, the current impulse can be viewed as the development of an upward wave following the completion of a corrective phase in the 57,752–62,429 area. The chart has formed a series of higher local lows, while the price has broken above the previous resistance line. This confirms a shift in short-term momentum in favour of buyers.
However, the 79,400–80,000 area is a crucial test zone for the current impulse. Important horizontal resistance lies here, followed by a potential target around 83,922. If buyers can consolidate above 80,000, the structure will confirm continuation of the upward wave, with potential to move towards 83,922 and then the 84,000 area.
Alternatively, failure to consolidate above 79,400–80,000 may lead to a correction. The first pullback zone would be 75,192, followed by 70,927. Holding above 70,927 would keep the bullish structure intact; a move below this level would increase the probability of a deeper correction towards 69,261 and then 62,429.
BTCUSD forecast scenarios
Bearish (base case): the market has reached the 79,400–80,000 zone and may move into consolidation. A downside breakout would open the potential for a decline towards 75,192 and 70,927.
Bullish (alternative): a breakout and consolidation above 79,993 would confirm continued growth, with the potential to move towards 83,922.
Editors’ picks
 EURUSD forecast 2026–2027: technical analysis, price levels & predictions
EURUSD has pulled back from the 2026 high of 1.1915 and is now trading near 1.1450 — below both EMA65 and EMA200 — with the active scenario shifting from bullish to bearish. The ECB raised rates to 2.40%, but the Fed holds at 3.75%, and US inflation (3.5%) continues to outpace the eurozone (2.8%). A confirmed break below 1.1280 opens the next downward wave toward 1.1080. We break down the key levels, three trading scenarios with entry triggers, and what Deutsche Bank, Morgan Stanley and UBS are forecasting for EURUSD in 2026.
 Gold (XAUUSD) forecast 2026: predictions based on fundamental and technical analysis
Gold has corrected over 25% from its all-time high of 5,597 USD and is now trading near 4,100 USD — testing a critical support zone. Is this the bottom, or will the downtrend continue? We break down the key levels (support 3,920 USD, breakout trigger 4,500 USD), three trading scenarios with entry levels, and what J.P. Morgan, Goldman Sachs and Deutsche Bank are forecasting for gold in 2026.
Forecasts presented in this section only reflect the author’s private opinion and should not be considered as guidance for trading. RoboForex bears no responsibility for trading results based on trading recommendations described in these analytical reviews.