
Weekly technical analysis and forecast (14–18 September 2026)
In this weekly technical analysis, we examine the key chart patterns and price levels for EURUSD, USDJPY, GBPUSD, AUDUSD, USDCAD, Gold (XAUUSD), US 500, and Bitcoin (BTCUSD) to forecast market developments for the week ahead (14–18 September 2026).
Major technical levels to watch this week
- EURUSD: Support: 1.1594, 1.1538. Resistance: 1.1623, 1.1653
- USDJPY: Support: 153.82, 152.89. Resistance: 154.81, 160.37
- GBPUSD: Support: 1.3475, 1.3464. Resistance: 1.3521, 1.3567
- AUDUSD: Support: 0.7143, 0.7048. Resistance: 0.7188, 0.7238
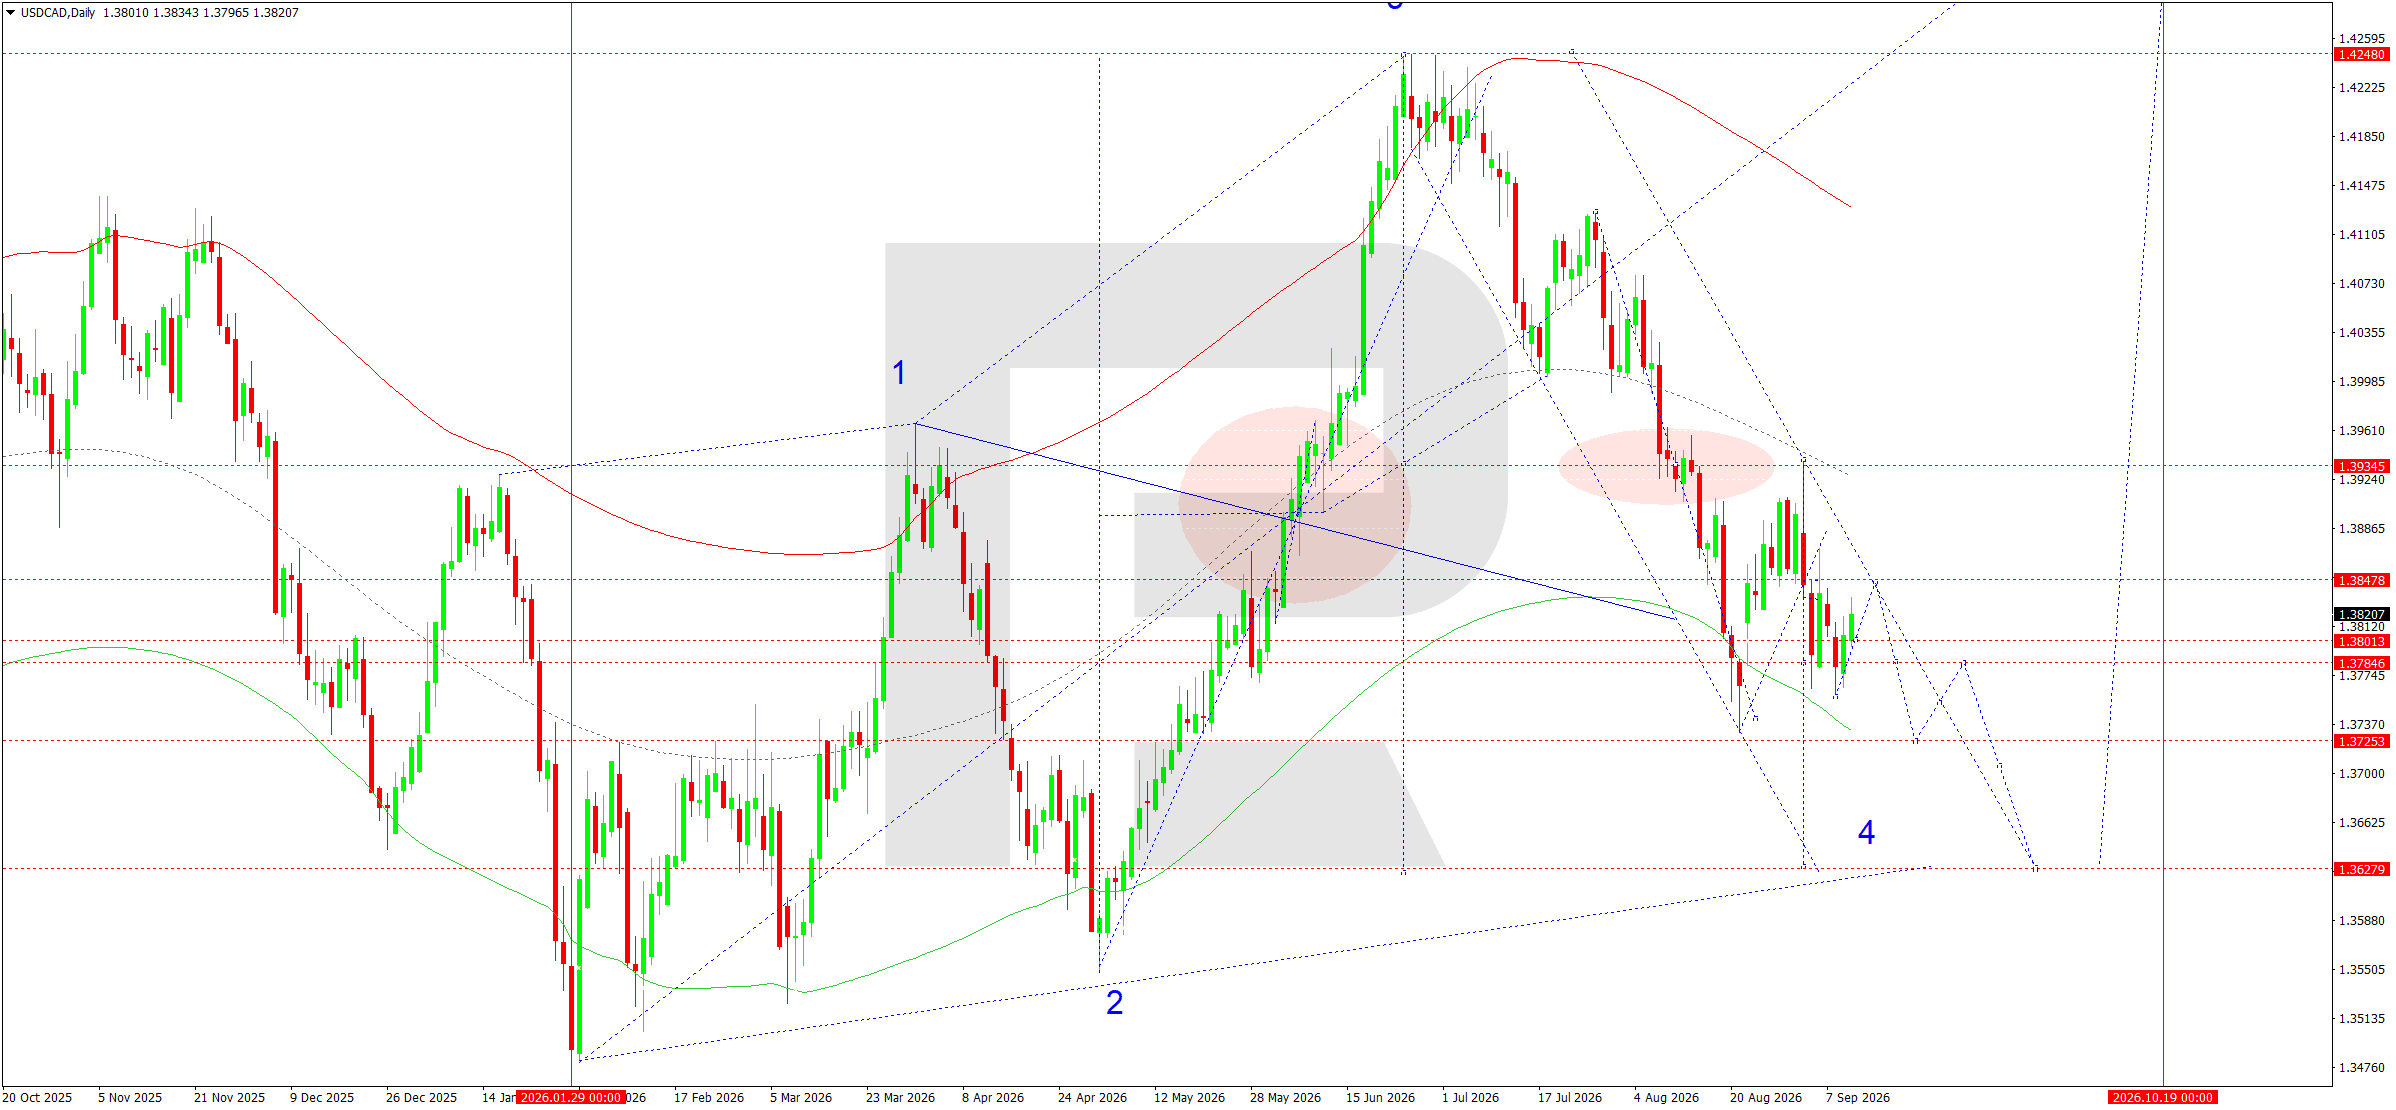
- USDCAD: Support: 1.3785, 1.3725. Resistance: 1.3848, 1.3935
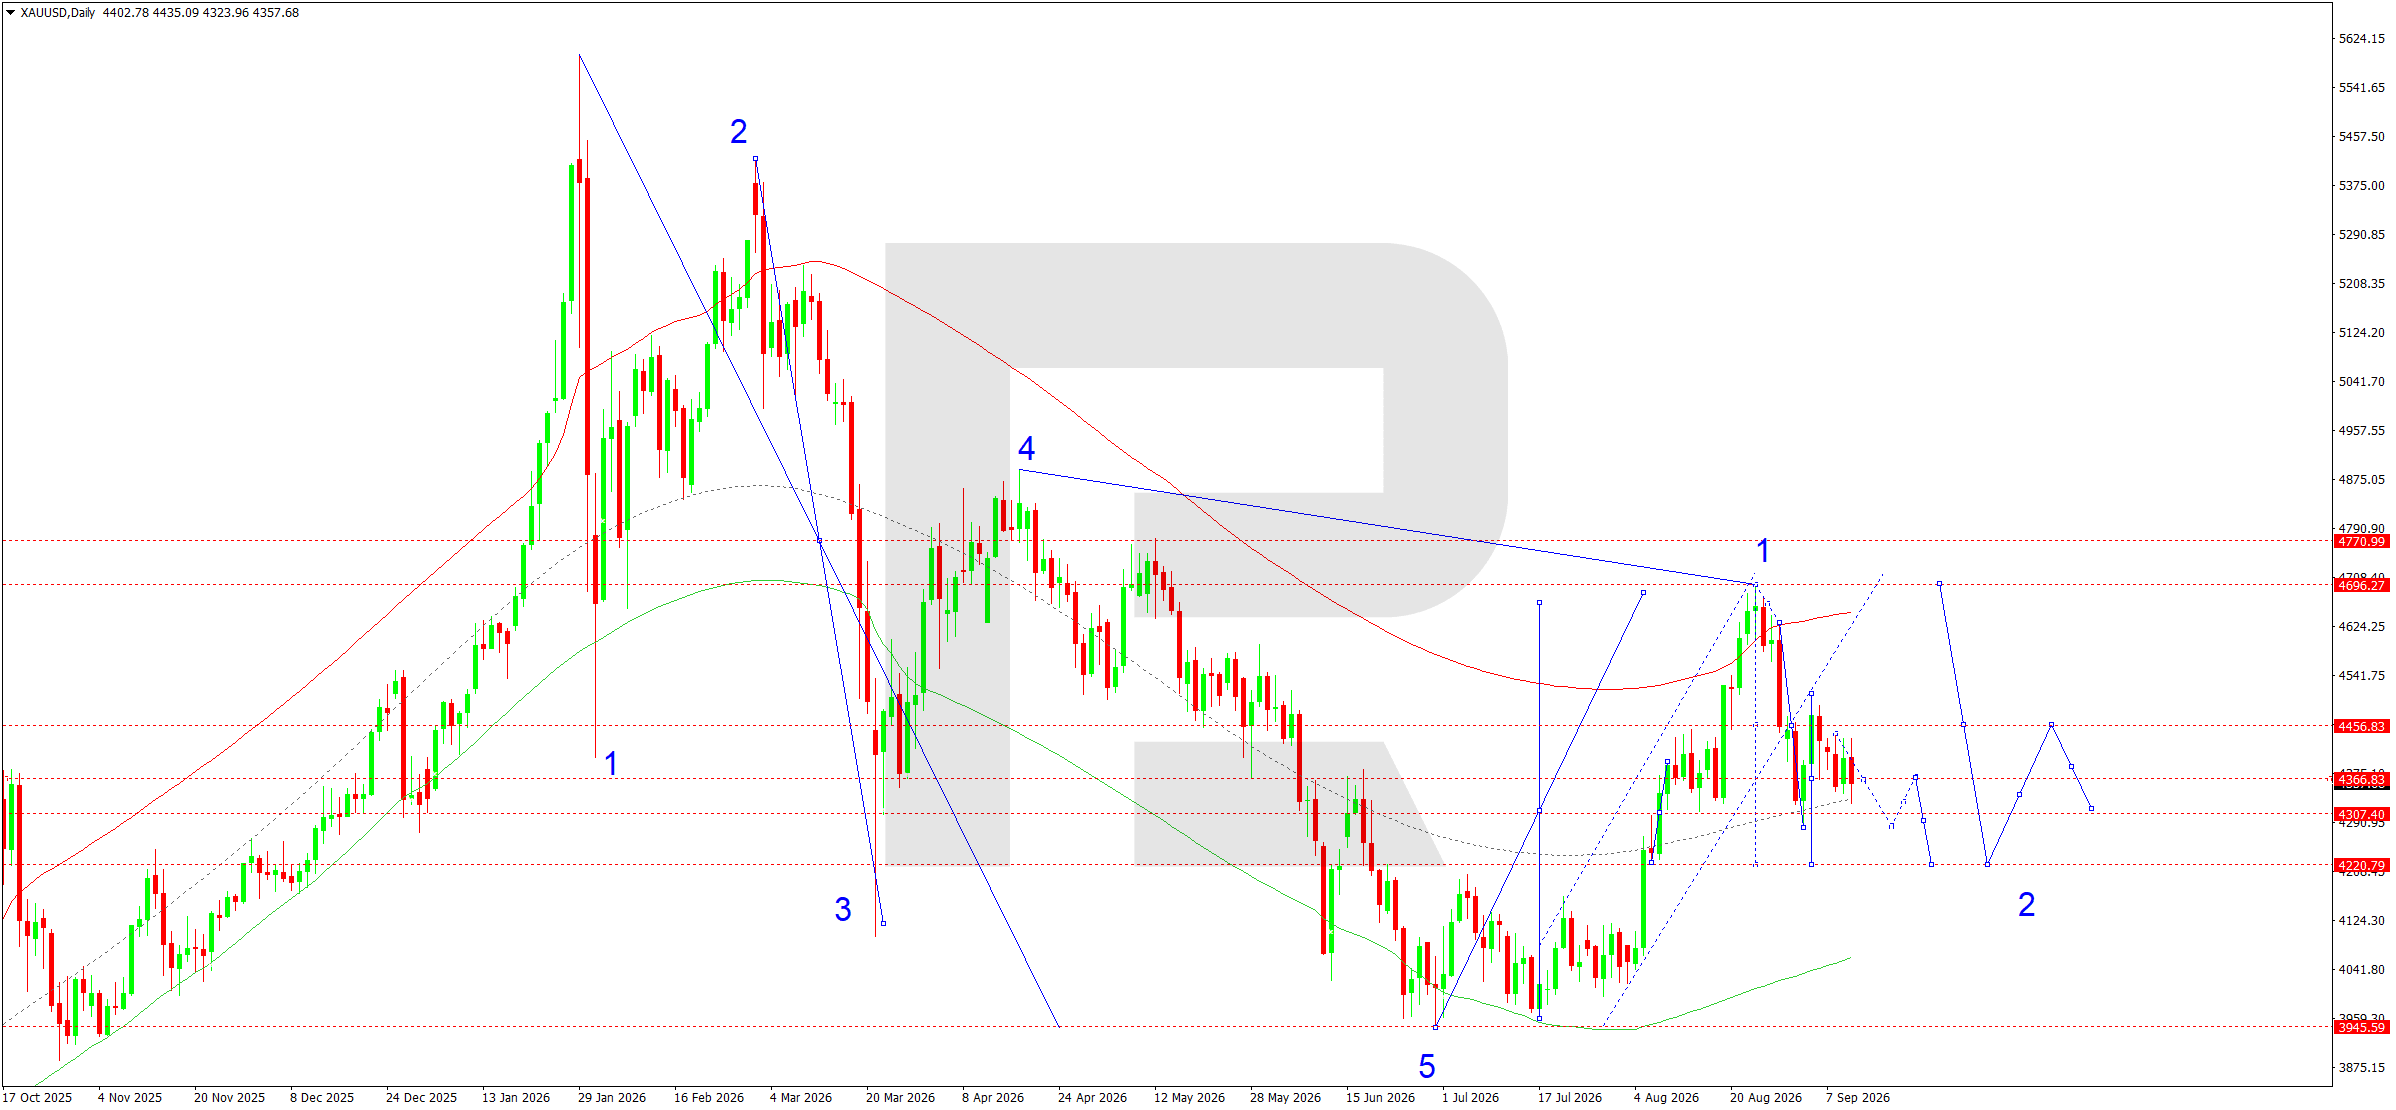
- Gold: Support: 4,307, 4,221. Resistance: 4,367, 4,457
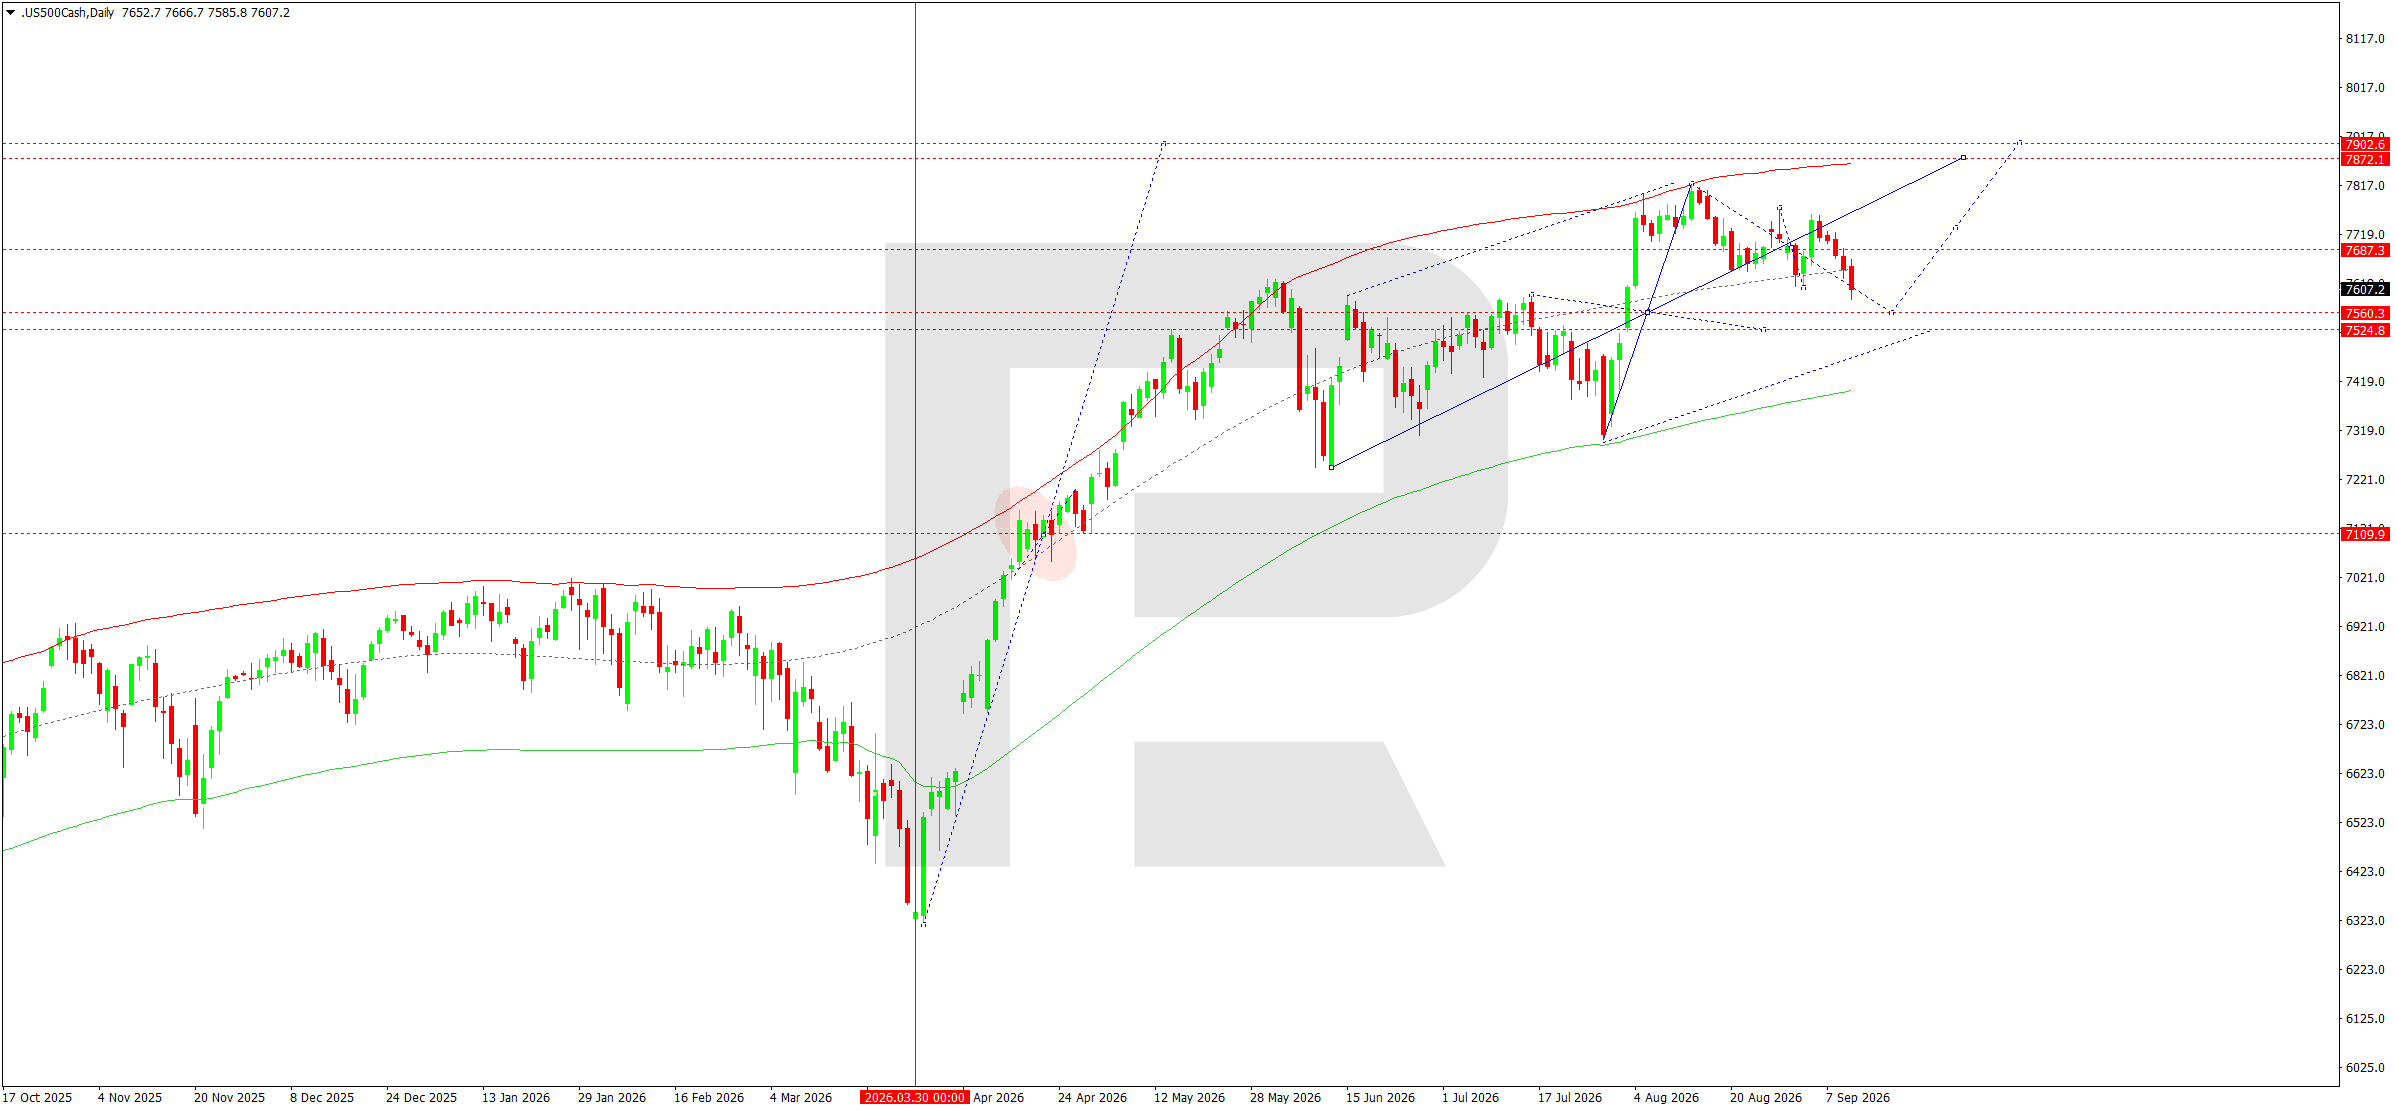
- US 500: Support: 7,585, 7,560. Resistance: 7,688, 7,872
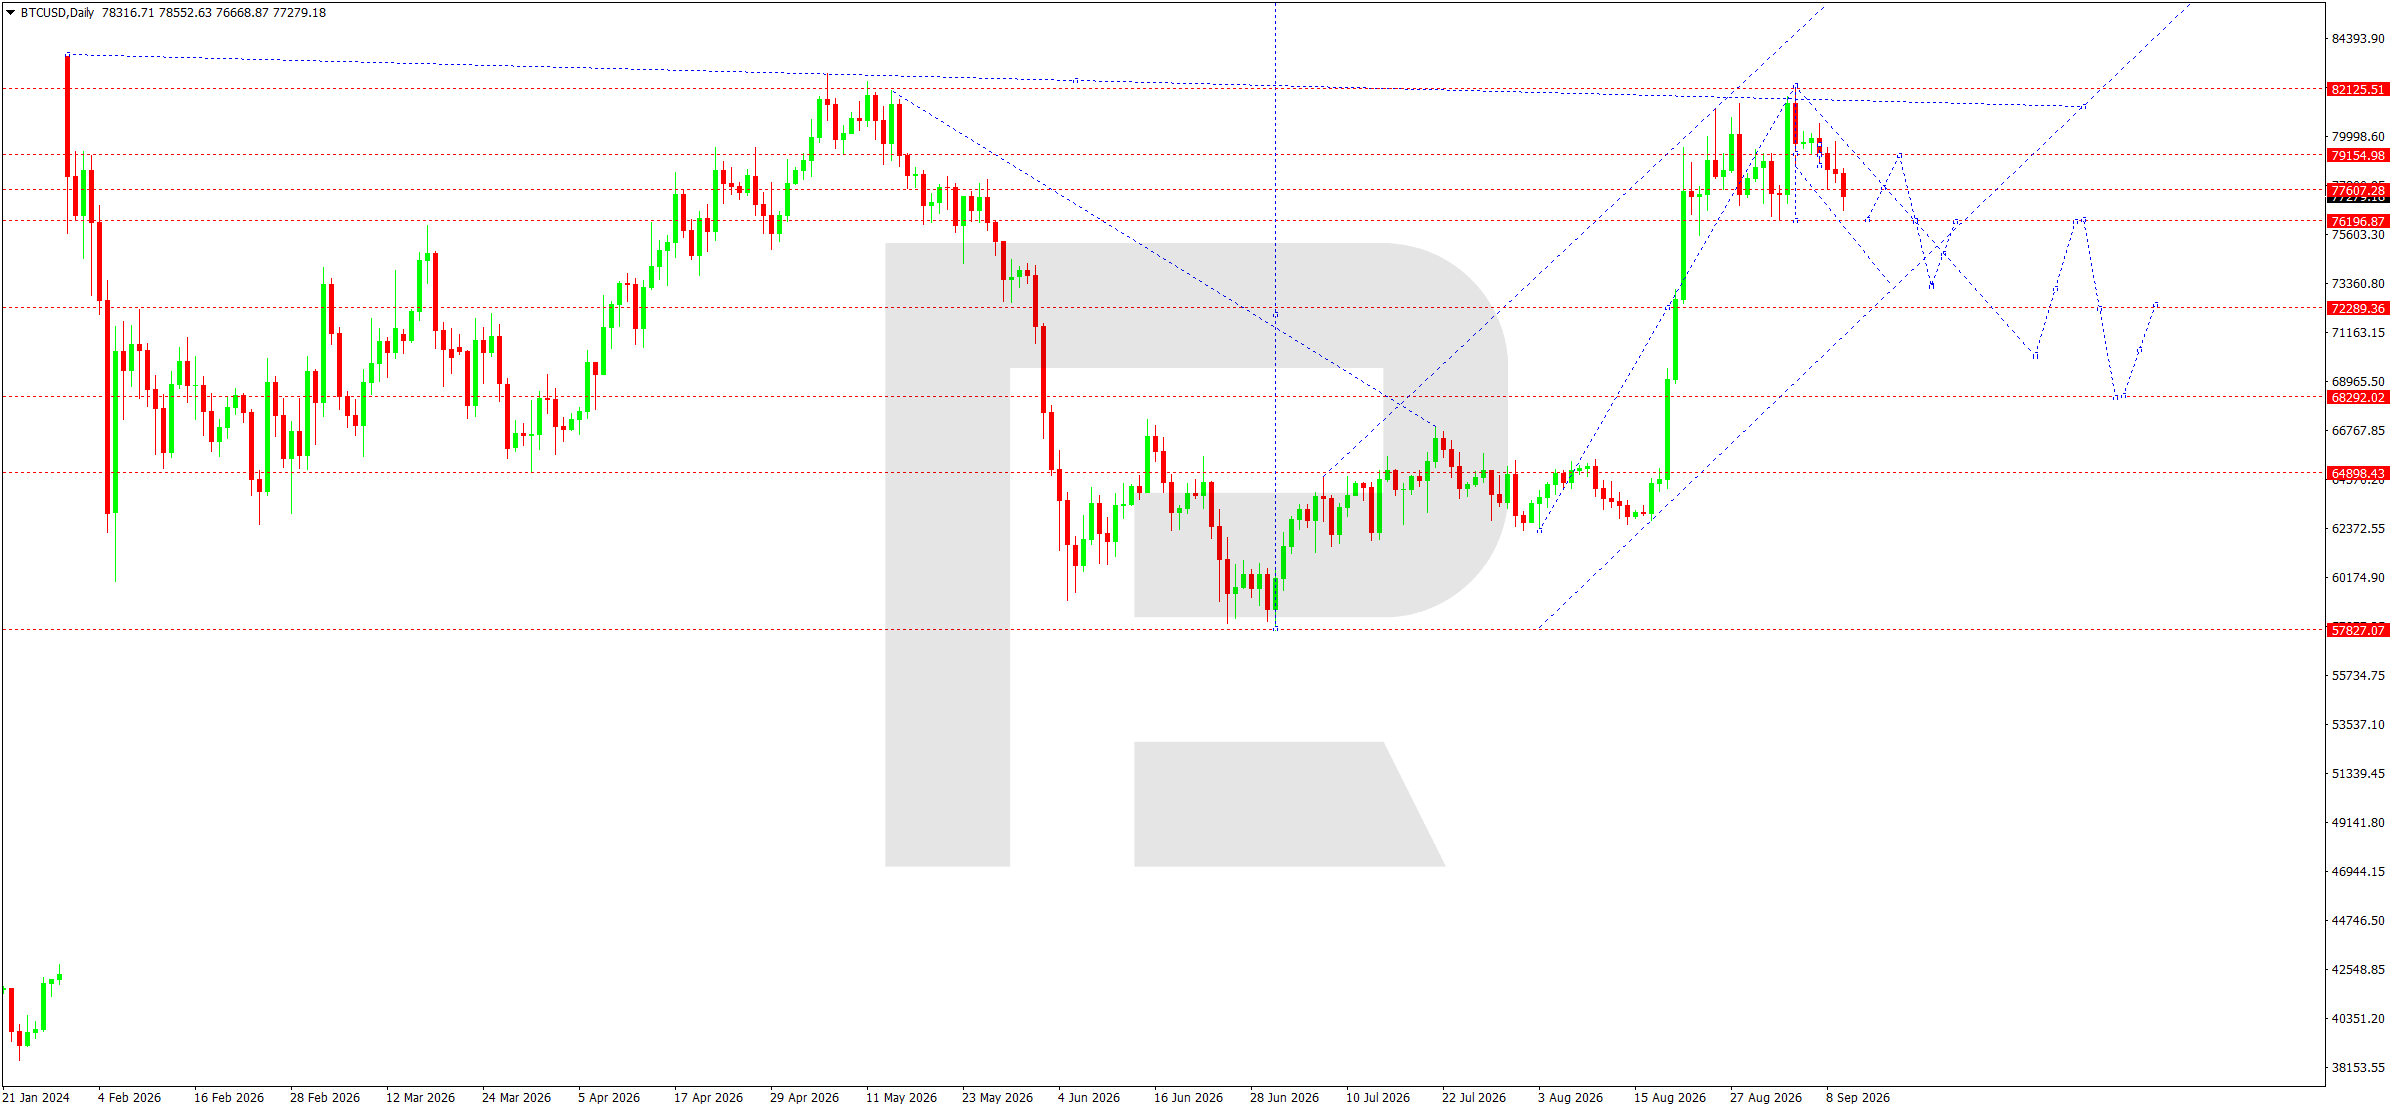
- BTCUSD: Support: 76,197, 72,289. Resistance: 77,607, 79,155
EURUSD forecast
At the start of the new week, the fundamental backdrop for EURUSD remains mixed but is gradually shifting in favour of the US dollar. The European Central Bank raised the deposit rate by 25 basis points to 2.50% on 10 September in response to accelerating inflation and a new energy shock. Annual eurozone inflation rose to 3.3% in August, mainly due to higher energy prices. At the same time, the ECB raised its eurozone growth forecast for 2026 to 0.9%, but remains cautious because of the risk of further increases in oil and gas prices. The rate increase is supportive for the euro, but much of the decision had already been priced in by the market, so no sustained upward momentum formed after the meeting.
On the US side, market attention is shifting to the Federal Reserve meeting on 15–16 September. The August Producer Price Index rose by 0.4% month-on-month and 5.4% year-on-year, strengthening expectations of a possible rate hike. Earlier, the employment report also beat forecasts, with the US economy adding 162,000 jobs. The August CPI will be the key factor ahead of the Fed meeting, as persistently high inflation could decisively strengthen expectations of policy tightening. Rising US Treasury yields amid expensive oil and geopolitical tensions provide the US dollar with an additional advantage. As a result, the fundamental balance for the coming week allows for continued pressure on EURUSD.
EURUSD technical analysis
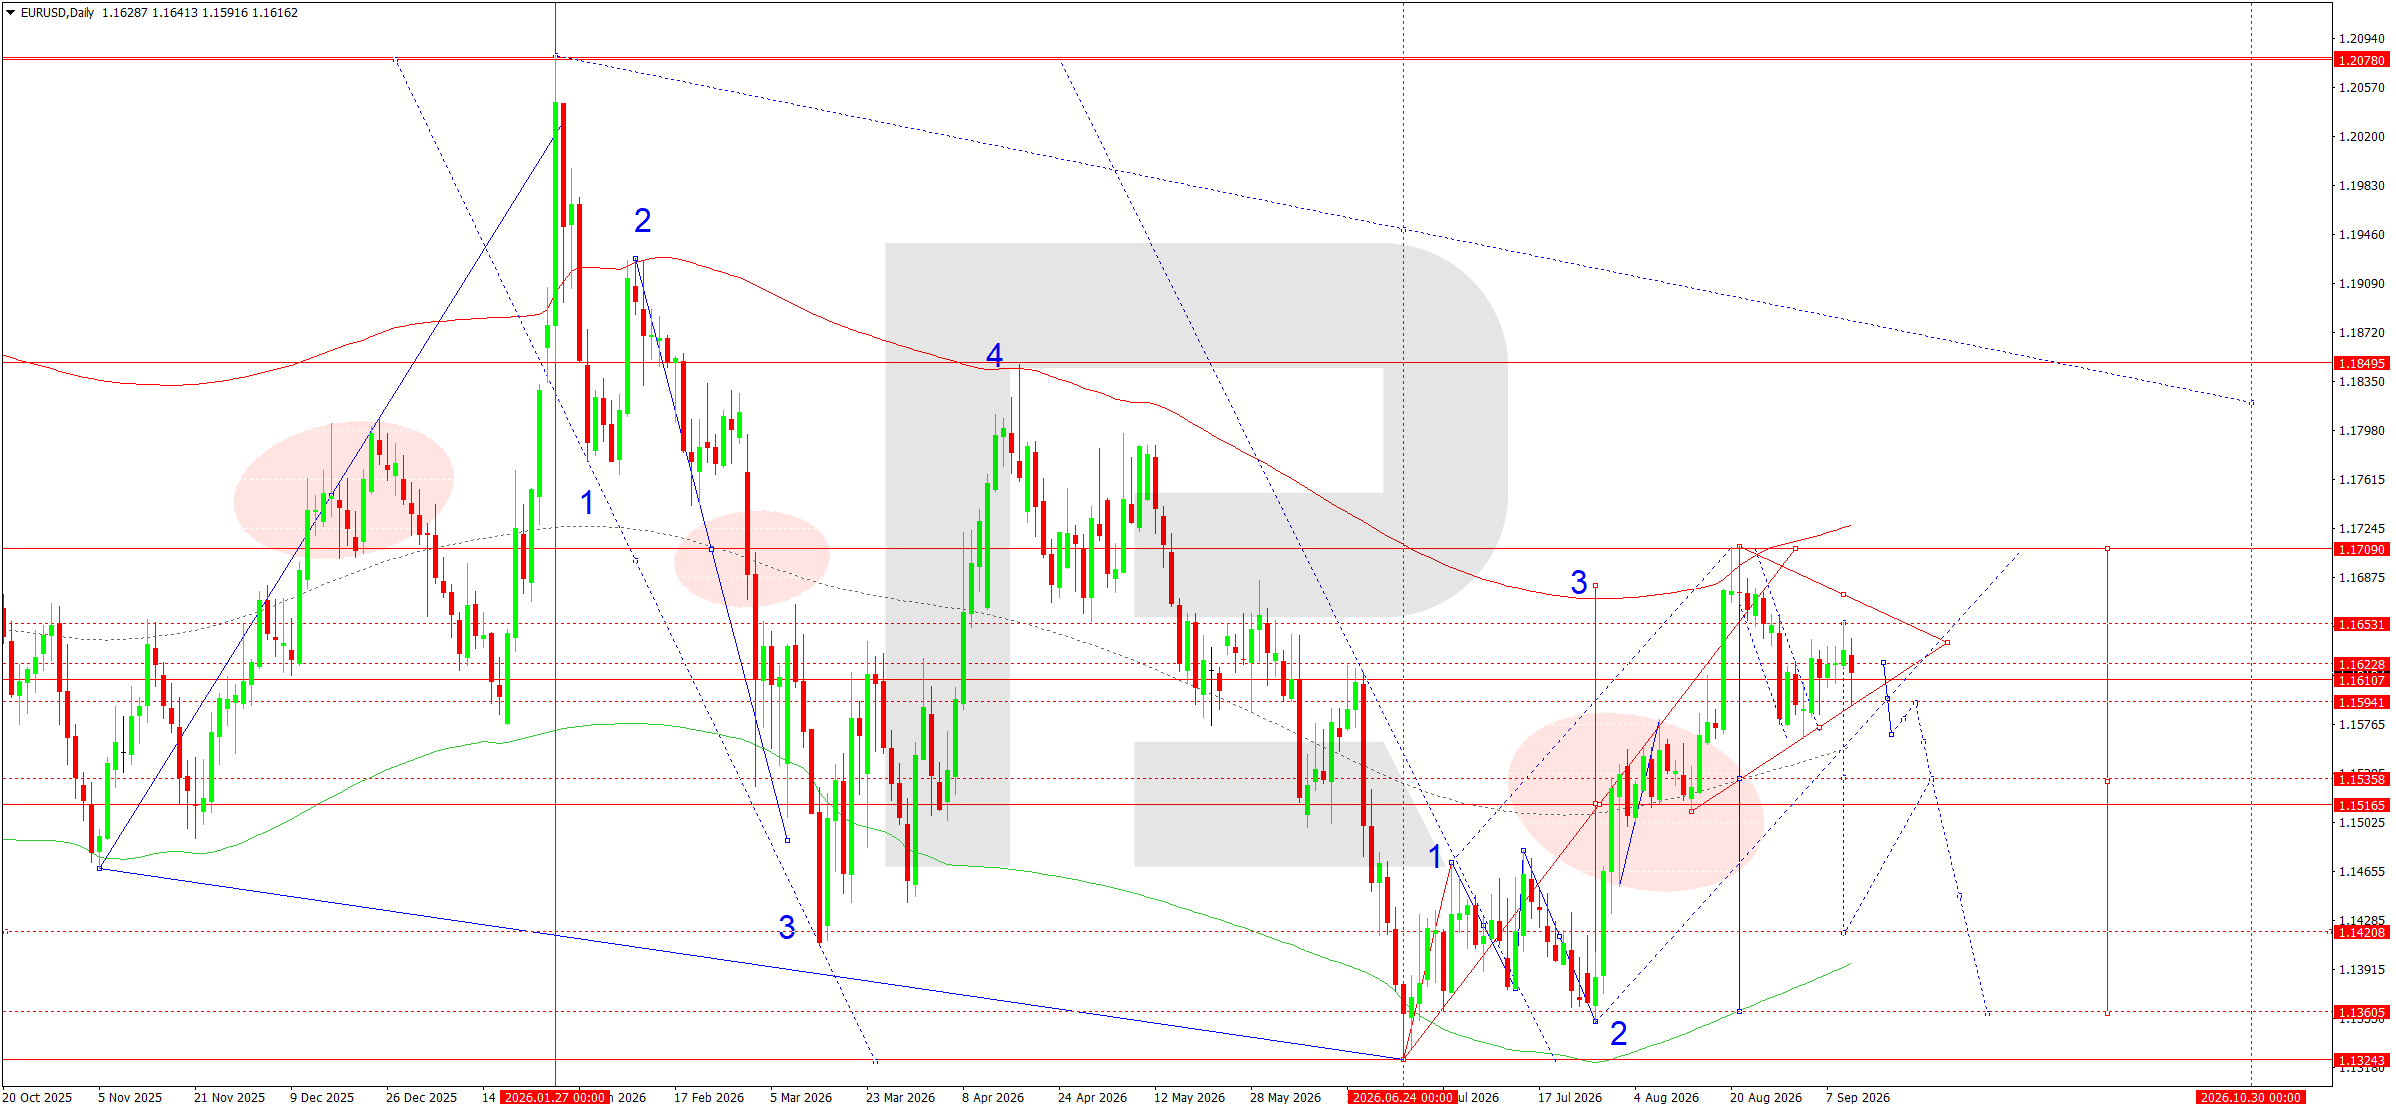
On the daily EURUSD chart, the pair previously reached the target of the upward wave in the 1.1710 area. From this zone, the market formed a pronounced downward impulse towards 1.1566, followed by a corrective recovery towards 1.1592 and a transition into consolidation. The current structure is developing around the 1.1594–1.1623 area, which is effectively becoming the centre of short-term price rotation. On the upside, movement is capped by 1.1623 and 1.1653, while 1.1709 remains the stronger resistance.
The main scenario remains a continuation of the decline. While the price holds below 1.1653, conditions remain in place for the local correction to end and another downward wave towards 1.1538 to form. This level is the first local target. After it is tested, a technical recovery towards 1.1590–1.1594 is possible, followed by the formation of a continuation pattern in the downtrend.
If sellers become active again, the main target of the next impulse will be the 1.1418–1.1421 area. Thus, the daily-chart structure suggests the following sequence: a decline towards 1.1538, a corrective return towards 1.1590, and then a continuation lower. The alternative scenario would become relevant only after consolidation above 1.1653. In that case, the market could return to test 1.1709. Until a confirmed breakout of this area, selling remains the priority.
EURUSD forecast scenario
Trading scenario: SELL
- Price at the time of writing: 1.1616
- Entry price: 1.1611
- Stop Loss: 1.1655
- Take Profit: 1.1538
- Risk-to-reward ratio: 1:1.7
The trade idea is valid until 8:00 on 21 September 2026 (server time, UTC+3).
USDJPY forecast
The main fundamental event for USDJPY in the coming week will be the combination of the Federal Reserve meeting on 15–16 September and the Bank of Japan meeting on 18 September. Following the August US producer-price data, the market strengthened expectations of another Fed rate hike: inflationary pressure remains elevated, while expensive oil adds to the risk of faster consumer-price growth. Before the start of the week, the key reference point will be the release of the August US CPI on 11 September. A stronger reading could support the US dollar and temporarily return USDJPY to the nearest resistance levels, while moderate inflation would weaken expectations of Fed tightening.
US Treasury yields remain high, supporting the US dollar through the interest-rate differential. However, the pair’s reaction increasingly depends not only on Fed policy but also on changing expectations in Japan. The recent strengthening of the yen showed that the market is prepared to reduce short positions in the Japanese currency more actively if the probability of faster BoJ rate increases rises.
On the Japanese side, the fundamental balance is gradually shifting in favour of the yen. Market participants expect the BoJ to potentially raise the rate to 1.25% at its 18 September meeting, with further policy normalisation continuing over the following quarters. Persistent price pressure, the yen’s weakness in previous months, and more hawkish rhetoric from policymakers support this scenario. Rising Japanese bond yields and the prospect of reduced carry-trade attractiveness create medium-term conditions for yen strength. At the same time, high energy prices remain a restraining factor for Japan as a major commodity importer, so USDJPY may be accompanied by sharp corrections.
USDJPY technical analysis
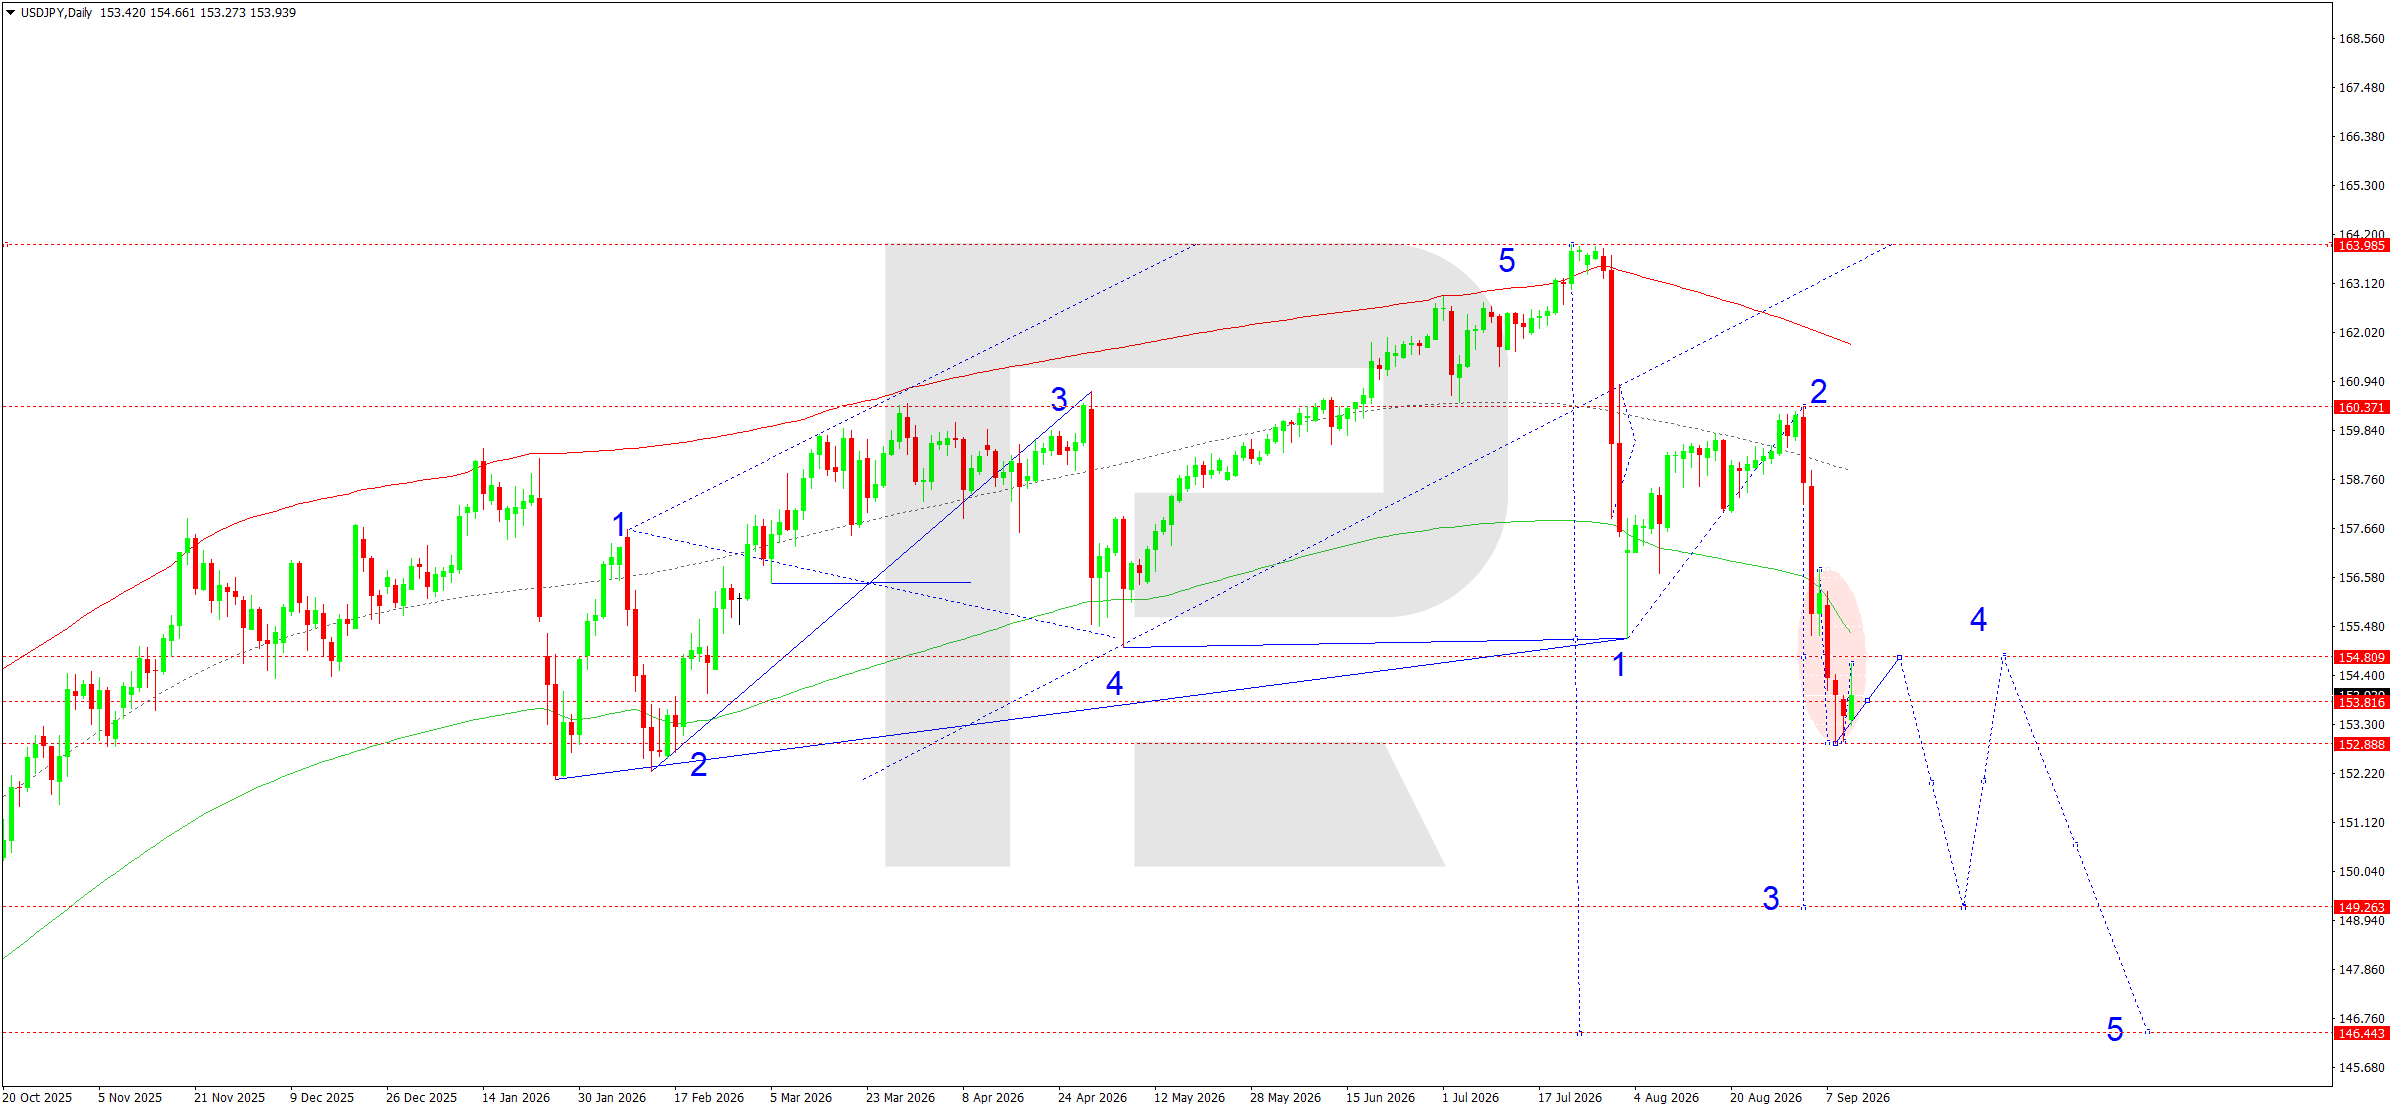
On the daily USDJPY chart, a pronounced downward structure has formed after the completion of the fifth upward wave around 163.99. The subsequent selling impulse broke the ascending channel and successively pushed the price back below 160.37 and 154.81, confirming a change in the medium-term trend. The target of the previous downward wave around 152.89 was reached, after which the market formed a corrective impulse towards 154.64.
The current consolidation is developing between 152.89 and 154.81. Under the base-case scenario, an additional corrective test of the 154.64–154.81 area is possible; however, while the price remains below 154.81, sellers retain the advantage. A renewed decline below 152.89 would open the way towards the local target area at 149.26–149.30, corresponding to the development of the assumed third wave of the downward cycle. After this area is reached, a correction towards 152.80–154.80 is likely, after which the main trend movement may continue towards 146.44–146.46 as the principal medium-term target. Invalidation of the bearish scenario would require a confident consolidation above 154.81 followed by a recovery towards 160.37.
USDJPY forecast scenario
Trading scenario: SELL
- Price at the time of writing: 153.94
- Entry price: 153.89
- Stop Loss: 154.82
- Take Profit: 149.30
- Risk-to-reward ratio: 1:5
The trade idea is valid until 8:00 on 21 September 2026 (server time, UTC+3).
GBPUSD forecast
The fundamental backdrop for GBPUSD at the start of the new week remains mixed, but the balance of risks is gradually shifting in favour of the US dollar. The Bank of England will hold its next meeting on 17 September. Economists’ consensus expects the rate to remain at 3.75%, while the market continues to price in the possibility of tightening later in the year. UK inflation remains elevated, and expensive oil increases the risk of another acceleration in prices, but weak employment and moderate growth limit the scope for an immediate rate hike.
UK labour-market data on 15 September and consumer inflation on 16 September will provide additional volatility. These releases could materially change BoE expectations immediately before the meeting. At the same time, rising UK bond yields increase financing costs and may restrain domestic demand, so a higher level of market rates alone does not guarantee sustained support for sterling.
The US backdrop appears more restrictive. The Federal Reserve will meet on 15–16 September. After the strong August employment report, when the economy added 162,000 jobs with unemployment at 4.1%, and the acceleration in producer prices, the probability of a rate hike has risen significantly. High oil prices and geopolitical tensions in the Middle East are creating additional pressure. If inflation data confirm persistent price pressure, the US dollar could receive further support.
At this stage, the divergence in expectations for the two central banks is becoming the key driver of the pair: the market allows for a more hawkish Fed move at the upcoming meeting, while the BoE is primarily expected to pause and assess new data. Therefore, even persistently high UK inflation would not necessarily strengthen sterling if US data remain strong.
GBPUSD technical analysis
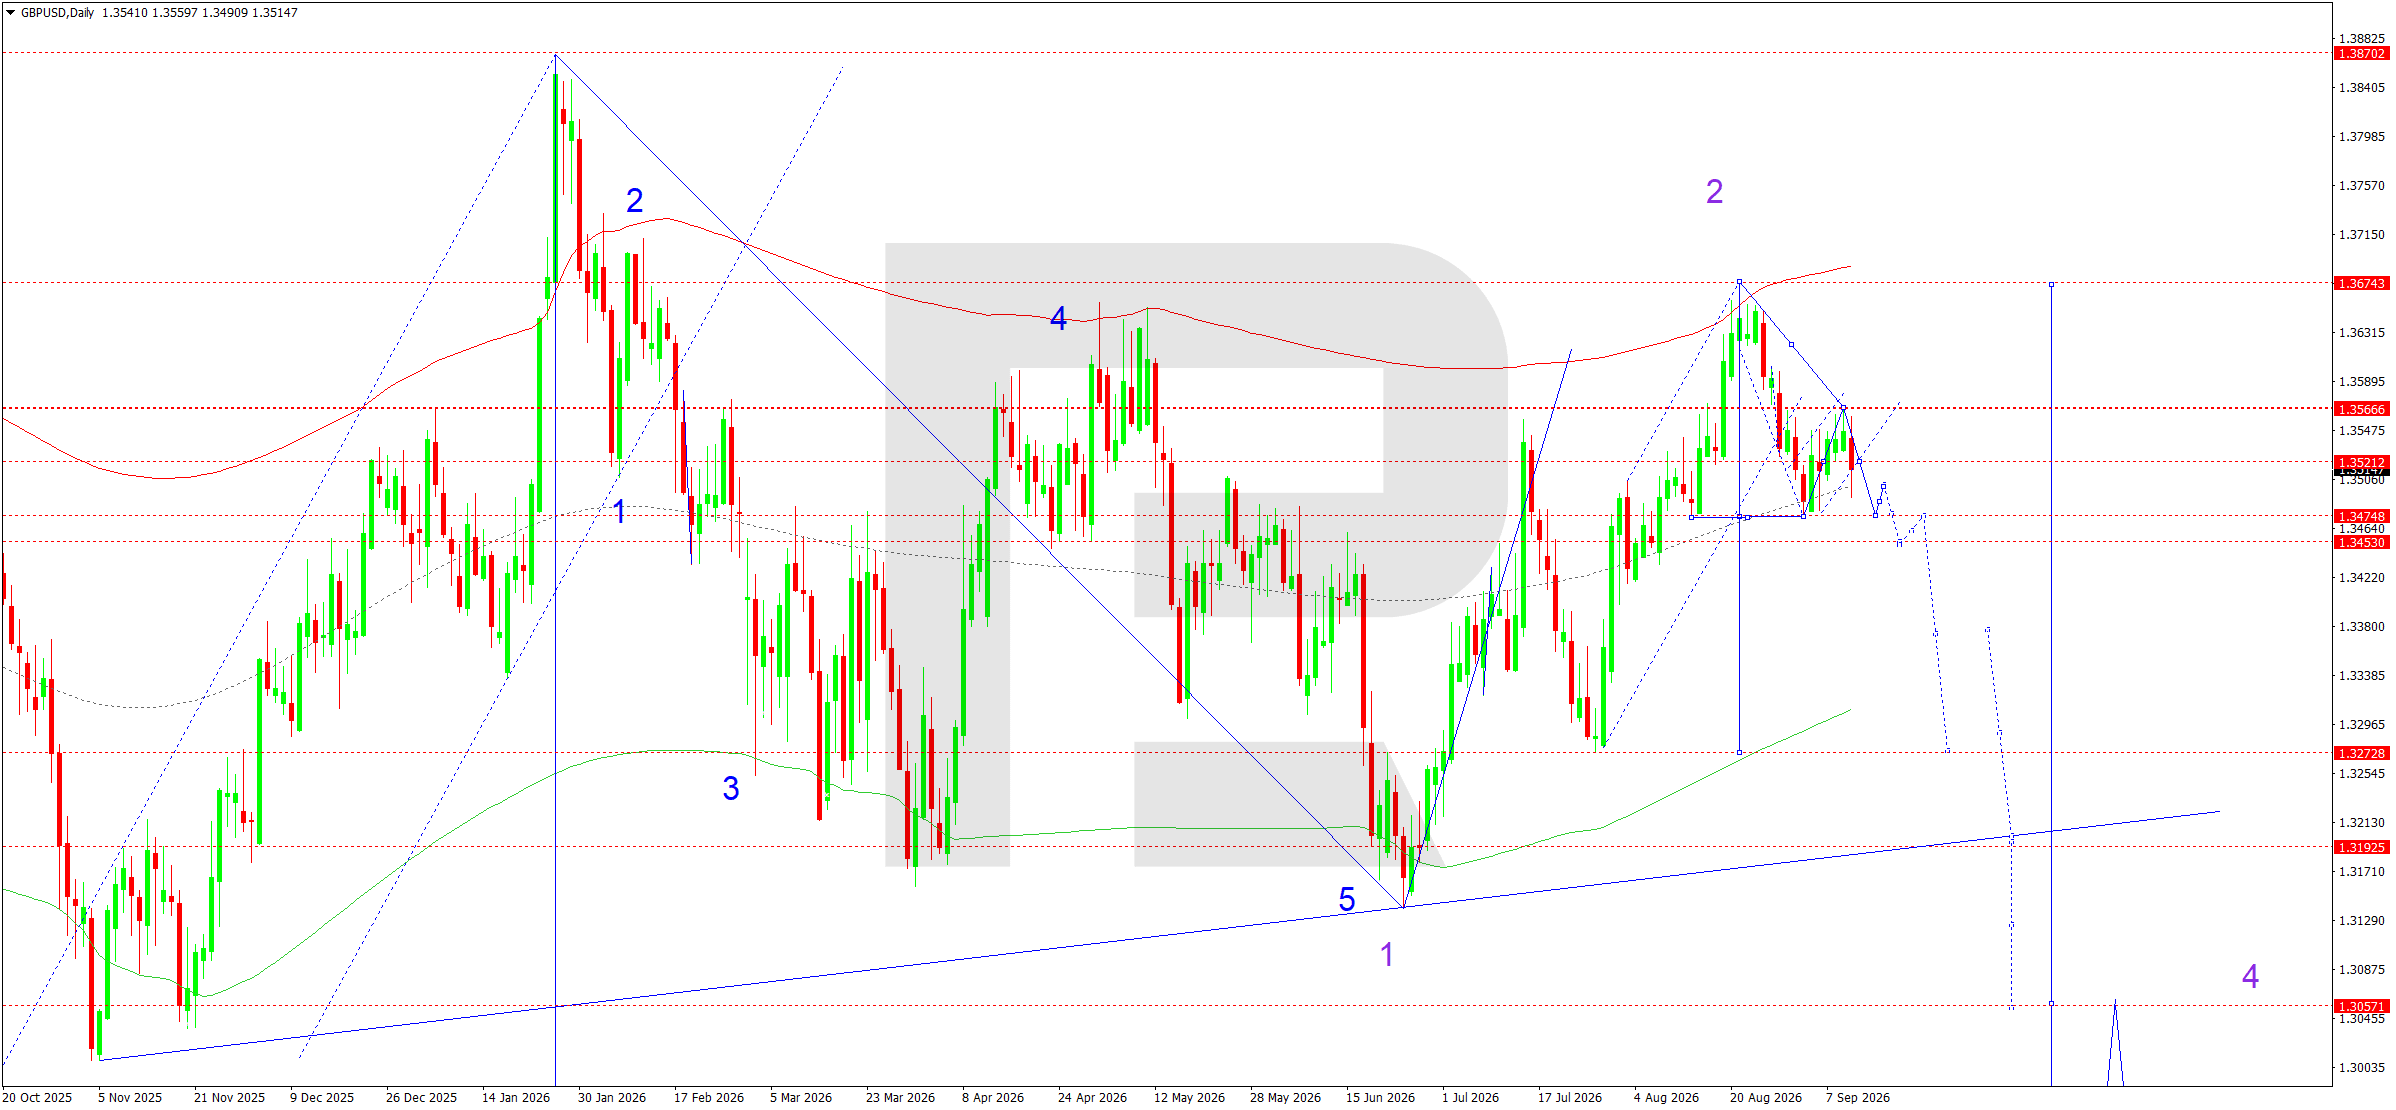
On the daily GBPUSD chart, the nearest downside target at 1.3475 was reached earlier. The market then formed a recovery impulse towards 1.3566 and a new downward leg into the 1.3495 area. During the current week, the price effectively moved into consolidation above the 1.3475–1.3464 zone, while retaining a structure below the key resistance at 1.3566.
From a wave perspective, the rise towards 1.3566 appears to be a corrective segment within a larger downward structure. While the price remains below 1.3566, the base case is a continuation of the decline. The first target is another test of 1.3475. Consolidation below 1.3474 would confirm the development of the next downward wave and open potential towards 1.3272. On a broader scale, this section could form the third downward wave in the main trend. A return above 1.3566 would weaken sellers and postpone the main scenario.
GBPUSD forecast scenario
Trading scenario: SELL
- Price at the time of writing: 1.3515
- Entry price: 1.3510
- Stop Loss: 1.3567
- Take Profit: 1.3272
- Risk-to-reward ratio: 1:4
The trade idea is valid until 8:00 on 21 September 2026 (server time, UTC+3).
AUDUSD forecast
AUDUSD enters the new week amid a confrontation between two factors: the continued restrictive stance of Australian monetary policy and stronger expectations of a US rate hike. The Reserve Bank of Australia kept the rate at 4.35% in August after three increases in 2026.
The regulator stresses that inflation remains too high and that risks to the price outlook are tilted to the upside. Expensive energy and persistent domestic supply constraints create additional pressure. This backdrop is supportive for the Australian dollar because the market continues to price in the possibility of further RBA tightening.
At the same time, the domestic backdrop is mixed. Australian consumer sentiment deteriorated in September amid high interest rates and rising fuel costs, while the RBA expects economic growth to slow in 2026. China’s economy, which is important for Australia’s external demand, is showing a strong export sector: both exports and imports rose notably in August, although domestic consumption remains weak. This limits the AUD’s appreciation potential.
The Federal Reserve will be the main risk for the pair this week. The August US Producer Price Index rose by 0.4% month-on-month and 5.4% year-on-year, strengthening expectations of a rate hike at the 15–16 September meeting. High oil prices provide additional support to inflation concerns and US bond yields. Therefore, demand for the US dollar may remain elevated ahead of the Fed decision, while AUDUSD may stay under pressure. The US CPI release on 11 September will be another source of volatility: strong data would reinforce tightening expectations, while softer inflation could temporarily weaken the US dollar. Global risk appetite is also important for the AUD: tensions in the Middle East and expensive oil support safe-haven demand for the US currency.
AUDUSD technical analysis
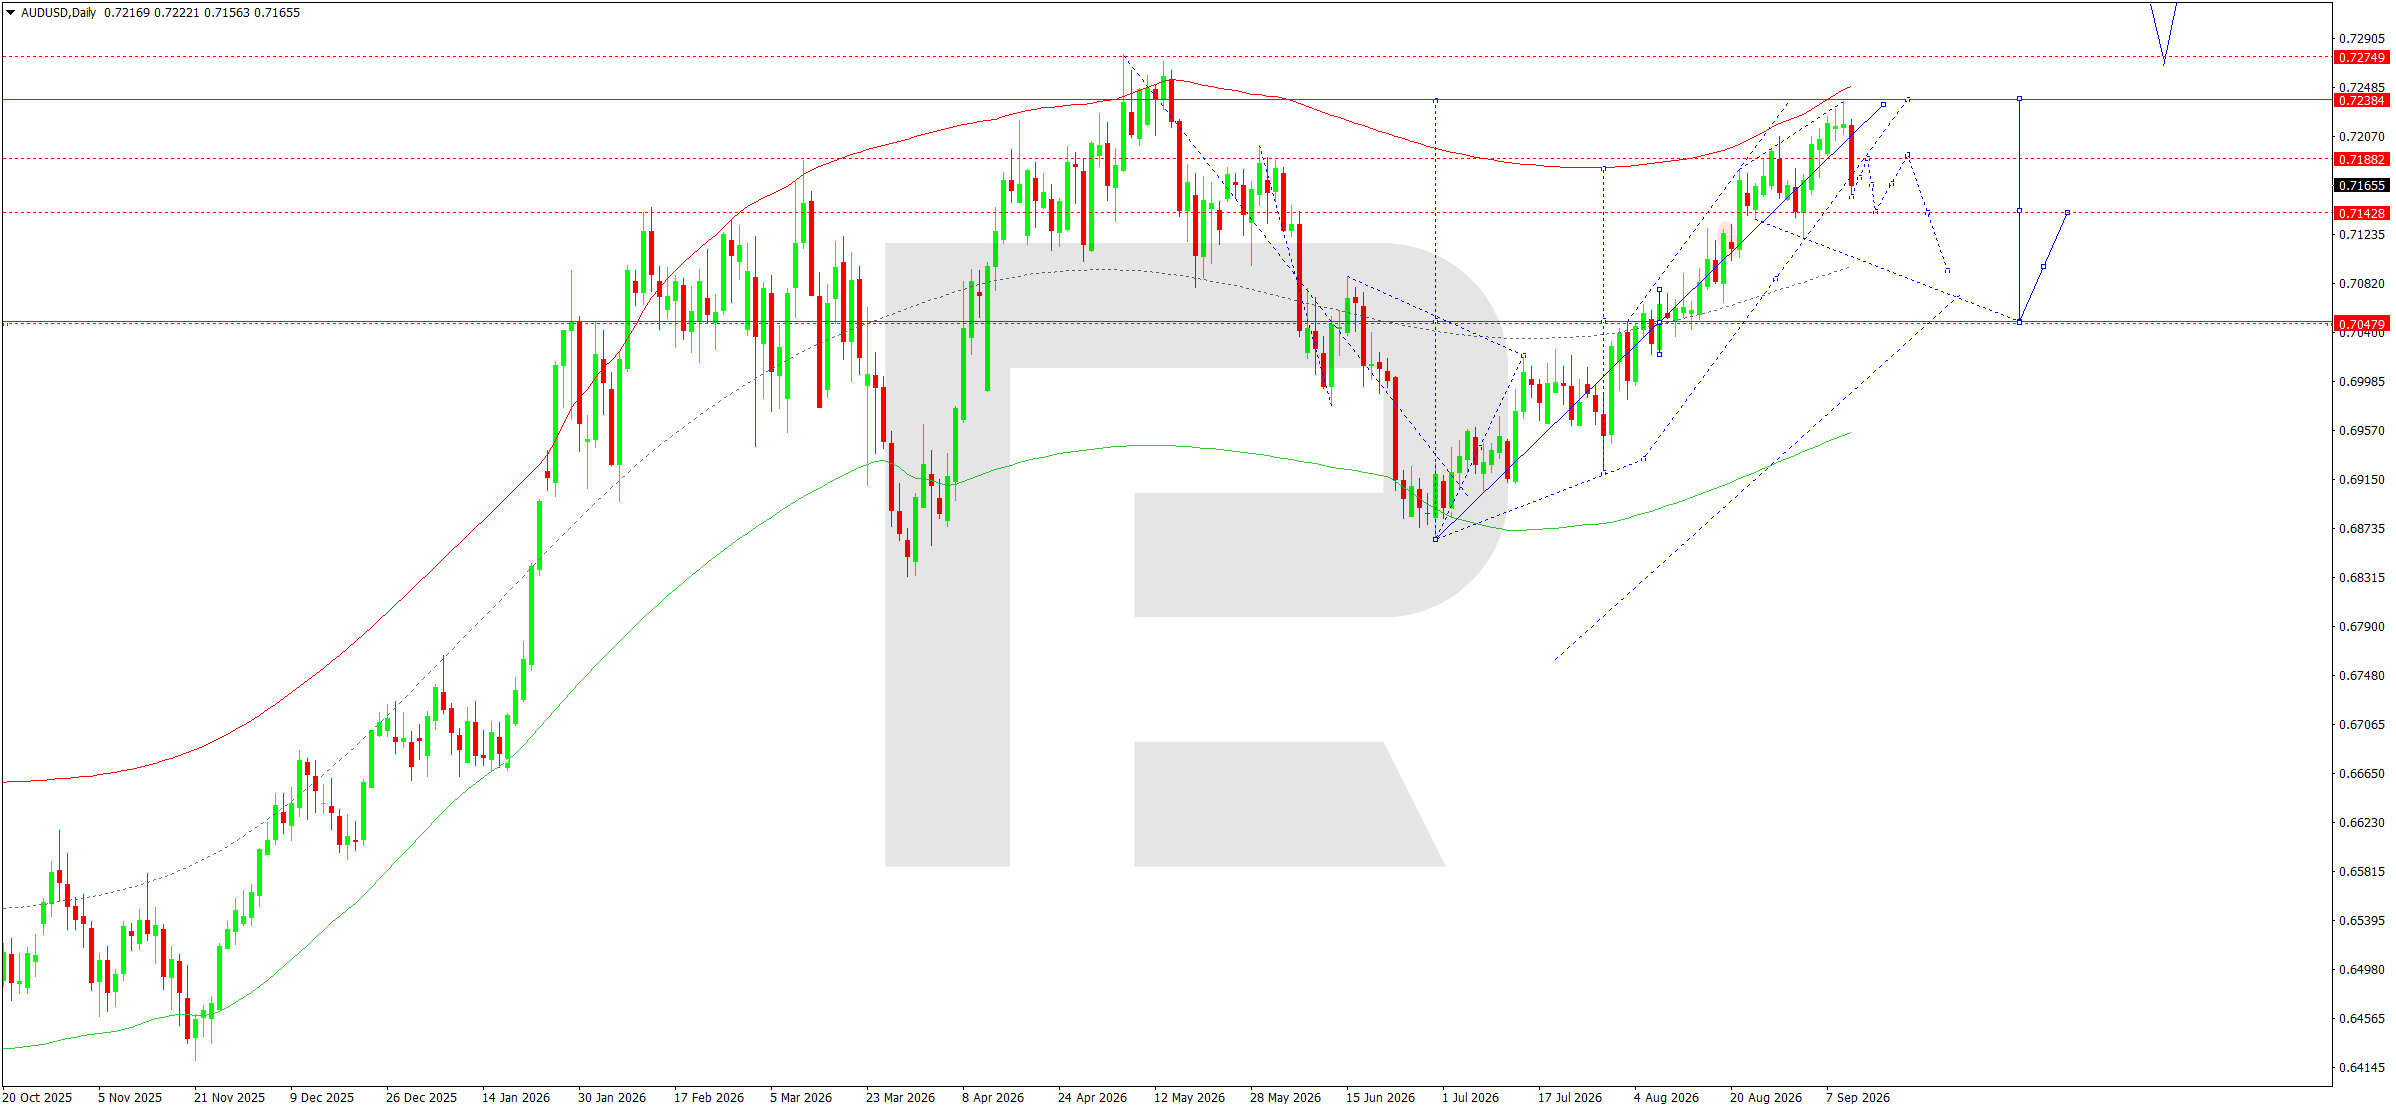
On the daily chart, the pair completed an upward wave in the 0.7237–0.7238 area and formed a downward impulse towards 0.7155. This reaction confirms the appearance of sellers in the upper part of the Price Envelope and the formation of a corrective structure after the completed upward section. The nearest recovery target is 0.7188. At the start of the week, a corrective leg towards this level is possible, followed by the formation of a consolidation range.
The main weekly scenario assumes a continuation of the decline. A return below 0.7143 would increase pressure and open the way towards the local target at 0.7140. Once this impulse is complete, a technical rebound towards 0.7180 is possible, where a continuation pattern for the downward wave is expected to form. Consolidation below the local support would create conditions for a move towards the main target at 0.7078. Deeper support is located at 0.7048. Invalidation of the bearish scenario would require a confident return above 0.7238.
AUDUSD forecast scenario
Trading scenario: SELL
- Price at the time of writing: 0.7166
- Entry price: 0.7161
- Stop Loss: 0.7189
- Take Profit: 0.7078
- Risk-to-reward ratio: 1:3
The trade idea is valid until 8:00 on 21 September 2026 (server time, UTC+3).
USDCAD forecast
At the start of the new week, USDCAD remains under the influence of opposing factors. For the US dollar, the main event will be the Federal Reserve meeting on 15–16 September. After the August Producer Price Index rose by 0.4% month-on-month and 5.4% year-on-year, the market increased expectations of a possible rate hike.
Additional pressure comes from high energy prices and rising US bond yields. Ahead of the meeting, the August CPI remains the key reference point: stronger inflation could support the US dollar, while weaker core price pressure would reduce the probability of Fed tightening. Deteriorating global risk appetite amid the Middle East conflict is increasing demand for the US dollar as a safe-haven asset.
The fundamental backdrop for the Canadian dollar is also mixed. The Bank of Canada kept the rate unchanged at 2.25% on 2 September but highlighted rising inflation risks and readiness to resume rate increases if necessary. Inflation is holding around 3%, while expensive oil increases the risk of second-round price effects. At the same time, August labour-market data were weaker: employment fell by 42,000 and average hourly earnings growth slowed to 2.0% year-on-year. This limits the scope for rapid BoC tightening.
New trade restrictions between Canada and the US remain an additional source of uncertainty, as they could simultaneously slow growth and raise corporate costs. Oil supports the CAD: Brent rose above 107 USD and WTI above 102 USD amid increased risks of supply disruptions in the Middle East. Therefore, the oil factor could restrain USDCAD growth even if the US dollar remains strong.
USDCAD technical analysis
On the daily chart, the downward structure from the 1.4248 area remains intact. The pair reached another downside target around 1.3759 and moved into a corrective range around 1.3800. The current recovery impulse reached the 1.3838 area, which corresponds to a local correction within the broader downward wave. The price remains below the resistance zone and is forming a continuation pattern in the direction of the downtrend.
At the start of the week, a return towards 1.3800 and a test of this area from above remain relevant. While the price holds above it, there is potential for the local upward leg to extend towards 1.3848. This target is viewed as intermediate: consolidation above 1.3848 could extend the correction towards 1.3935, although the base case assumes a reversal after the rise is complete.
The main scenario remains downward. A return below 1.3800 followed by a breakout below 1.3785 would confirm the continuation of the decline towards 1.3725. After this support is broken, the structure would open the way towards the main target around 1.3630, coinciding with the lower boundary of the major daily channel and the area where the downward leg may complete.
USDCAD forecast scenario
Trading scenario: SELL
- Price at the time of writing: 1.3821
- Entry price: 1.3816
- Stop Loss: 1.3851
- Take Profit: 1.3725
- Risk-to-reward ratio: 1:3
The trade idea is valid until 8:00 on 21 September 2026 (server time, UTC+3).
XAUUSD forecast
Gold enters the new week under pressure from sharply changed expectations regarding US monetary policy. The August Producer Price Index, released on 10 September, rose by 0.4% month-on-month and 5.4% year-on-year. Against this backdrop, the market raised the probability of a Federal Reserve rate hike at the 15–16 September meeting to around 70%. At the same time, the yield on 10-year US Treasury bonds rose towards 4.94%, the US dollar strengthened, and the spot gold price fell by more than 1%, approaching the 4,356 area. For XAUUSD, the combination of a strong US dollar and high yields remains the main short-term pressure factor.
Additional uncertainty comes from the release of the August US CPI on 11 September, the final major inflation reference point before the Fed meeting. Higher inflation could reinforce expectations of a rate hike and maintain pressure on gold, while softer readings could restore demand for the metal.
At the same time, the geopolitical backdrop remains supportive: rising tensions around Iran and shipping disruptions have pushed oil prices above 100 USD, increasing inflation risks and demand for safe-haven assets. Central-bank demand also remains a structural support factor: their net gold purchases reached 289 tonnes in the second quarter. Therefore, the fundamental backdrop for the week remains mixed, but sellers retain the advantage ahead of the Fed decision. The Fed’s decision on Wednesday will be the main source of volatility.
XAUUSD technical analysis
On the daily chart, after the completion of upward wave 1 around 4,696, corrective wave 2 is forming. Within it, the latest upward leg reached its local target around 4,443, after which the market formed a downward impulse towards 4,366 and moved into consolidation around this level. This sequence preserves the characteristics of a continuation pattern within the local downward trend.
While the price remains below 4,457, corrective wave 2 appears incomplete, and attempts to rise should primarily be viewed as local pullbacks within the developing downward leg.
The base case remains the development of a downward impulse with a local target around 4,288. The intermediate level on the way is 4,307. Once the local impulse is complete, a corrective return towards 4,367 is possible.
If sellers hold this area, the next downward leg is expected to form with the main target at 4,221. A move towards 4,221 would confirm the development of a continuation pattern in the direction of the downward trend. A return above 4,457 would weaken the bearish scenario and create conditions for a deeper upward correction, while consolidation below 4,221 would confirm the continuation of wave 2.
XAUUSD forecast scenario
Trading scenario: SELL
- Price at the time of writing: 4,358
- Entry price: 4,353
- Stop Loss: 4,420
- Take Profit: 4,220
- Risk-to-reward ratio: 1:2
The trade idea is valid until 8:00 on 21 September 2026 (server time, UTC+3).
US 500 forecast
The US stock market enters the new week amid a notable increase in interest-rate and geopolitical risks. The S&P 500 ended 10 September with its fourth consecutive decline as rising Treasury yields and a new wave of inflation concerns intensified pressure. The August Producer Price Index rose by 0.4% month-on-month and 5.4% year-on-year.
At the same time, Brent rose above 100 USD per barrel amid an escalation of the conflict around Iran and risks to supplies through the Middle East. For equities, the combination of expensive oil and high yields remains negative because it raises the cost of capital and restrains valuation multiples in the technology sector.
The main event of the week of 14–18 September will be the Federal Reserve meeting on 15–16 September. The market has moved close to pricing in a 25-basis-point rate hike, although economists’ surveys still retain a pause as the base case. The August CPI, due on 11 September, is also important: the consensus expects 0.4% month-on-month for the headline index and 0.2% month-on-month for the core reading.
A strong labour-market report, with non-farm payrolls rising by 162,000 and unemployment remaining at 4.1%, gives the Fed more room for hawkish rhetoric. At the same time, the market’s fundamental base does not look unequivocally weak: strong US corporate earnings and resilient investment in technology continue to support long-term demand for equities. However, in the coming days, the Fed factor and yield dynamics will be more important than corporate optimism. Therefore, volatility in US 500 is likely to remain elevated.
US 500 technical analysis
On the daily chart, the medium-term structure remains upward, although a local corrective wave is developing from the August highs. The price has already reached the nearest downside target around 7,585 and formed a low near this level. The price remains within a broader upward structure and well above the March pivot point, but momentum in recent sessions has been directed lower.
The key task for buyers is to hold the 7,585–7,560 area and return the index above 7,660. If this develops, a correction towards 7,688 will become possible, where the nearest resistance and the return zone into the previously broken range are located.
The main scenario for the week assumes consolidation above 7,585 first, followed by a corrective rise towards 7,660. Once this is complete, the probability of a new downward wave towards 7,566 remains. If sellers fail to consolidate below this level, the structure allows for a recovery towards 7,688. A breakout above 7,688 would strengthen the bullish scenario and open the way towards 7,872 and 7,903. Conversely, consolidation below 7,560 would shift attention towards 7,525. Deeper support is located around 7,110.
US 500 forecast scenario
Trading scenario: BUY
- Price at the time of writing: 7,607
- Entry price: 7,612
- Stop Loss: 7,580
- Take Profit: 7,660
- Risk-to-reward ratio: 1:1.5
The trade idea is valid until 8:00 on 21 September 2026 (server time, UTC+3).
BTCUSD forecast
At the start of the new week, Bitcoin remains under pressure after failing to consolidate around 82,000 and returning to the 77,000 area. The key macroeconomic factor will be the Federal Reserve meeting on 16 September.
After the August Producer Price Index showed that elevated inflationary pressure persisted, the market significantly increased the probability of a rate hike. At the same time, the yield on 10-year US Treasury bonds approached 5%, intensifying competition for capital and traditionally limiting demand for high-risk assets, including cryptocurrencies. High oil prices and geopolitical tensions in the Middle East remain an additional source of uncertainty, as they could support inflation expectations and a more hawkish Fed stance.
The dynamics of US spot ETFs remain an important signal for BTC. After strong capital inflows in early September, the latest sessions showed a reversal: on 8–9 September, the funds recorded a combined net outflow of about 167 million USD. At the same time, the balance over the preceding seven-day period remained positive, indicating not a complete withdrawal of institutional demand but rather increased caution ahead of the Fed decision. For the market in the week of 14–18 September, the combination of high yields, rate expectations, and ETF flows will determine investors’ willingness to return to buying. A more hawkish Fed signal could deepen the BTC correction, while neutral rhetoric and lower yields could restore demand.
BTCUSD technical analysis
On the daily BTCUSD chart, after forming a high in the 82,126 area, the market entered a corrective wave. The successive decline below 79,155 and 77,607 confirms weakening upward momentum. At present, the price is trading near 77,279 while remaining above support at 76,197. According to the chart structure, the main scenario assumes completion of the current downward impulse around 76,197, followed by the formation of a consolidation range above this level.
The rise from the June base at 57,827 to the August high at 82,126 formed a completed upward impulse, after which the market exited the accelerated section of the ascending channel. The current structure is more consistent with the development of an Elliott-wave corrective sequence: local recoveries are still forming lower highs, so the 79,155–82,126 area acts as the invalidation zone for the immediate bearish bias.
Within the correction, a recovery towards 77,607 is possible, and with stronger momentum, towards 79,155. While the price remains below this area, the priority stays with a continuation of the decline. After the corrective leg is complete, a new wave of pressure towards 76,197 is expected. A breakout and consolidation below this support would open the way towards 72,289 and then 68,292. A return above 79,155 would weaken the bearish scenario and create conditions for another test of 82,126.
BTCUSD forecast scenario
Trading scenario: SELL
- Price at the time of writing: 77,279
- Entry price: 77,274
- Stop Loss: 79,155
- Take Profit: 72,289
- Risk-to-reward ratio: 1:3
The trade idea is valid until 8:00 on 21 September 2026 (server time, UTC+3).
Editors’ picks
 EURUSD forecast 2026–2027: technical analysis, price levels & predictions
EURUSD has recovered from the July lows and is trading near 1.1545 — back in bullish territory. The pair has reclaimed EMA65 on the daily, formed a bullish EMA crossover on H4, and the US-eurozone GDP gap has narrowed sharply (US 1.5% vs eurozone 1.0%). Goldman Sachs and Deutsche Bank both now target 1.2500 by year-end. A confirmed close above 1.1700 opens the path to 1.1805. We break down the key levels, three trading scenarios, and what the unprecedented 9-3 FOMC dissent vote means for EURUSD.
 Gold (XAUUSD) forecast 2026: technical analysis, price levels & predictions
Gold has reversed its downtrend and is trading near 4,360 USD, back above both EMA65 and EMA200. ETF flows turned positive in July with 3 billion USD of net inflows, and central banks bought 288.9 tonnes in Q2 — up 62% year-on-year. A breakout above 4,500 USD opens the path to 4,855 USD and the 5,597 USD all-time high. We break down the key levels, three trading scenarios with entry triggers, and what J.P. Morgan, Deutsche Bank and Goldman Sachs are forecasting for gold in 2026.
Forecasts presented in this section only reflect the author’s private opinion and should not be considered as guidance for trading. RoboForex bears no responsibility for trading results based on trading recommendations described in these analytical reviews.