
Weekly technical analysis and forecast (28 September–2 October 2026)
Week: 28 September to 2 October 2026. Charts dated 25 September 2026.
In this weekly technical analysis, we examine the key chart patterns and price levels for EURUSD, USDJPY, GBPUSD, AUDUSD, USDCAD, gold (XAU/USD), US 500, and Bitcoin (BTCUSD) to forecast market developments for the week ahead (28 September–2 October 2026).
Weekly forecast in brief
- Seven of the eight trade ideas are SELL scenarios: EURUSD, USDJPY, GBPUSD, AUDUSD, gold, US 500 and BTCUSD. USDCAD is the only BUY idea.
- Most of the week’s volatility is expected around the RBA decision on 29 September, the US PCE price index on 30 September and the US employment report on 2 October.
- The Federal Reserve raised its rate range to 3.75–4.00% on 16 September, and the US dollar keeps the advantage in most pairs.
Major technical levels to watch this week
Support and resistance levels
28 Sep to 2 Oct 2026Weekly trade ideas at a glance
Trade ideas for the week
28 Sep to 2 Oct 2026| Instrument | Scenario | Entry | Stop Loss | Take Profit | Risk / reward |
|---|---|---|---|---|---|
| EURUSD | Sell | 1.1388 | 1.1415 | 1.1223 | 1:2.37 |
| USDJPY | Sell | 158.68 | 159.25 | 157.78 | 1:1.58 |
| GBPUSD | Sell | 1.3213 | 1.3295 | 1.3057 | 1:1.90 |
| AUDUSD | Sell | 0.7009 | 0.7079 | 0.6910 | 1:1.40 |
| USDCAD | Buy | 1.4148 | 1.4026 | 1.4319 | 1:1.40 |
| Gold (XAU/USD) | Sell | 4,256 | 4,305 | 4,200 | 1:1.14 |
| US 500 | Sell | 7,702 | 7,735 | 7,646 | 1:1.70 |
| BTCUSD | Sell | 84,070 | 84,950 | 82,666 | 1:1.60 |
Key economic events this week
- Tue29SepReserve Bank of Australia rate decision (AUDUSD)Canada July GDP (USDCAD)
- Wed30SepUS personal income and spending, including the August PCE price index (USD pairs, gold, US 500, BTCUSD)Australia August Consumer Price Index (AUDUSD)UK second-quarter GDP (GBPUSD)US ADP data (USDJPY)
- Thu1OctUS manufacturing ISM (USDJPY)
- Fri2OctUS employment report (EURUSD, USDJPY, GBPUSD, USDCAD)Preliminary eurozone inflation (EURUSD)
EURUSD forecast: sellers in control below 1.1409
EURUSD fundamental analysis
At the start of the new week, the fundamental backdrop for EURUSD remains mixed, but the US dollar retains the advantage for now. The European Central Bank raised its three key interest rates by 0.25 percentage points on 10 September, taking the deposit rate to 2.50%, as the energy shock keeps inflation above target. The latest data confirmed that annual eurozone inflation accelerated to 3.2% in August.
At the same time, business activity improved noticeably in September: the preliminary eurozone composite PMI rose to 53.1, while Germany’s Ifo business climate index came in above expectations. This limits the scope for a sharp weakening of the euro.
On the other hand, the Federal Reserve also raised the rate by 0.25 percentage points on 16 September to a range of 3.75–4.00%, highlighting resilient domestic demand and elevated inflation.
A strong US PMI reading for September, which reached 58.4, and rising US bond yields are supporting the dollar. During the week of 28 September–2 October, market attention will focus on US personal income and spending data and the PCE price index on 30 September, while the US employment report and preliminary eurozone inflation will be released on 2 October. These releases could sharply change expectations for the future policy paths of the Fed and ECB.
Geopolitics remains an additional risk factor: high energy prices are increasing inflation pressure in both Europe and the US, but higher import costs are a more sensitive constraint for the eurozone. Therefore, even if the ECB maintains a restrictive tone, the euro could remain under pressure if US data confirm resilient demand. Weaker US data, by contrast, could temporarily push the pair back above 1.1409 and extend the correction towards 1.1465 before the main downward move resumes.
EURUSD technical analysis
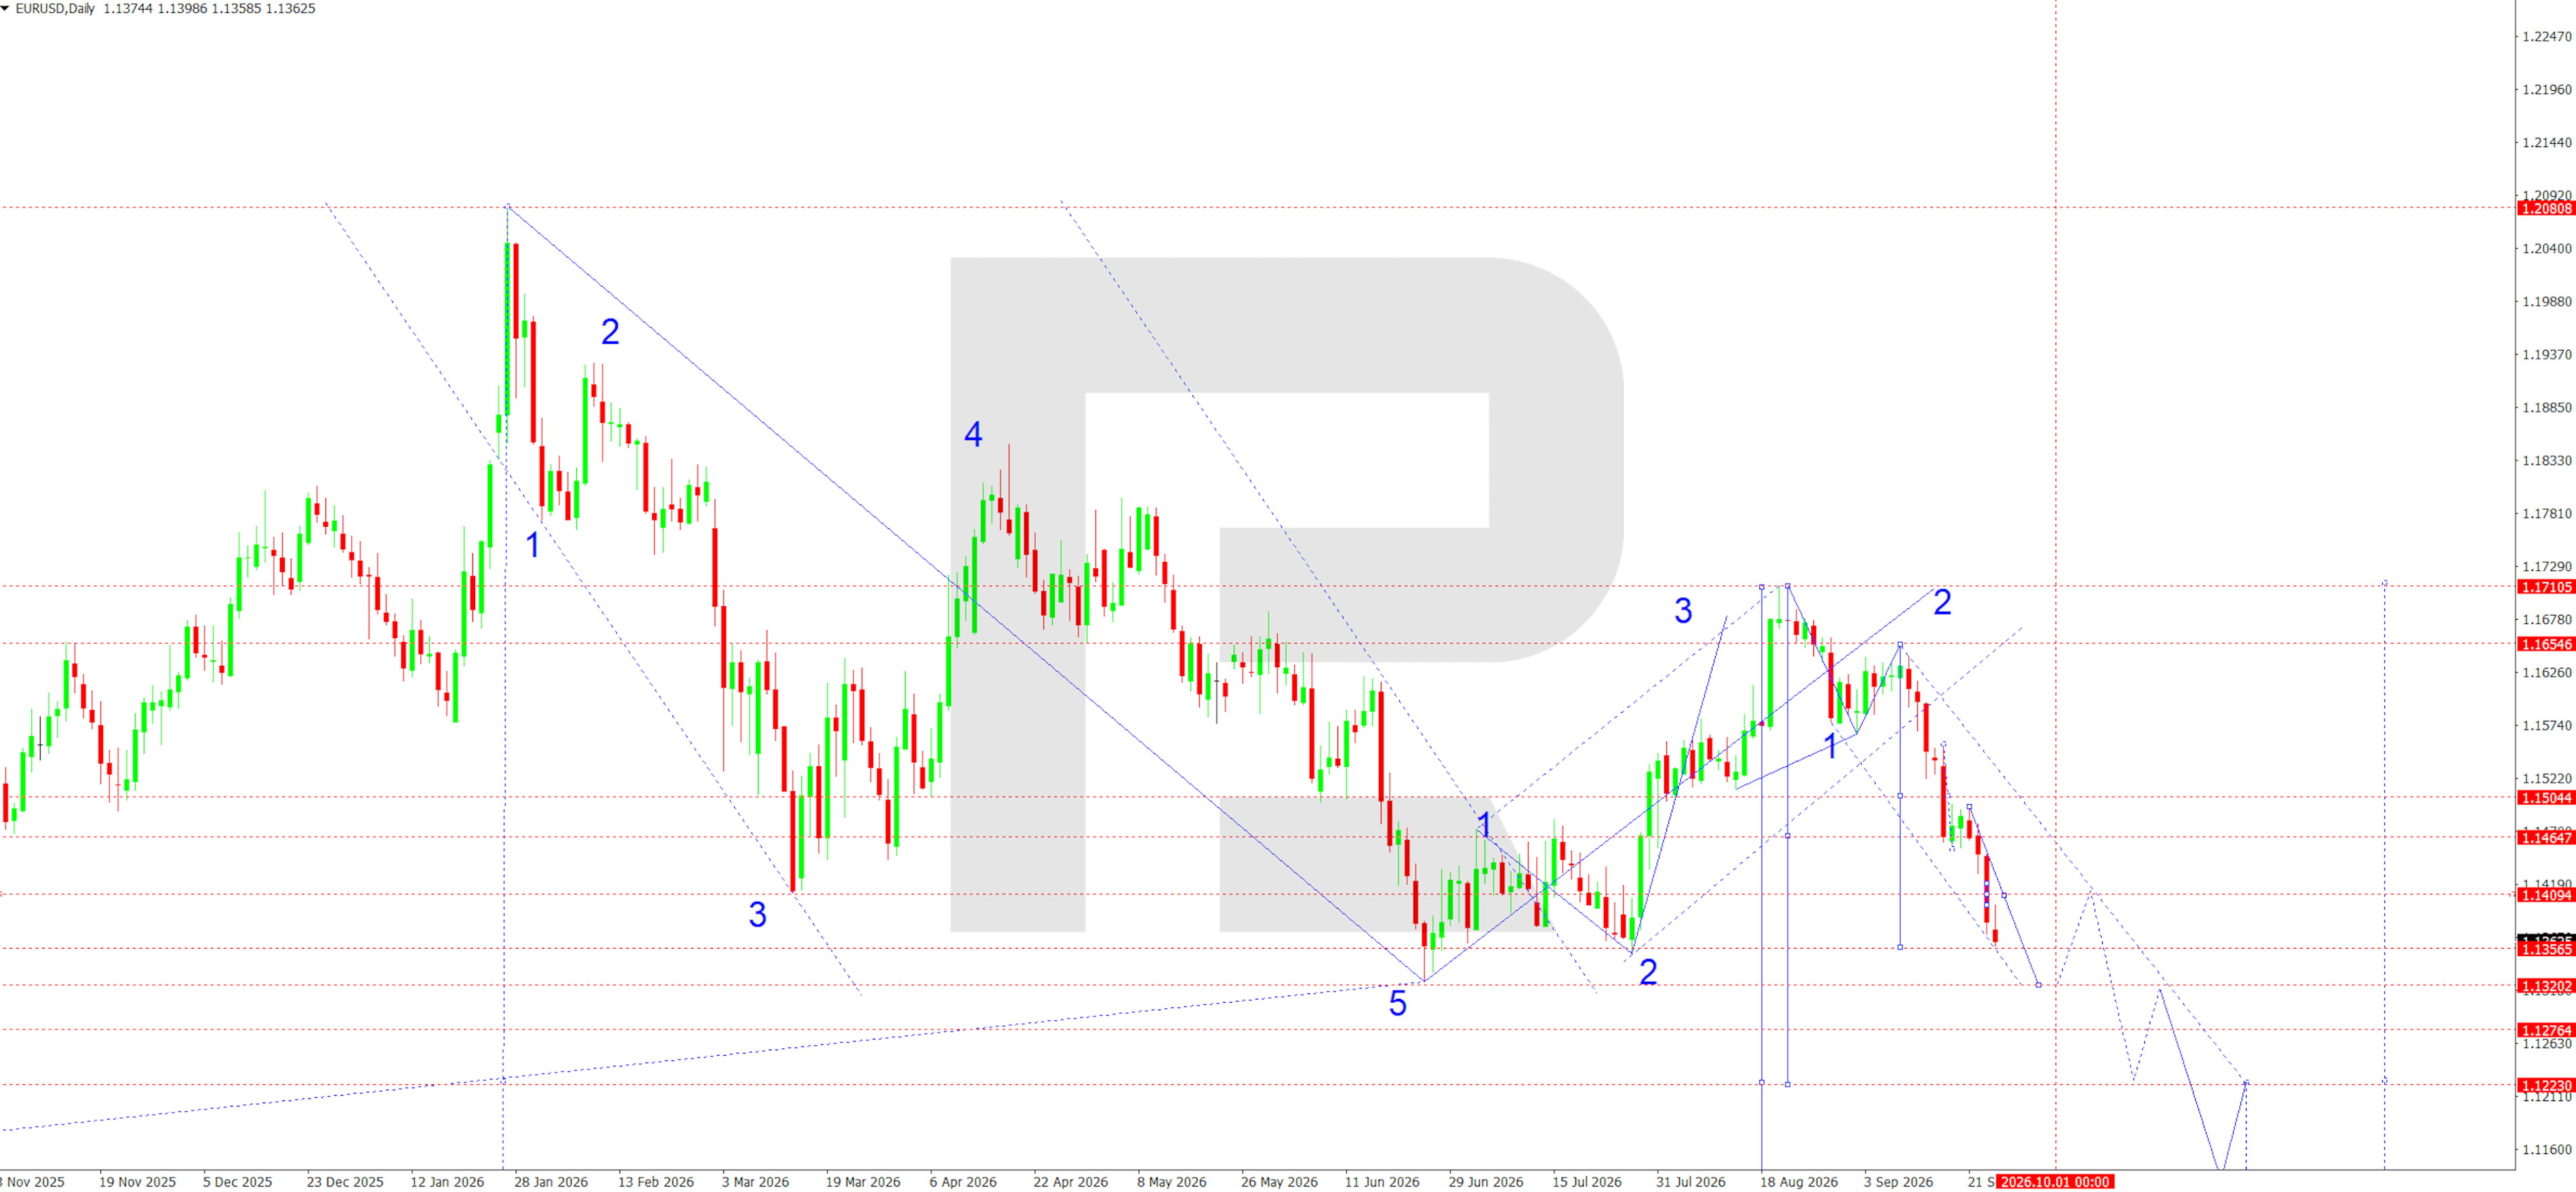
On the daily chart, the downward structure remains intact. After completing a corrective rise into the 1.1655–1.1711 area, the pair formed a sustained downward impulse and reached the local target around 1.1360. Within the current wave, a pivot point emerged at 1.1409, around which an intermediate range had previously formed. While the price remains below this level, priority remains with a continuation of the decline.
At the start of the week, a technical correction towards 1.1409 cannot be ruled out. A return above 1.1465 would weaken the bearish scenario and create room for a deeper correction. The base-case scenario remains the completion of the pullback in the 1.1409–1.1465 zone, followed by a resumption of the decline. The nearest local target is at 1.1320.
A breakout below this support would open the way towards 1.1276, while the main target of the current downward structure remains 1.1223. Therefore, the main trend for the week is assessed as downward, with corrective rises viewed primarily as selling opportunities.
EURUSD trade idea
USDJPY forecast: dip towards 157.78, then 160.22 in focus
USDJPY fundamental analysis
The fundamental backdrop for USDJPY remains mixed. The Federal Reserve raised the rate by 0.25 percentage points in September to a range of 3.75–4.00% and indicated its readiness for further tightening as inflation remains elevated. The strong US labour market in August provides additional support to the US dollar: nonfarm payrolls increased by 162,000, unemployment remained at 4.1%, and average hourly earnings growth was 3.1% year-on-year.
During the week, the market will be particularly sensitive to ADP data and the PCE index on 30 September, the manufacturing ISM on 1 October, and the official employment report on 2 October. Strong readings could revive demand for the US dollar and push US bond yields higher.
The interest-rate differential continues to favour the US dollar, so sustained yen strengthening would require either a more restrictive BoJ path or weaker US data. At the same time, lower oil prices reduce imported inflation pressure on Japan, while another surge in energy prices would worsen the trade balance again and could limit yen gains. Yield and oil dynamics will therefore remain important cross-market reference points. The market also remains highly sensitive to intervention risks.
The Bank of Japan has also tightened policy, raising the rate to 1.25%, the highest level in several decades. However, the yen did not receive sustained support after the decision, as the market did not see an unambiguous signal of a rapid continuation of the cycle. At the same time, BoJ officials retain the option of further increases if underlying inflation accelerates. Japan’s core inflation was 1.7% year-on-year in August, remaining close to the target. The risk of currency intervention remains an additional factor for the yen, especially if USDJPY sharply returns to the 160.00 area or above.
USDJPY technical analysis
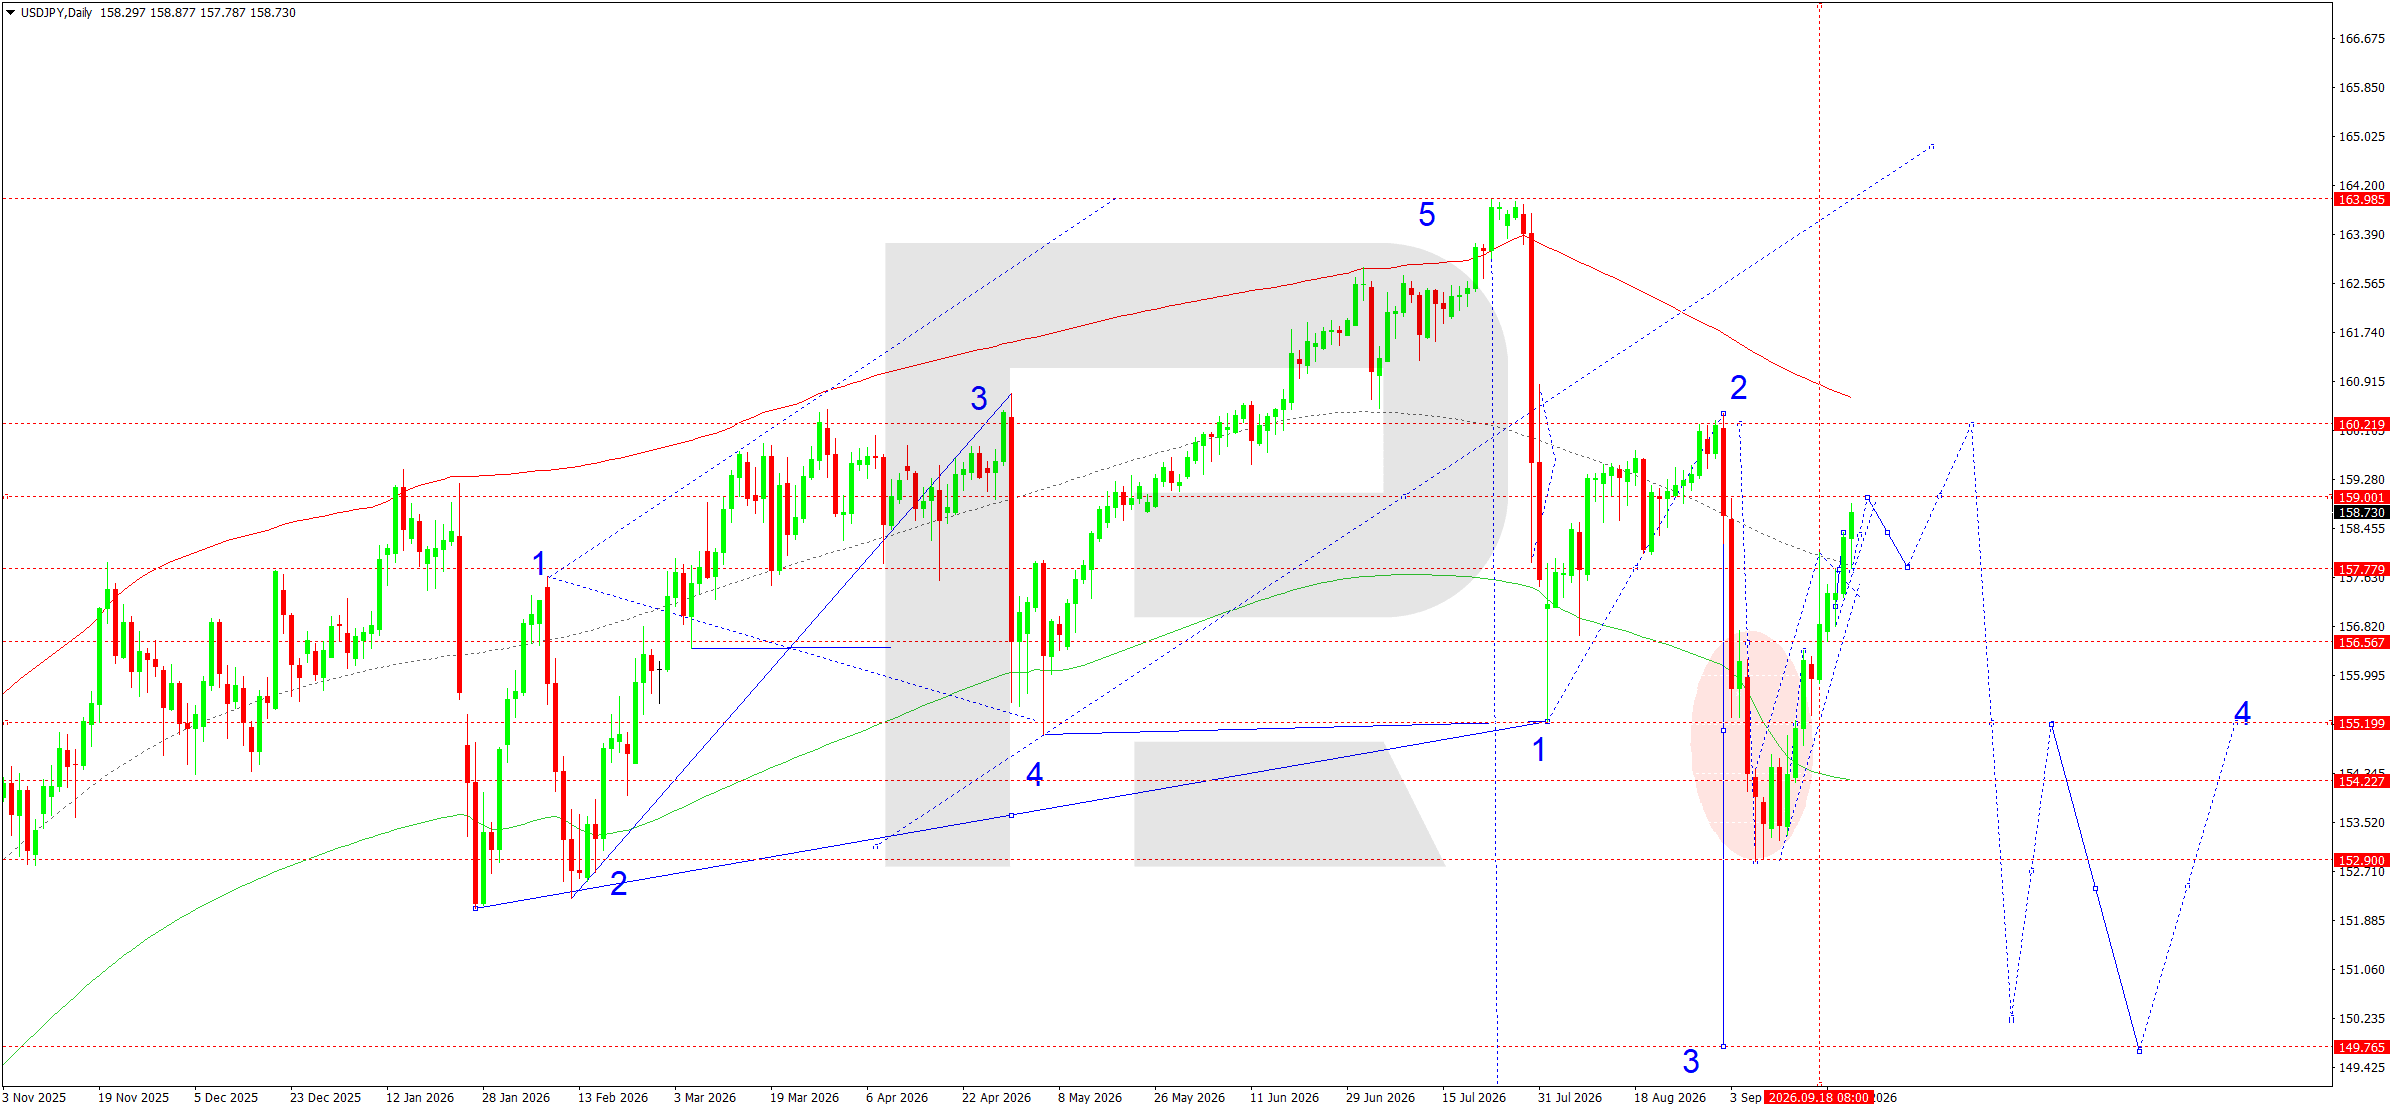
On the daily chart, the pair completed a recovery wave with a rise towards 159.00 and is now forming consolidation directly below this resistance. After the sharp decline from 163.98 towards 152.90, the market formed a sustained corrective impulse, although the current structure indicates the probability of an intermediate pullback.
The nearest downside target is 157.78. This level is also an important support for the current upward leg and an area from which the next upward impulse could begin. If 157.78 holds, the main scenario after the correction remains a move towards 159.00 and then 160.22. Consolidation above 160.22 would confirm the continuation of the recovery and open the way towards higher resistance levels.
If the price breaks below 157.78 and consolidates beneath it, pressure would increase towards 156.57 and 155.20. Therefore, the local weekly scenario assumes an initial decline, followed by a likely resumption of growth towards the main target at 160.22.
USDJPY trade idea
GBPUSD forecast: downtrend targets 1.3057
GBPUSD fundamental analysis
The fundamental backdrop for GBPUSD at the start of the new week remains predominantly in favour of the US dollar. The Federal Reserve raised the target rate range to 3.75–4.00% on 16 September, highlighting persistent inflation risks. The US composite PMI for September rose to 58.4 from 56.0 in August, reaching its highest level in more than five years, while weekly jobless claims fell to 197,000. These data strengthened expectations of further Fed tightening, supported Treasury yields, and pushed the US dollar to two-month highs. At the same time, a renewed rise in oil prices is increasing inflation risks and demand for the defensive US currency.
The Bank of England kept the rate at 3.75%, although the decision was taken by a 6–3 vote: three Committee members favoured an increase to 4.00%. August inflation was 3.1%, while the September PMI showed slower activity growth alongside stronger price pressure.
Retail sales, which rose by 0.5% in August, were positive for sterling, but this was not enough: on 24 September, the pound fell to an almost three-month low against the US dollar. In the coming week, UK second-quarter GDP data on 30 September and the US employment report on 2 October will be important. Strong US data would keep GBPUSD under pressure, while weaker figures could trigger a corrective rebound.
GBPUSD technical analysis
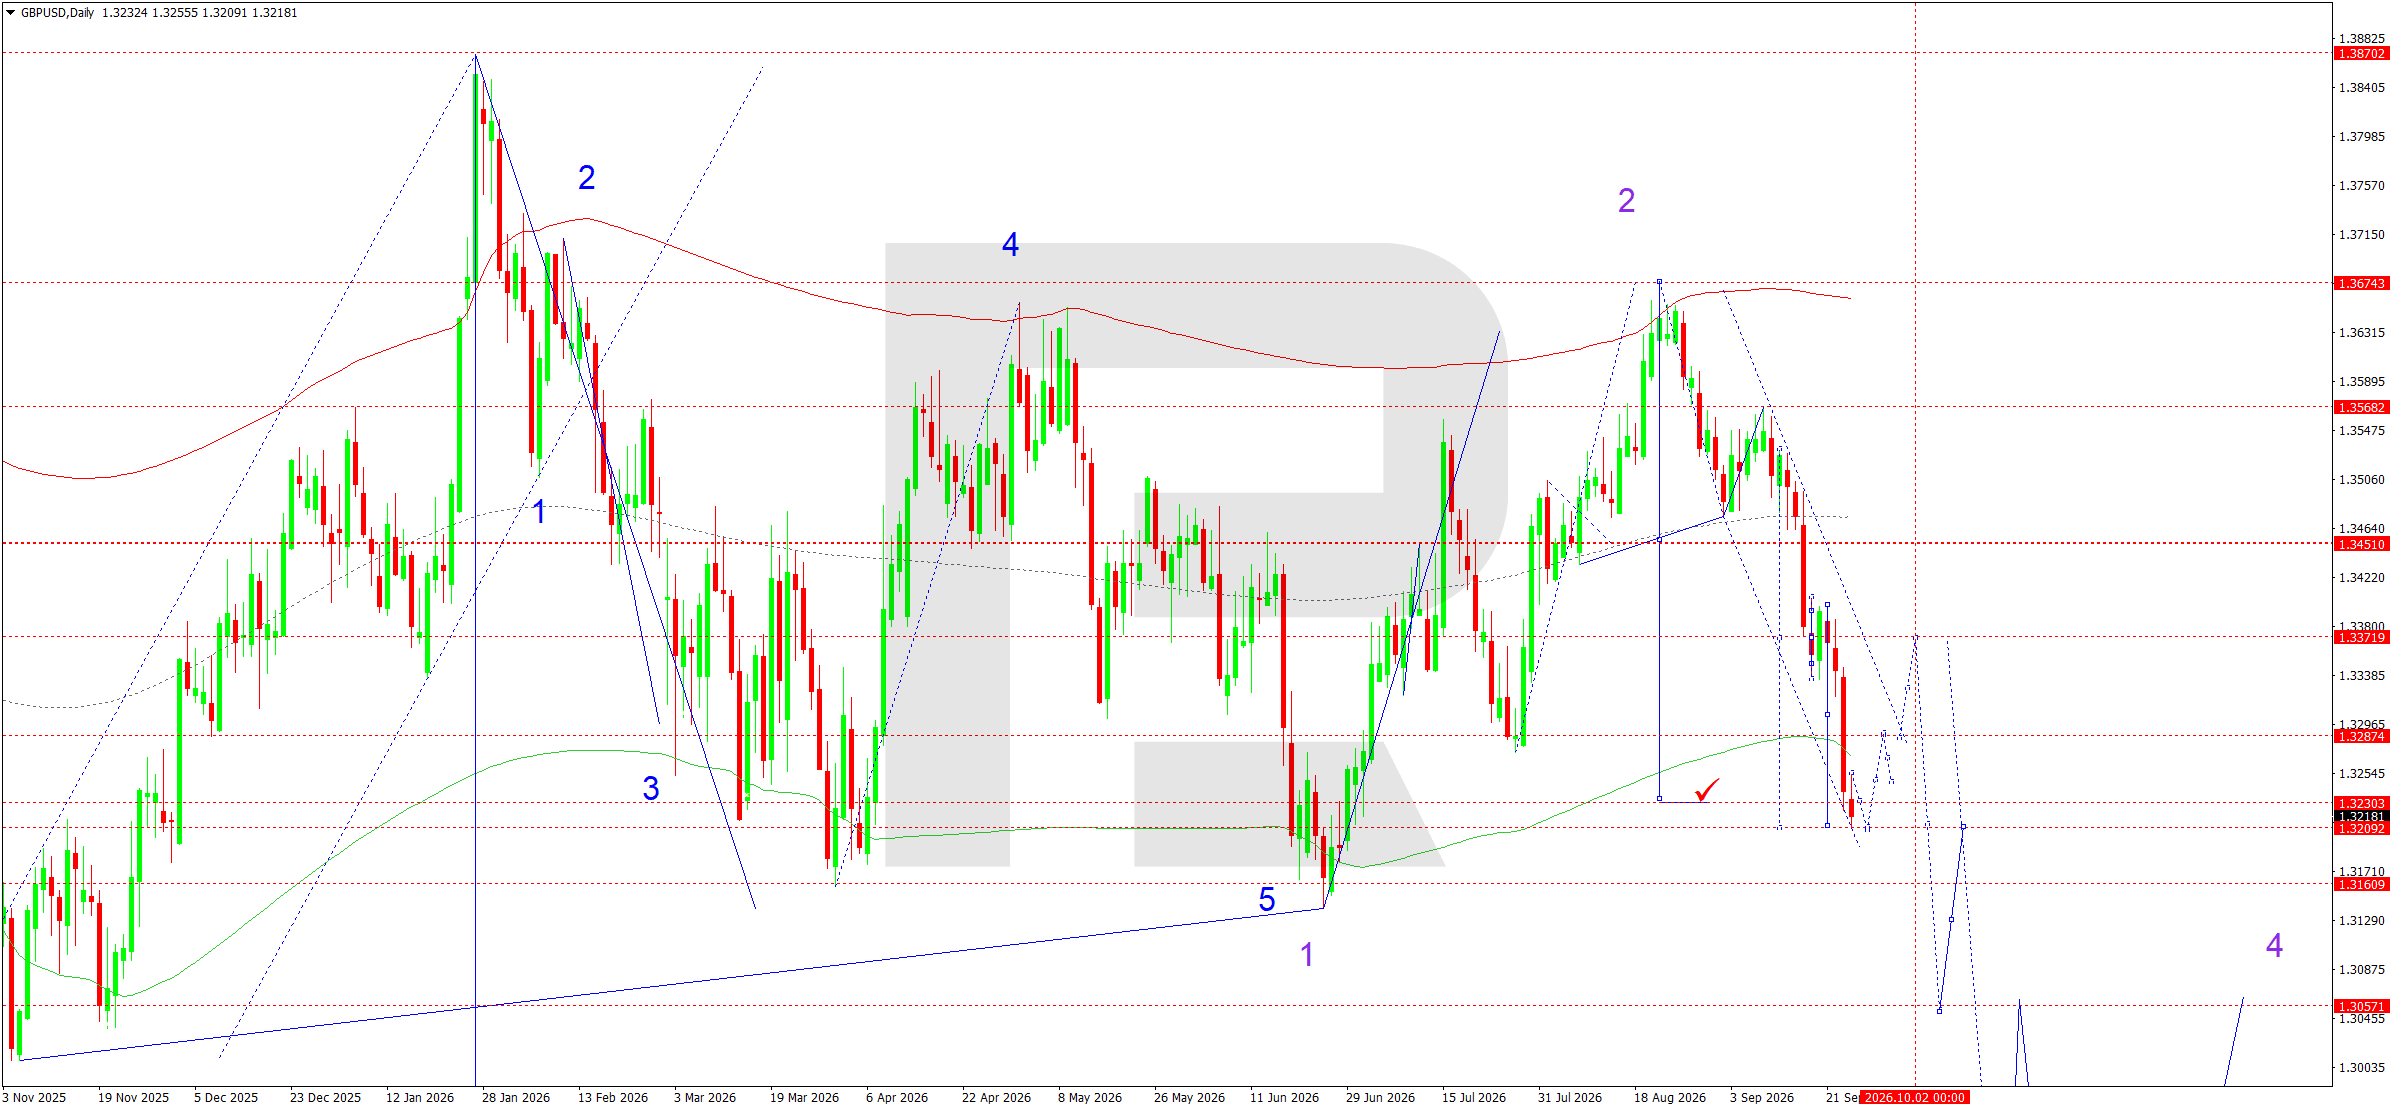
On the daily chart, GBPUSD completed the pivot structure of the current wave around 1.3379 and delivered a downward impulse towards the local target at 1.3200. The main trend remains downward: the price has consolidated below the middle line and continues to move within a descending wave structure. At the start of the week, a range is likely to form above 1.3200–1.3209, with a correction towards 1.3285–1.3287.
This area is the nearest resistance and a potential zone for the corrective phase to end.
After the pullback, the base-case scenario assumes a resumption of selling. A breakout below 1.3209 would confirm the pressure and open the way towards 1.3161.
The next local target is 1.3057, where important daily support and a reference point for the development of the third downward wave are located. Consolidation below 1.3057 could accelerate the bearish cycle; a more distant strategic target remains around 1.2448 if the current external market backdrop persists. A return above 1.3379 would be required to weaken the bearish scenario, while invalidation would only become relevant after consolidation above 1.3451.
GBPUSD trade idea
AUDUSD forecast: RBA decision and 0.7009 in focus
AUDUSD fundamental analysis
AUDUSD enters the new week under pressure from the US dollar, although the fundamental picture remains mixed. The Reserve Bank of Australia will hold its monetary-policy meeting on 29 September. After three rate increases in 2026, the rate stands at 4.35%, while the Bank’s leadership continues to emphasise persistent inflation risks linked to domestic demand and high energy costs.
RBA Governor Michele Bullock said that some inflation risks are probably already materialising, although the outcome of the meeting is not predetermined. At the same time, the latest labour-market data showed unemployment rising to 4.6% in August, while employment increased by 39,500, with the gain driven mainly by part-time jobs. This somewhat weakens the case for further tightening, but the market still prices in a high probability of a rate increase.
Australia’s August Consumer Price Index will be released on 30 September and could sharply change expectations for the RBA’s future path. The US dollar remains supported by the Federal Reserve’s September decision to raise the rate range to 3.75–4.00% amid persistent inflation. China and global risk appetite remain additional factors for the AUD: markets are monitoring US–China trade negotiations, the yuan, and commodity dynamics.
In the US, personal income and spending data, including the PCE price index, will also be released on 30 September, so the middle of the week could be the most volatile period. In China, September’s benchmark lending rates were left unchanged, while a stronger yuan provides some support to Asia-Pacific currencies. However, weak domestic demand in China limits this positive effect for the Australian dollar. The combination of the RBA decision, Australian inflation, and US PCE makes the balance of risks for AUDUSD particularly sensitive to data surprises in the first half of the trading week.
AUDUSD technical analysis
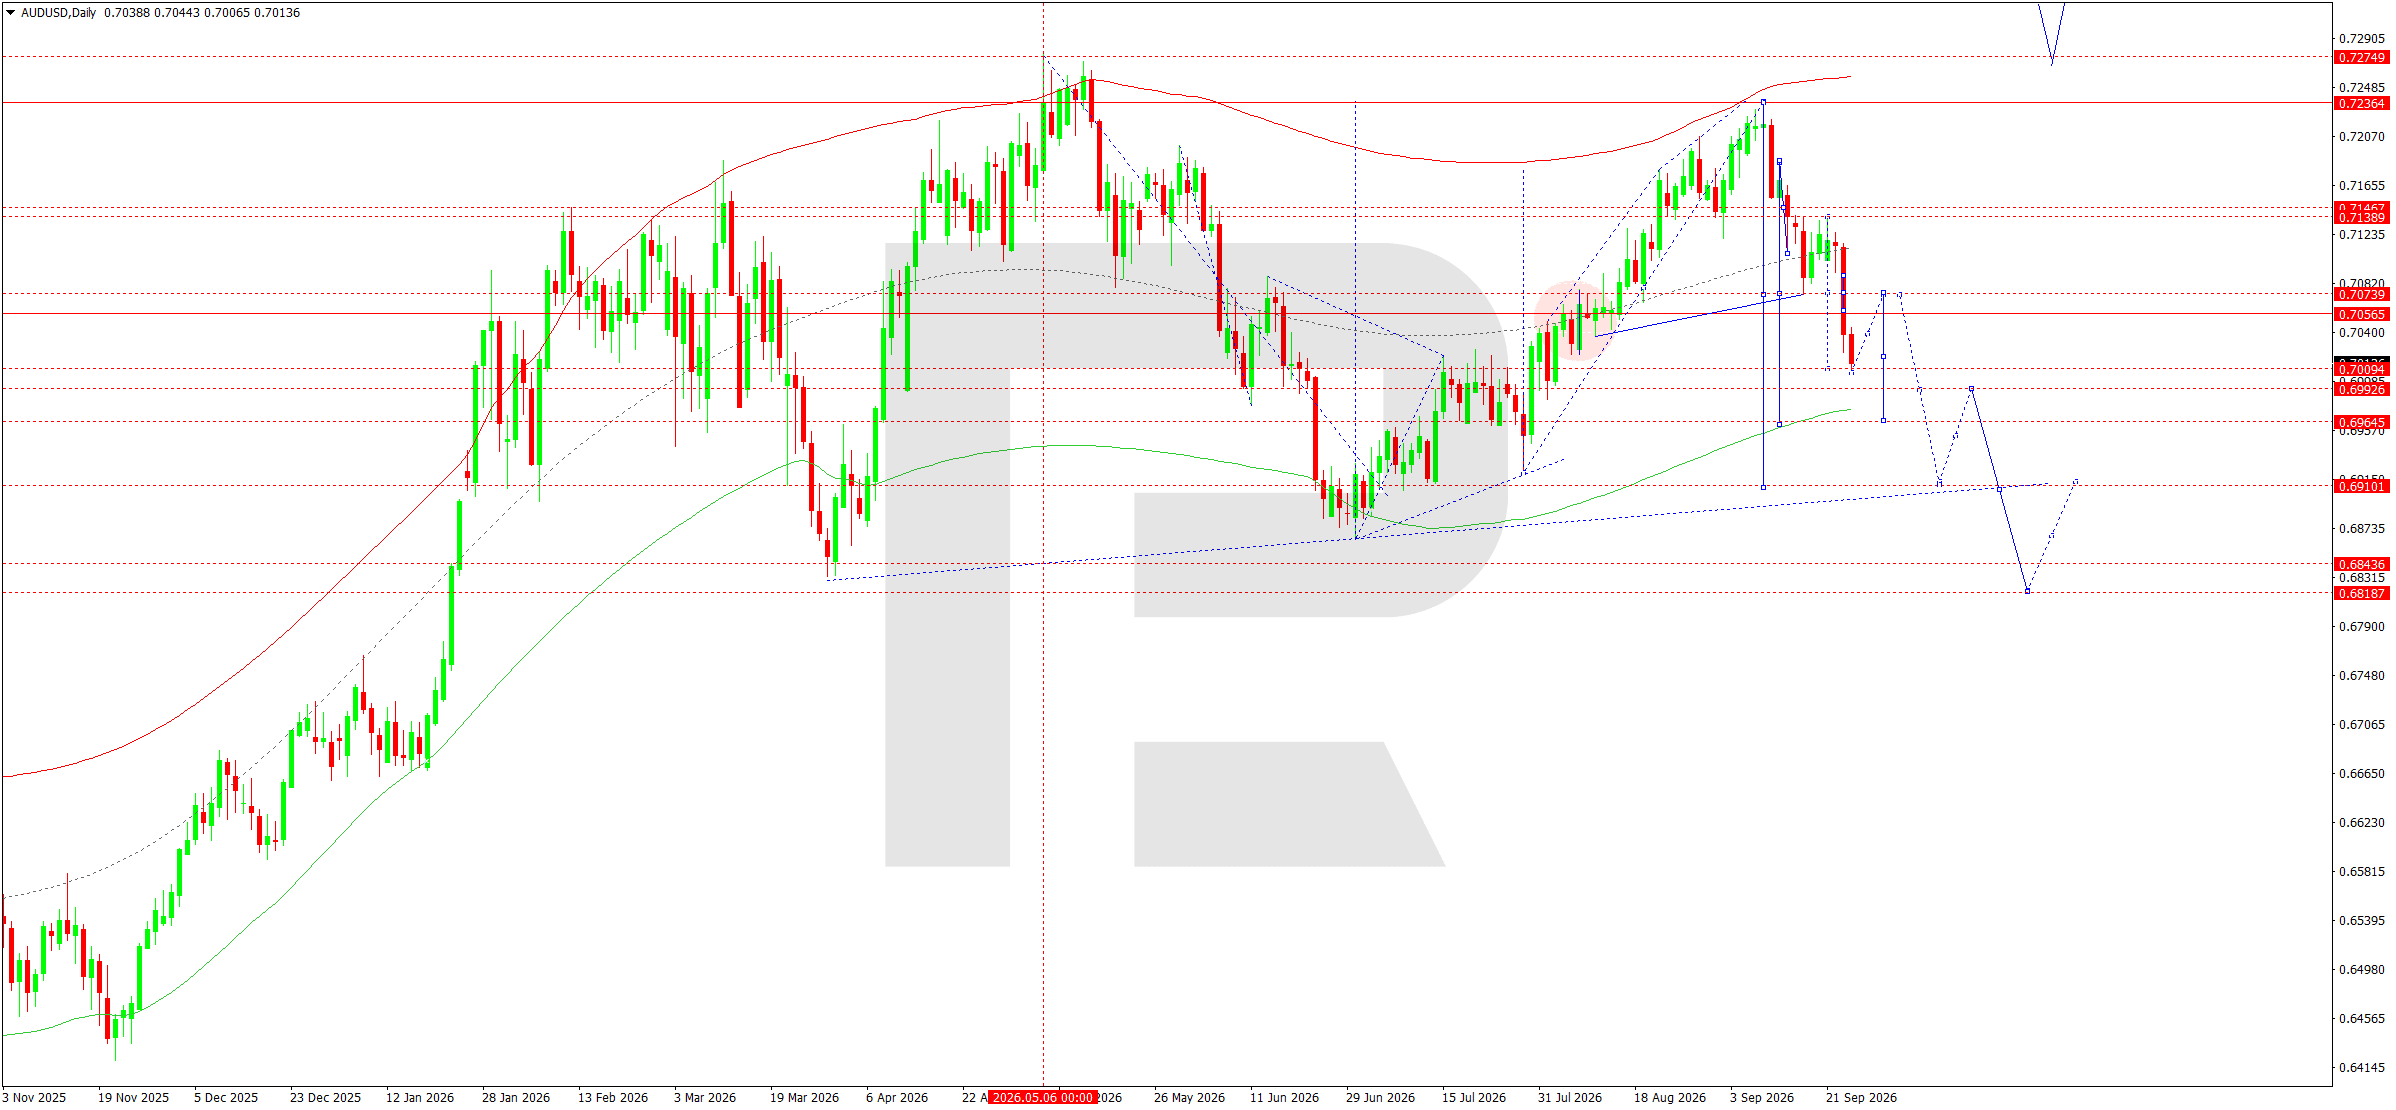
On the daily chart, the main short-term trend is downward. The pair reached the local target of the downward wave around 0.7005 and moved into consolidation above the area reached. The nearest technical objective appears to be the development of a corrective upward wave towards 0.7073. This level coincides with the previous breakout area and could act as resistance during the recovery.
Once the correction is complete, the base-case scenario remains a continuation of the decline. A return below 0.7009 followed by a breakout below 0.6993 would increase selling pressure and open the way towards 0.6965, while the main weekly target is 0.6910. A move below 0.6910 would extend the downside towards 0.6844. The alternative scenario would require consolidation above 0.7073; in that case, the correction could continue towards 0.7139. While the price remains below 0.7073, sellers retain the advantage.
AUDUSD trade idea
USDCAD forecast: uptrend intact above 1.4026
USDCAD fundamental analysis
The fundamental backdrop at the start of the week remains favourable to the US dollar relative to the Canadian dollar. The Federal Reserve raised the target rate range to 3.75–4.00% on 16 September, highlighting persistent inflationary pressure and the resilience of the economy.
At the same time, the Bank of Canada kept the rate unchanged at 2.25% on 2 September, while subsequent comments from policymakers pointed to rising risks to the Canadian economy from US tariffs and trade uncertainty.
Canadian inflation was 3.0% year-on-year in August, but domestic demand appears less resilient: retail sales fell by 0.7% in July, while employment declined by 42,000 in August with unemployment at 6.4%. A wider US–Canada yield differential is adding further pressure on the Canadian dollar.
Oil remains an important offsetting factor, but high volatility in Brent and WTI has failed to provide sustained support for the loonie. In the coming week, attention will shift to Canada’s July GDP on 29 September, US PCE on 30 September, and the US employment report on 2 October.
Strong US data could support further USDCAD gains. In the US, the July PCE index stood at 3.7% year-on-year, with the core reading at 3.3%, so the August release will be critical for expectations about the Fed’s future path. In Canada, the preliminary estimate pointed to virtually zero GDP growth in July, reinforcing the divergence between the cycles. Weak consumption and tariff risks limit the BoC’s room for a restrictive response to inflation. At the same time, WTI oil remains in an elevated price zone, partially easing pressure on Canada’s export currency but not changing the overall balance.
USDCAD technical analysis
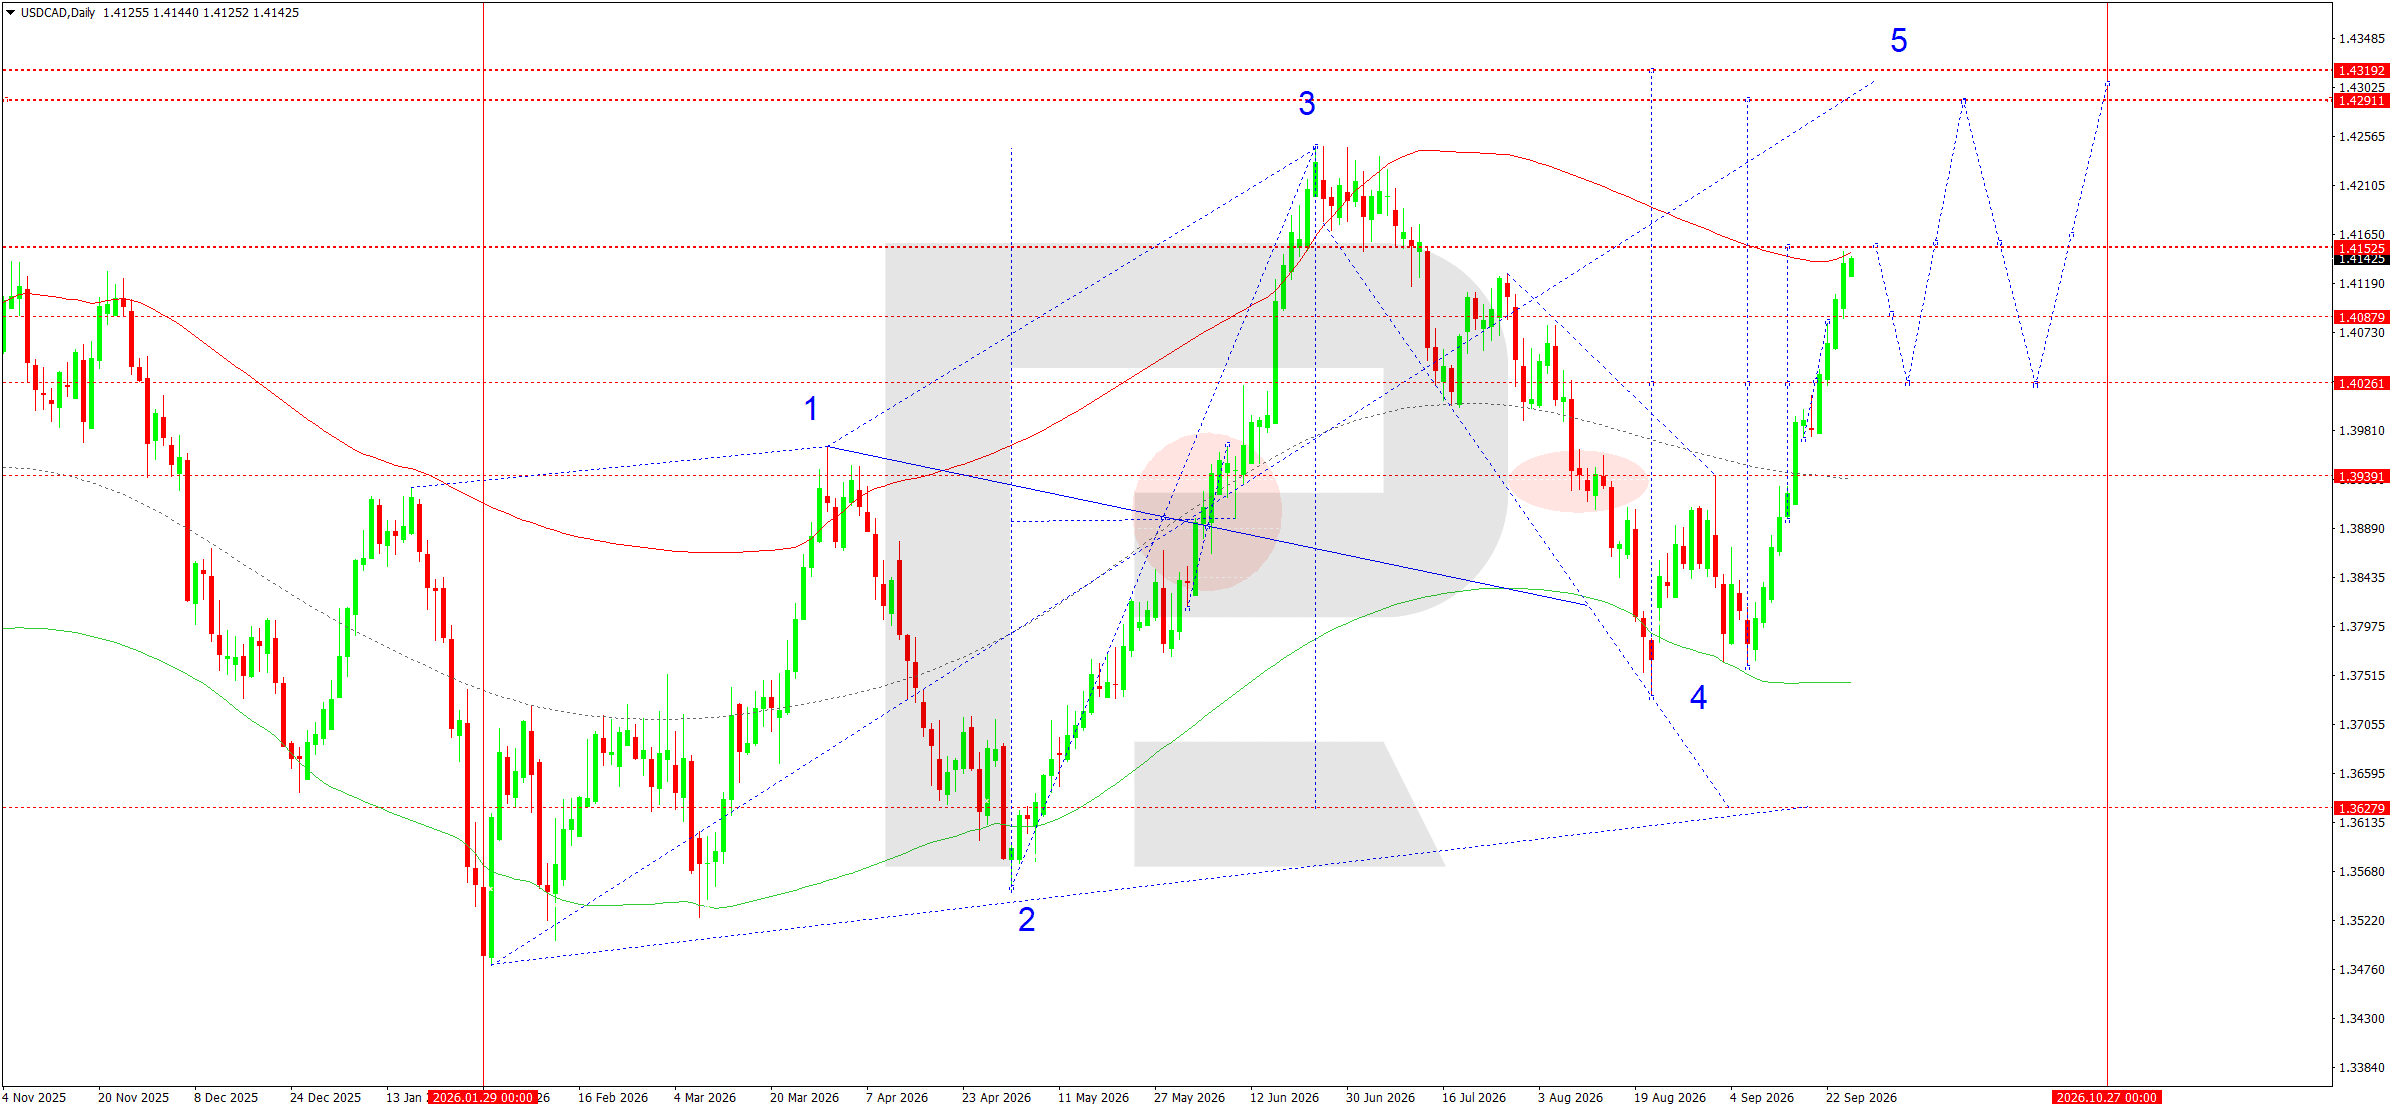
On the daily chart, the upward structure remains intact. After breaking above 1.4026, the pair accelerated its rise and effectively reached the local target at 1.4125, consolidating around 1.4143. The nearest resistance is now 1.4153. Within the wave count, the move from the base of wave 4 is viewed as the formation of upward wave 5. While the price holds above 1.4026, the main trend remains upward.
At the start of the week, consolidation below 1.4153 is likely, followed by a corrective leg towards 1.4088 and, if the pullback extends, towards 1.4026. This level is important as a test from above of the broken resistance. Holding support would allow a trend-continuation pattern to form and the rise to resume towards 1.4291, followed by the main target at 1.4319. A move below 1.4026 would weaken the bullish scenario and open the way towards 1.3939.
The base-case scenario assumes the upward direction will remain intact after a possible correction. Buying remains the priority while the daily structure stays above 1.4026. The weekly target range is 1.4291–1.4319.
USDCAD trade idea
XAU/USD gold forecast: sellers target 4,200
Gold fundamental analysis
Gold enters the new week under pressure from a combination of a strong US dollar, high US bond yields, and more restrictive monetary-policy expectations. The Federal Reserve raised the rate range by 25 basis points to 3.75–4.00% on 16 September, pointing to persistently elevated inflation and the need to return it to the 2% target. Following the decision, Fed officials continued to emphasise inflation risks, supporting expectations of further tightening and increasing the appeal of US dollar assets.
By the end of the current week, the US dollar had risen to two-month highs, while yields on long-dated US Treasuries were reaching multi-year peaks. High oil prices are adding further pressure: rising energy inflation complicates the prospect of rapid Fed easing.
At the same time, geopolitical tensions in the Middle East continue to support demand for gold as a safe-haven asset, so declines may be accompanied by sharp corrective rebounds. As a result, the fundamental balance remains mixed, but sellers retain the short-term advantage: an expensive US dollar and high bond yields increase the opportunity cost of holding the metal.
An important event next week will be the 30 September release of US personal income and spending data, including the PCE inflation index. Stronger inflation could support the US dollar and yields, while signs of easing price pressure could restore demand for gold. Therefore, the market may trade cautiously in the first half of the week, with volatility likely to increase after the data release.
XAU/USD technical analysis
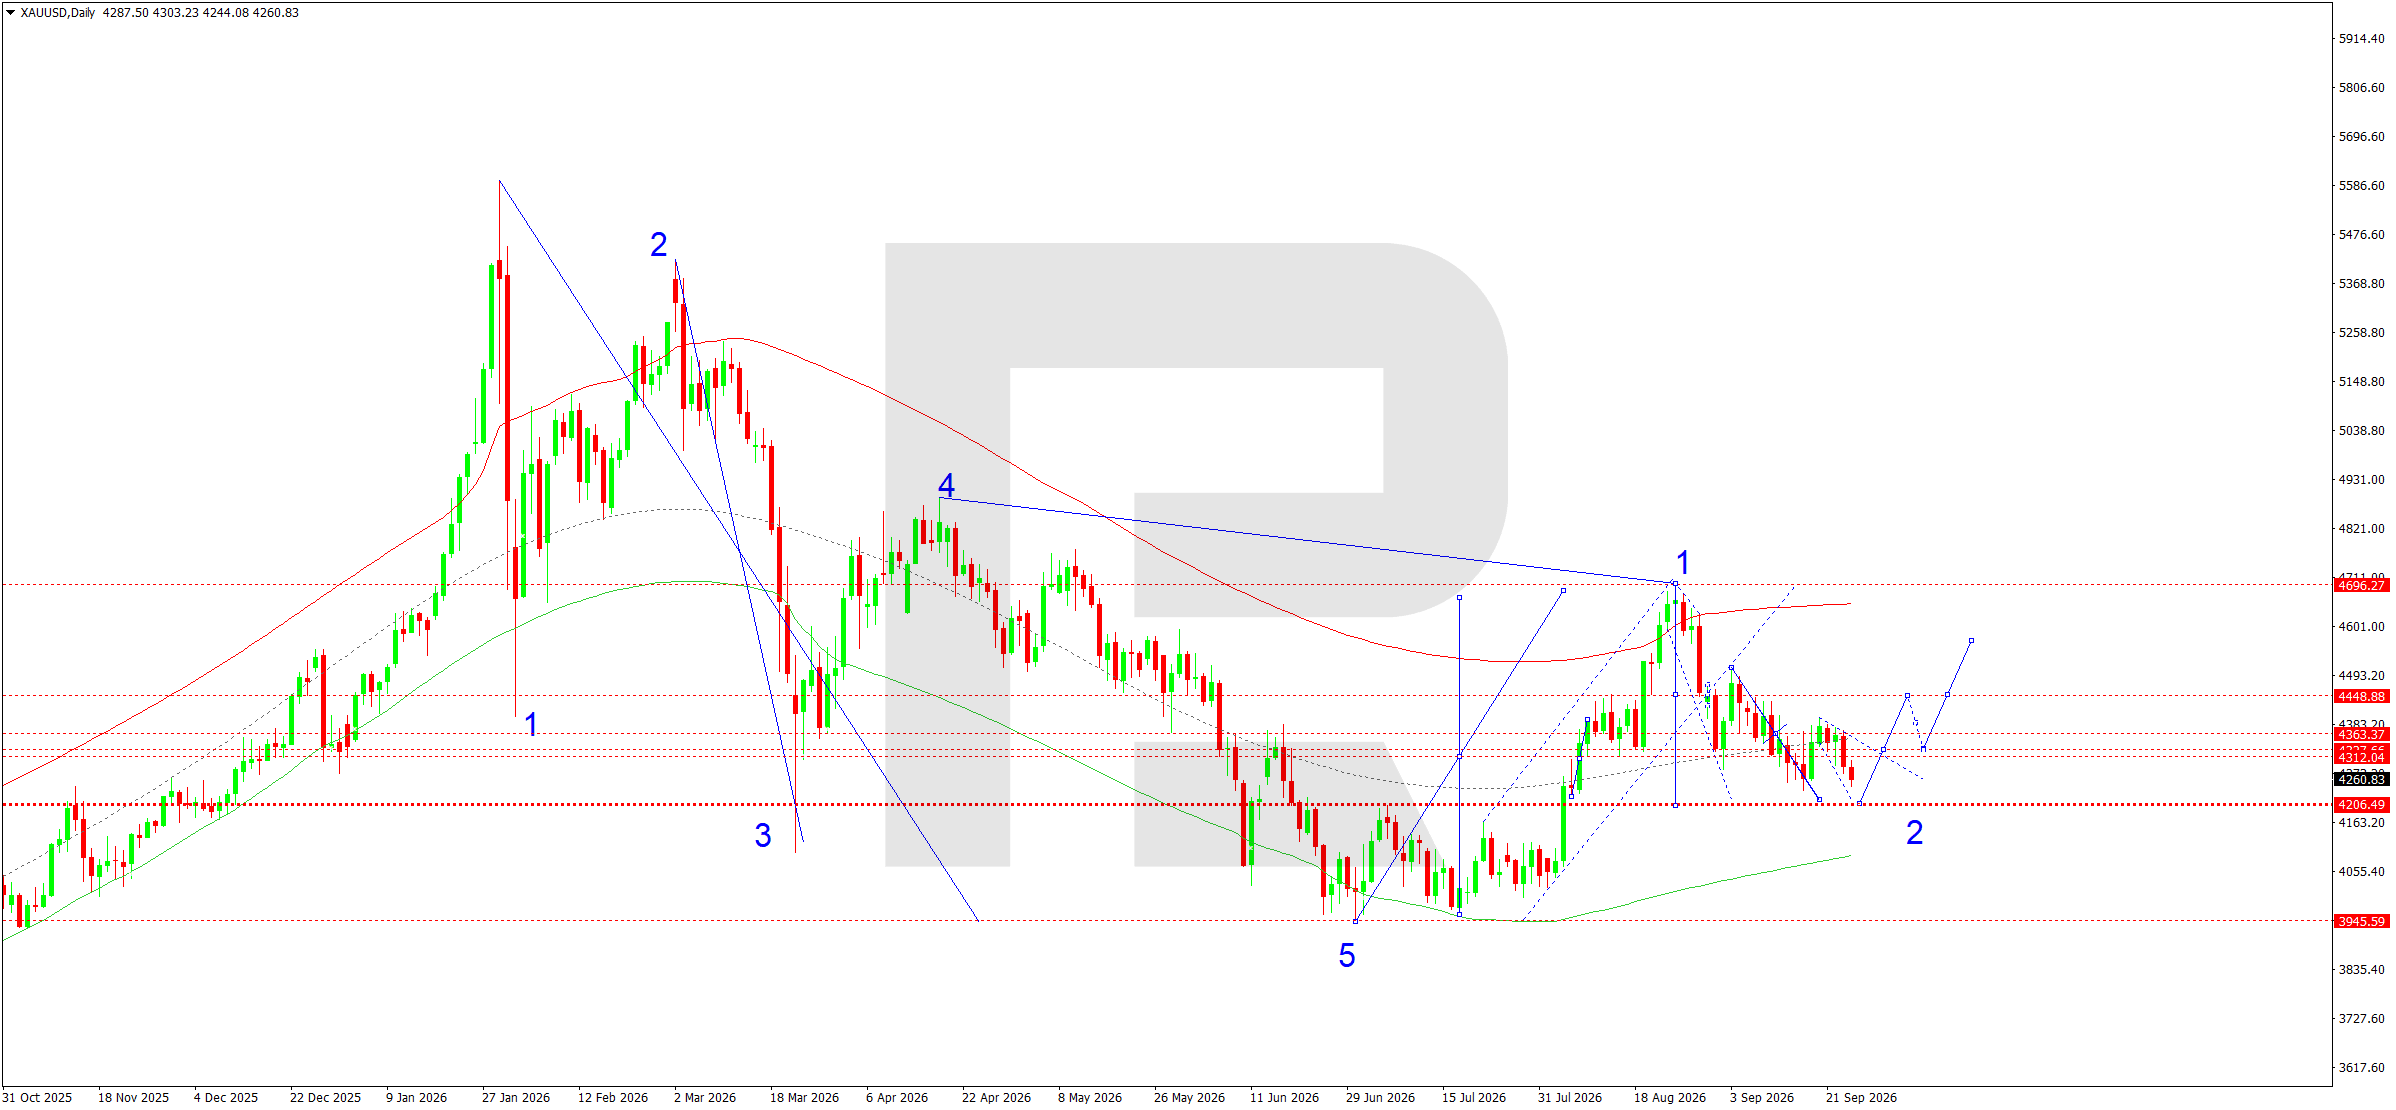
On the daily XAU/USD chart, after completing a large fifth wave around 3,946, the market formed the first upward wave impulse towards 4,696. Corrective wave 2 is now developing. After a local rise towards the 4,399 area, the price moved into consolidation and remains below the 4,312–4,363 zone, preserving the advantage of the scenario for a continued decline.
The structure of the latest candles shows persistent pressure on the lower boundary of the range, while recovery moves have so far failed to establish a consolidation above resistance.
The nearest main target is around 4,206, which coincides with the indicated target at 4,200. Consolidation below this level would increase the risk of an extension towards 3,946. If support at 4,206 holds and the second wave is completed, a new upward leg is likely to form with the first target at 4,449.
A return above 4,363 would be the first technical signal of easing selling pressure, while a breakout above 4,449 would increase the probability of a move towards 4,696. Therefore, the weekly bias remains downward until the 4,200–4,206 area is reached, after which the buyers’ reaction will need to be assessed.
The base-case scenario assumes a continuation of the decline towards 4,200, followed by a search for a base for corrective growth towards 4,449.
XAU/USD trade idea
US 500 forecast: correction towards 7,652 within an uptrend
US 500 fundamental analysis
The fundamental backdrop for US 500 remains mixed: the strength of the US economy supports corporate expectations, but at the same time increases the risk of further monetary tightening. The Federal Reserve raised the rate by 25 basis points on 16 September to a range of 3.75–4.00%, highlighting resilient domestic demand, investment, and employment while inflation remains elevated.
Updated Fed projections allow for restrictive policy to remain in place and for one more rate increase before the end of the year. The bond market is another constraint for equities: the yield on 10-year US Treasuries was around 5.10% on 24 September, raising the cost of capital and pressure on technology companies.
Inflation risks also remain on the commodity side. Higher oil prices and transport costs could sustain price pressure, so the release of the August PCE index on 30 September will be the central macroeconomic event of the week.
At the same time, the economy continues to show resilience: retail sales rose by 1.20% in August, while investment activity related to artificial intelligence and the semiconductor sector continues to support earnings expectations for major companies. Therefore, the base fundamental balance for the coming week remains mixed: high yields and restrictive Fed rhetoric limit the index’s upside potential, but strong demand and corporate investment reduce the likelihood of a deep decline.
The market reaction already shows sensitivity to this combination of factors: after rising towards local highs, the index faced profit-taking as bond yields accelerated and expectations of further rate increases strengthened. While yields remain elevated, the most expensive market segments will remain vulnerable, whereas resilient macroeconomic data could support cyclical sectors.
US 500 technical analysis
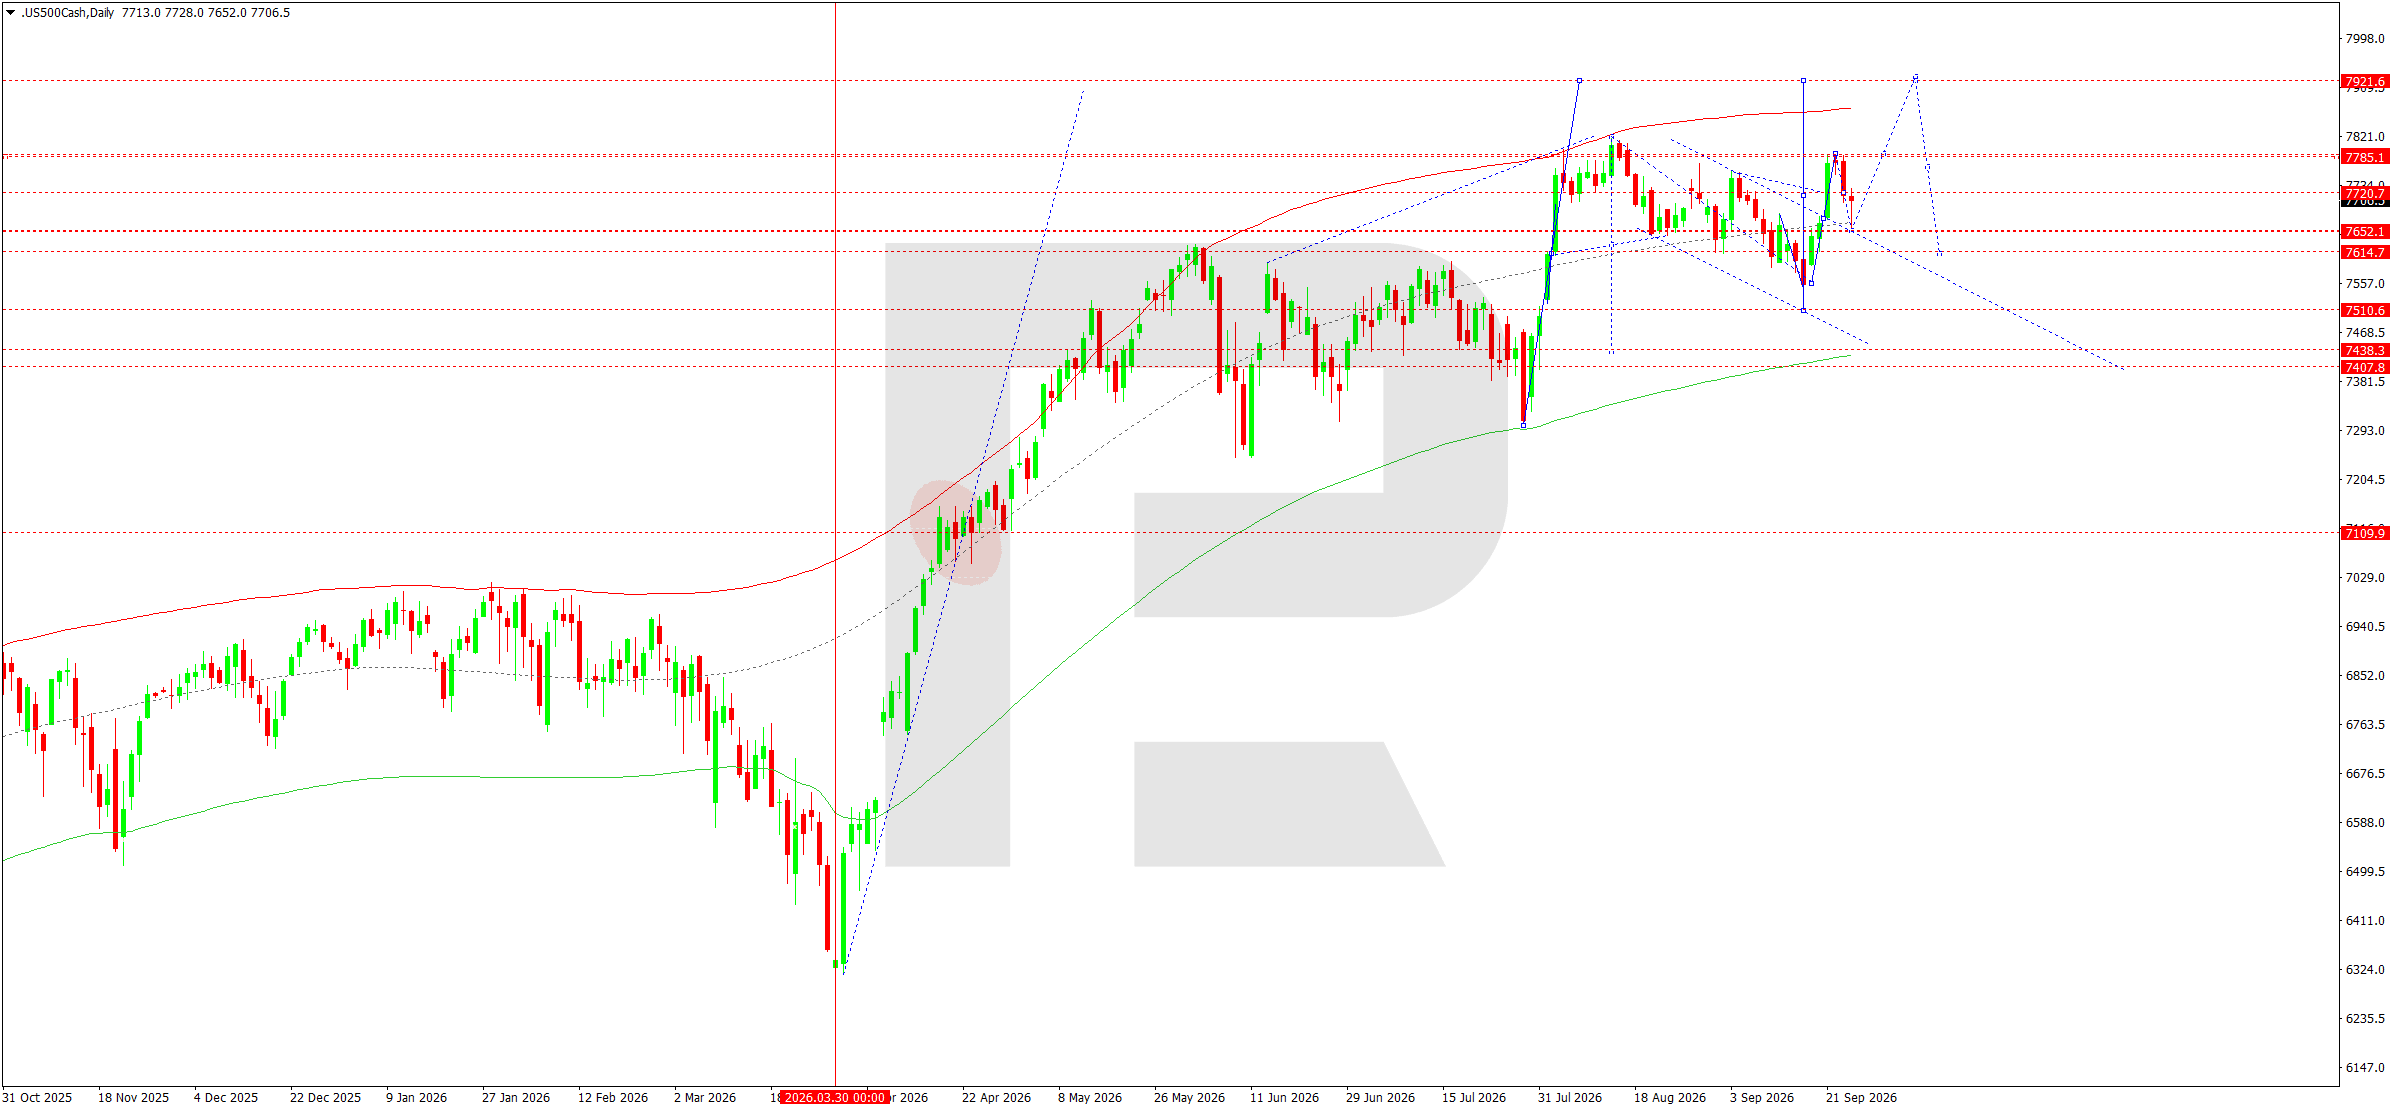
On the daily chart, US 500 retains a medium-term upward structure, although a local corrective wave is forming within it. The price declined towards 7,652 and then recovered to around 7,700, where the nearest resistance area is located. The current configuration indicates a likely consolidation below the 7,721–7,785 area, followed by another test of support at 7,652. If this level is broken, the correction could extend towards 7,615, with the next significant target at 7,511.
At the same time, the main bullish scenario remains valid while the market holds above the 7,511–7,438 area and the ascending moving average. Once the corrective wave is complete, demand is expected to recover and a new upward impulse to form. The first target would be a return towards 7,785, while the main weekly target is 7,922, coinciding with the upper boundary of the projected structure.
Therefore, at the start of the week, priority is given to a local decline towards 7,652–7,646, after which signs of a reversal and continuation of the upward movement should be assessed.
US 500 trade idea
BTCUSD forecast: pullback towards 82,666 before the next leg up
BTCUSD fundamental analysis
Bitcoin enters the final week of September after a sharp recovery from the 76,000–77,000 area and a rise towards 87,000. The fundamental backdrop remains mixed. The Federal Reserve raised the target rate range to 3.75–4.00% on 16 September, highlighting resilient economic activity and persistently elevated inflationary pressure. For the crypto market, this means that the high cost of capital and sensitivity to US bond yields remain in place.
Pressure intensified this week after the yield on 10-year US Treasuries rose above 5%. Strong business activity data, a recovery in oil prices, and weak demand for five-year Treasuries supported higher yields, after which BTC retreated from around 87,300 towards 84,000. At the same time, institutional demand remains notable: US spot Bitcoin ETFs received substantial capital inflows over the past several sessions, helping the market remain well above the September lows.
The fundamental picture therefore combines two opposing factors: expensive liquidity and sustained demand through ETFs. A large options expiry is an additional source of volatility and could amplify moves around the nearest strikes.
ETF dynamics also favour buyers: over the five trading sessions through 23 September, net inflows into US spot funds reached approximately 2.65 billion USD. At the same time, BTC itself failed to hold at the peak after reaching an eight-month high above 87,000. This shows that capital inflows are currently offsetting macroeconomic pressure, but do not eliminate the risk of deeper profit-taking.
BTCUSD technical analysis
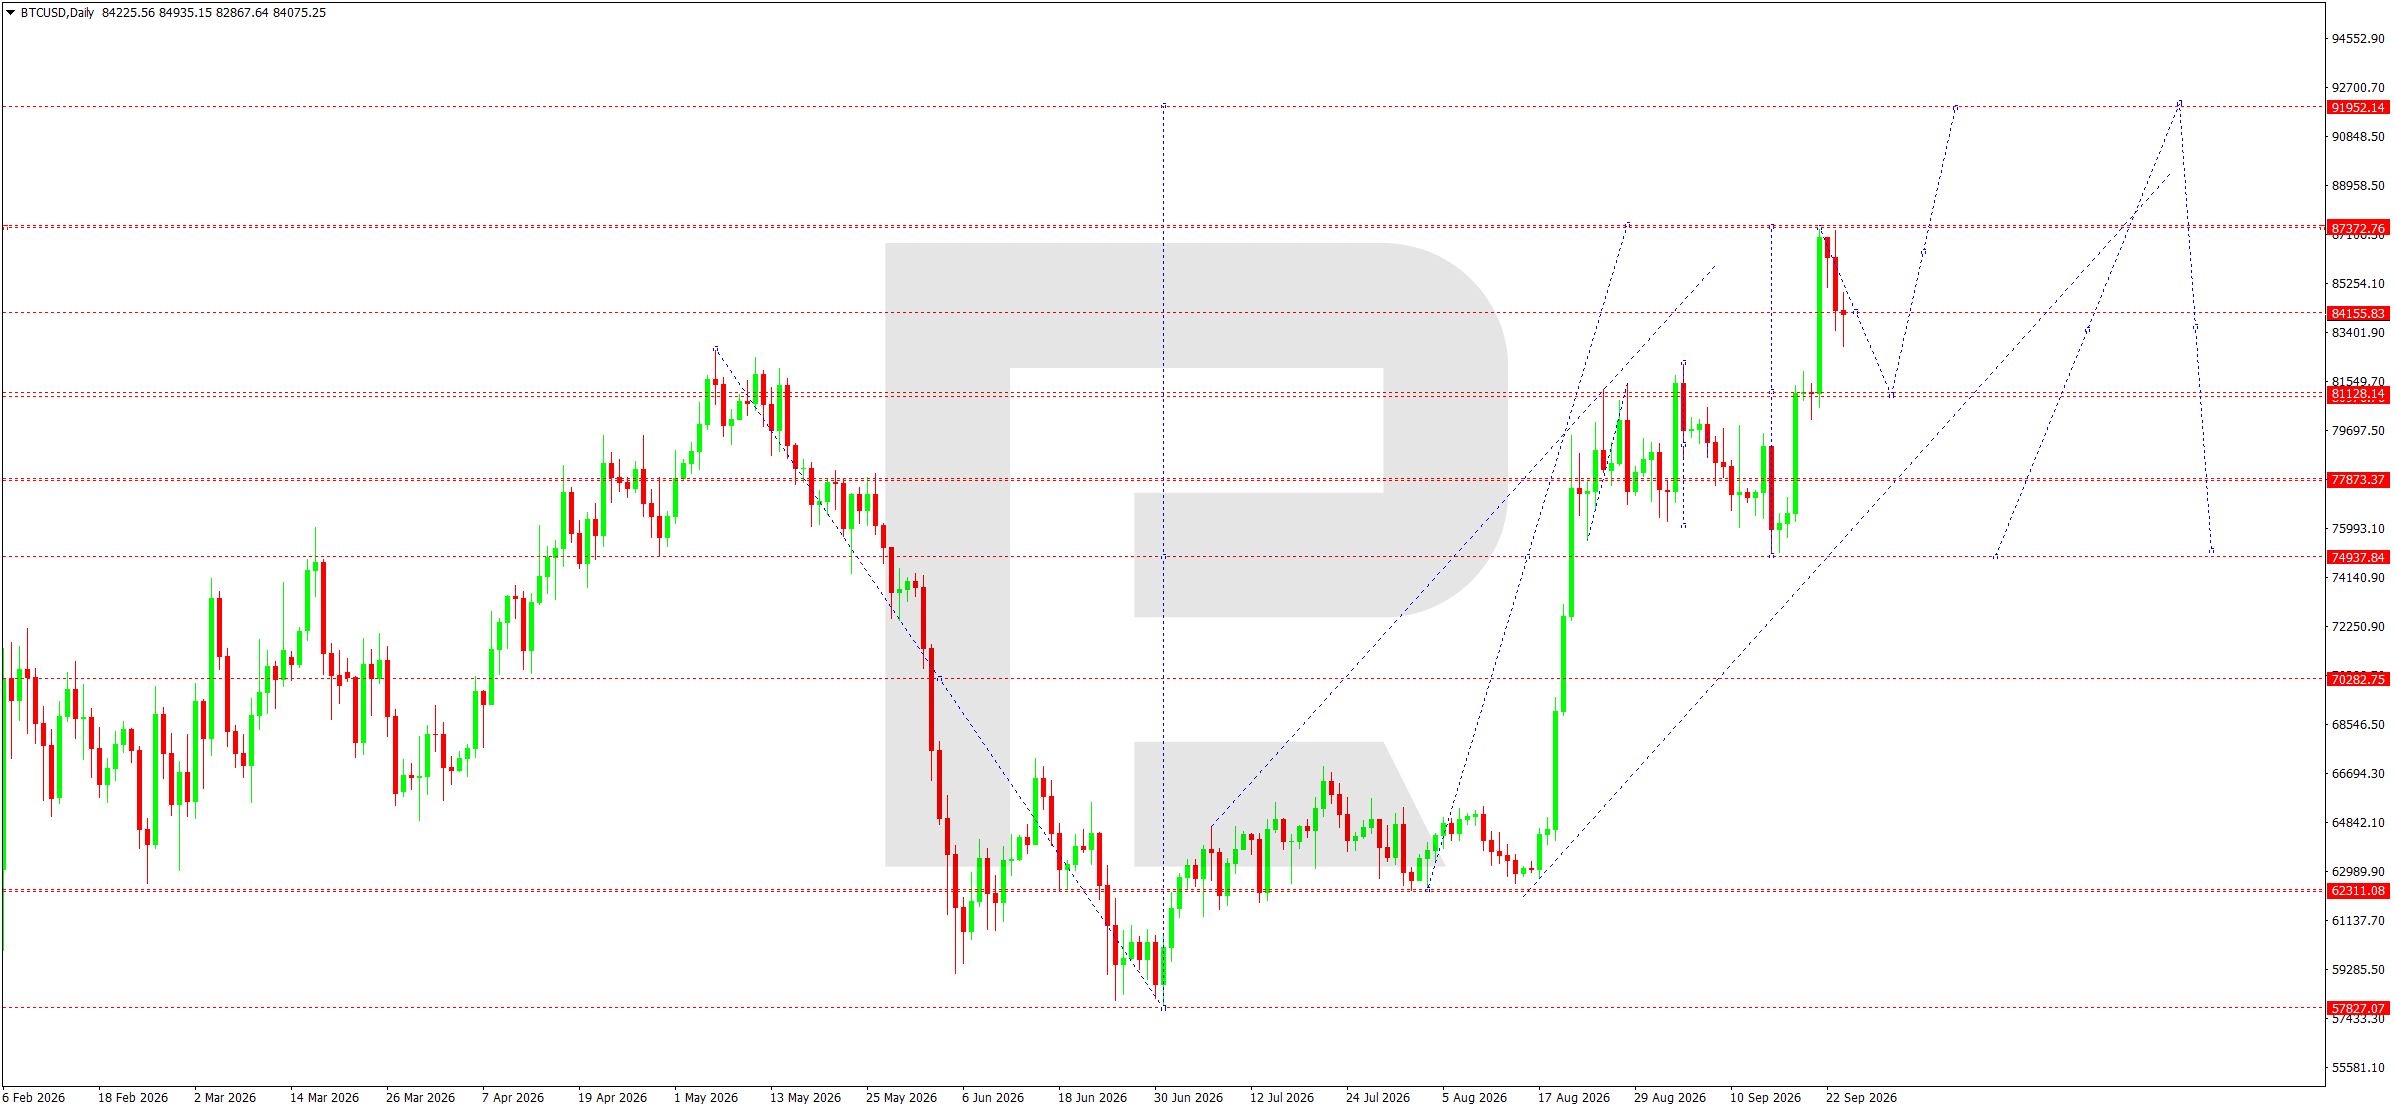
On the daily chart, the market completed an upward impulse towards the 87,373 area and formed a corrective leg towards 84,075. Within the outlined structure, the base-case scenario remains the development of consolidation below the 84,900 zone, with an attempt to continue the decline towards 82,866–82,666. This move is viewed as a local correction within the broader upward recovery from the June low.
The 84,156 zone acts as a pivot: a return above it would weaken sellers, while holding below it would preserve the priority of the corrective move in the first part of the week.
Once the decline is complete, a new upward leg towards 87,373–87,530 is expected to form. Consolidation above this area would open the way towards the main target at 91,952. At the same time, the structure allows for a deeper correction after the upper target is tested: a return towards 75,000 would correspond to a retest of the lower part of the ascending channel. While the price remains above 81,128, the medium-term structure retains upside potential.
Forecast scenario for the week: first a decline towards 82,666, followed by a recovery towards 87,530. If the price consolidates above 87,530, the next target will be 91,952. A loss of 81,128 would increase the risk of a move towards 77,873 and then 75,000.
BTCUSD trade idea
Weekly forecast FAQ
What is the EURUSD forecast for 28 September to 2 October 2026?
The main trend for EURUSD is assessed as downward. The base case is a pullback into the 1.1409 to 1.1465 zone, followed by a resumption of the decline. The nearest target is 1.1320, then 1.1276, and the main target of the current downward structure is 1.1223.
Which trade ideas does this weekly forecast include?
Seven SELL scenarios (EURUSD, USDJPY, GBPUSD, AUDUSD, gold, US 500 and BTCUSD) and one BUY scenario (USDCAD). Each idea lists the entry price, Stop Loss, Take Profit and risk-to-reward ratio.
Which events can move the markets this week?
The Reserve Bank of Australia rate decision on 29 September, the US PCE price index and Australian inflation data on 30 September, and the US employment report and preliminary eurozone inflation on 2 October.
What are the key gold support and resistance levels this week?
Support for gold (XAU/USD) is at 4,206 and 3,946. Resistance is at 4,312 and 4,363. The weekly bias remains downward until the 4,200 to 4,206 area is reached.
Are these trade ideas guaranteed to make a profit?
No. The trade ideas are educational examples of technical analysis. The results of previous trading operations do not guarantee the same results in the future.
Editors’ picks

 EURUSD forecast 2026–2027: technical analysis, price levels & predictions
The EURUSD outlook for 2026 and 2027: key levels on the daily chart, three trading scenarios and the policy gap between the Fed and the ECB that drives the pair.
 Gold (XAU/USD) forecast 2026: technical analysis, price levels & predictions
Where gold could trade in 2026: key levels, three trading scenarios with entry triggers and the forecasts from J.P. Morgan, Deutsche Bank and Goldman Sachs.
Forecasts presented in this section only reflect the author’s private opinion and should not be considered as guidance for trading. RoboForex bears no responsibility for trading results based on trading recommendations described in these analytical reviews.