
Weekly technical analysis and forecast (5–9 October 2026)
In this weekly technical analysis, we examine the key chart patterns and price levels for EURUSD, USDJPY, GBPUSD, AUDUSD, USDCAD, gold (XAUUSD), US 500, and Bitcoin (BTCUSD) to forecast market developments for the week ahead (5–9 October 2026).
Major technical levels to watch this week
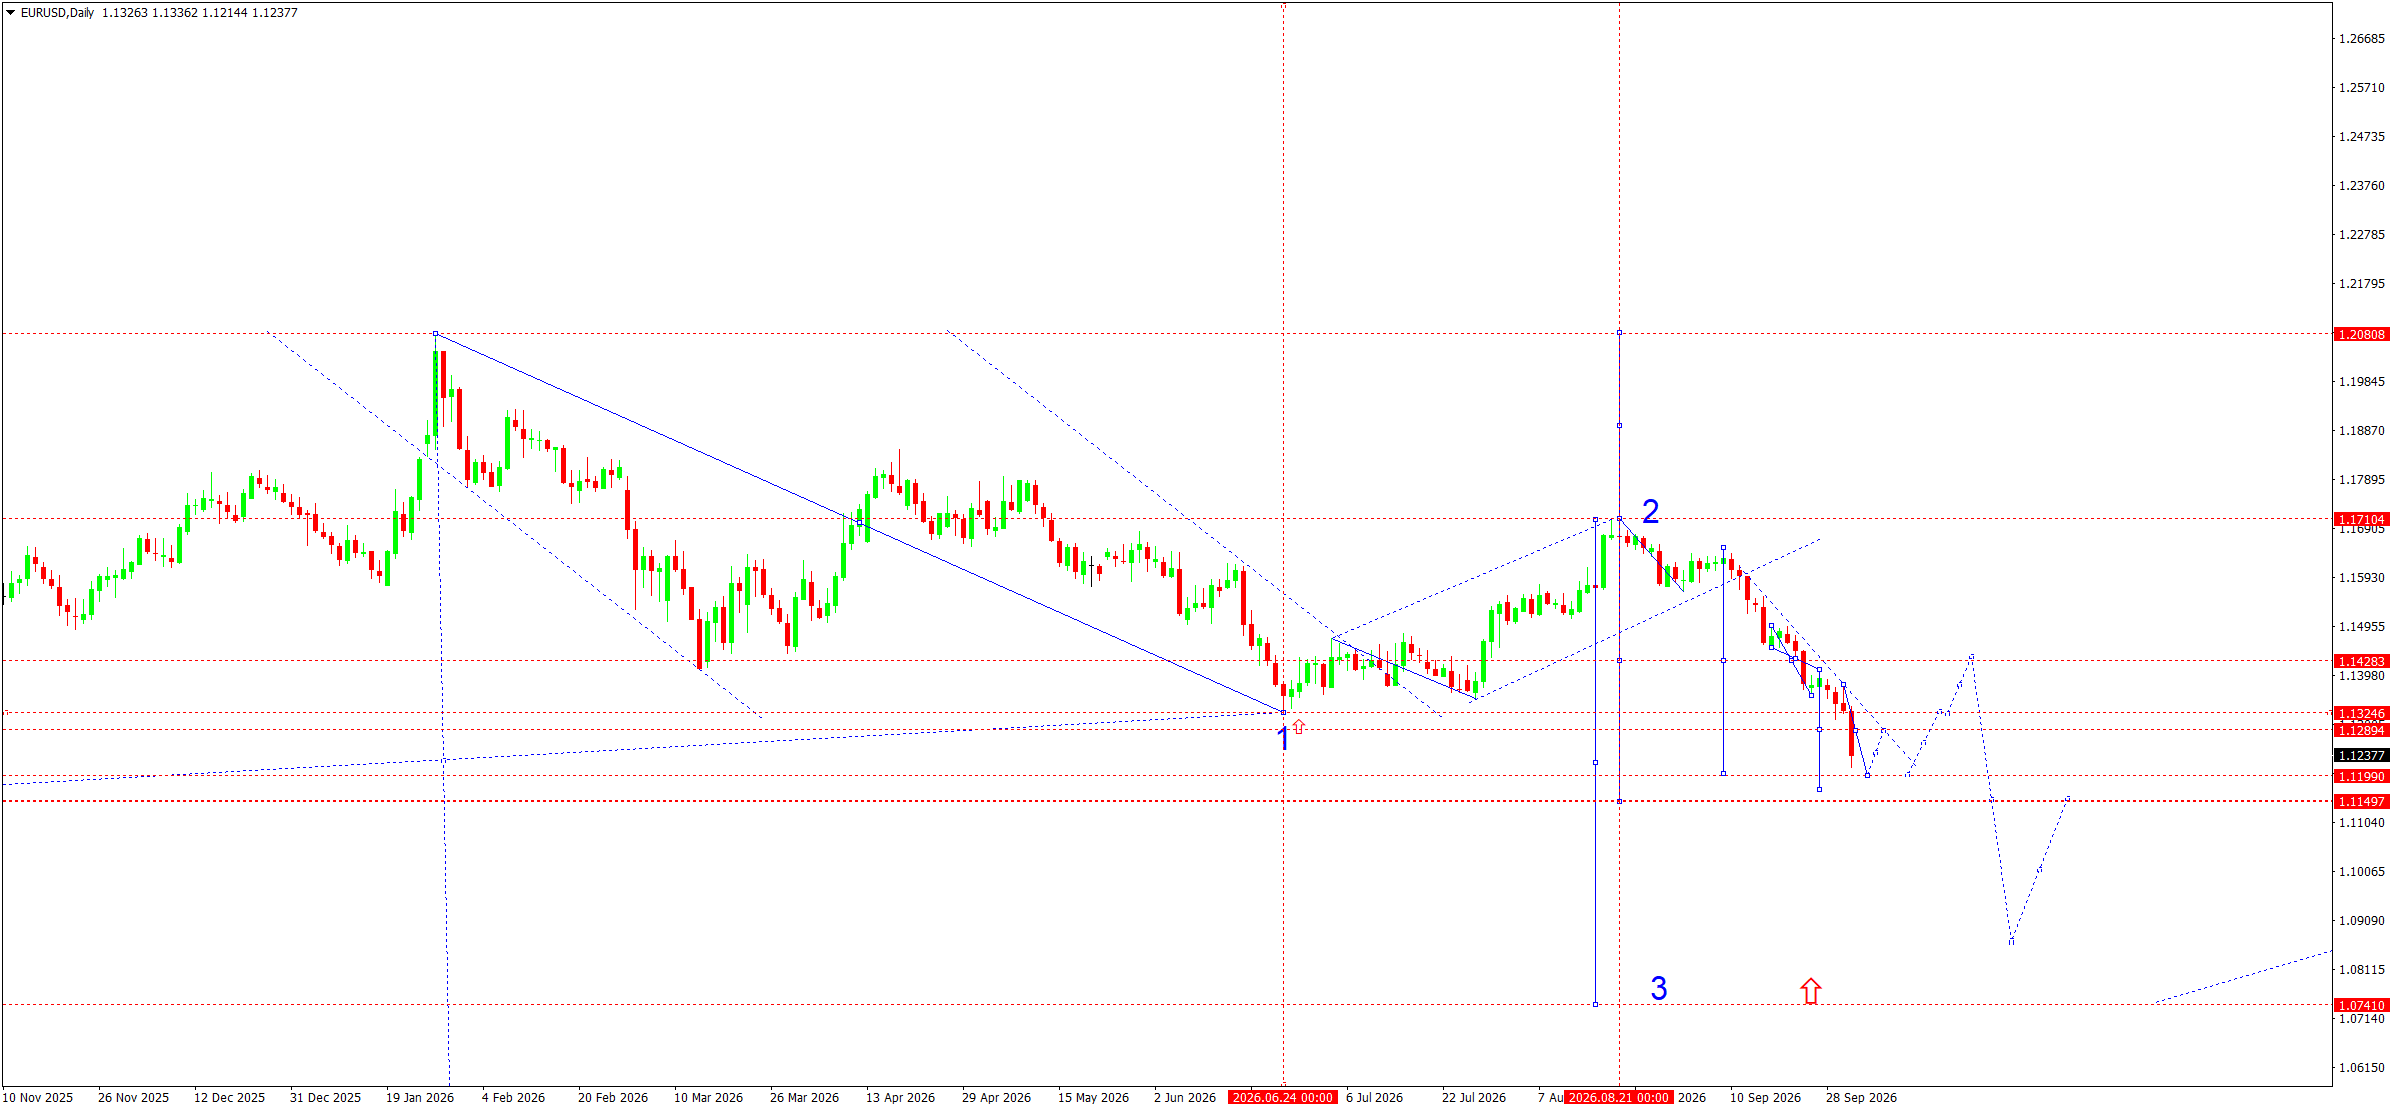
- EURUSD: Support: 1.1199, 1.1150. Resistance: 1.1325, 1.1428
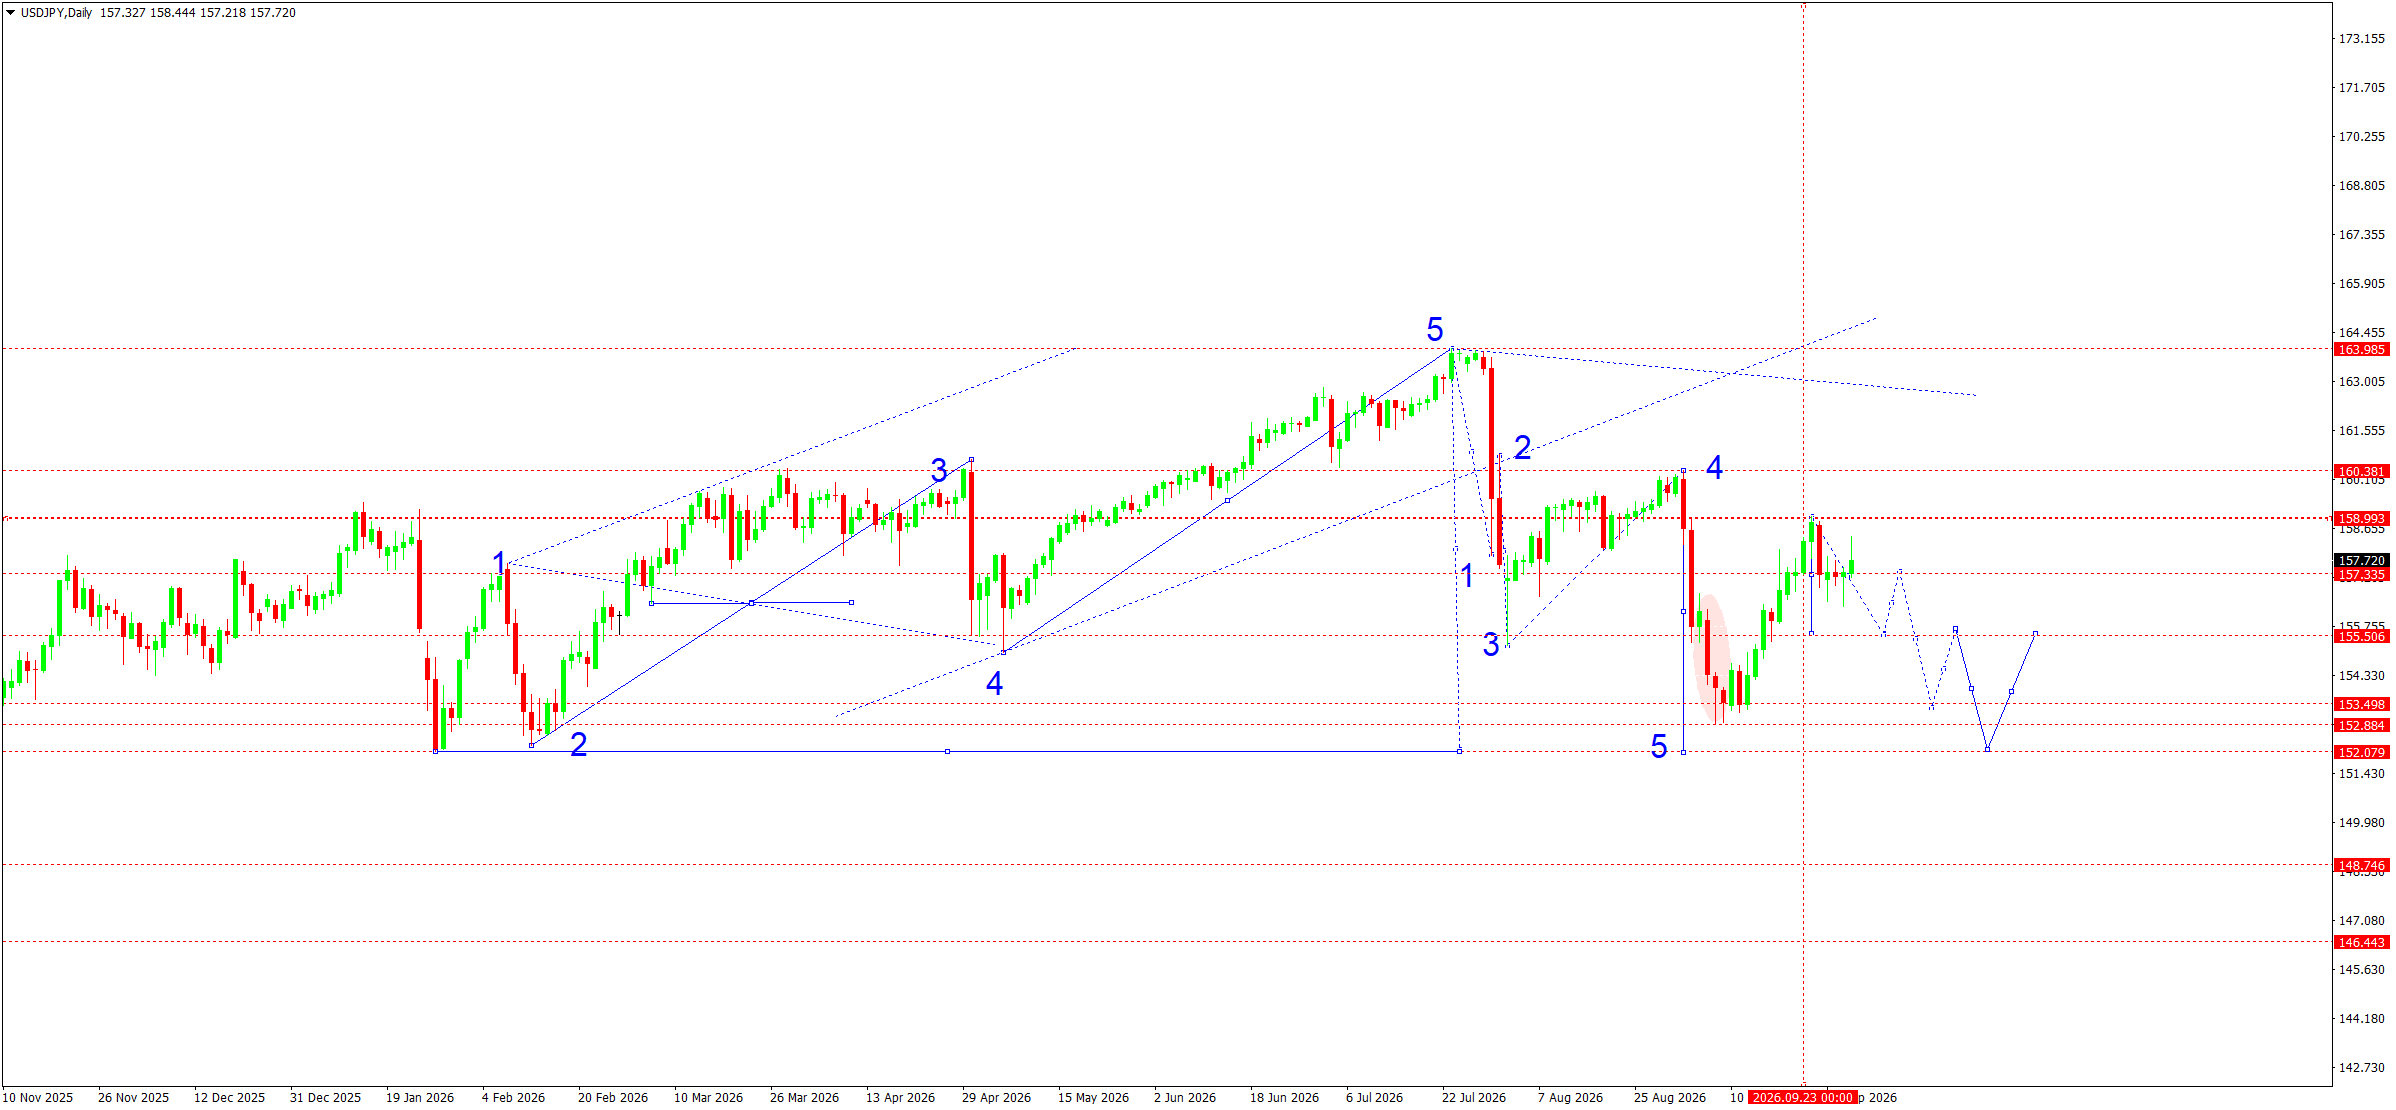
- USDJPY: Support: 155.51, 153.50. Resistance: 158.99, 160.38
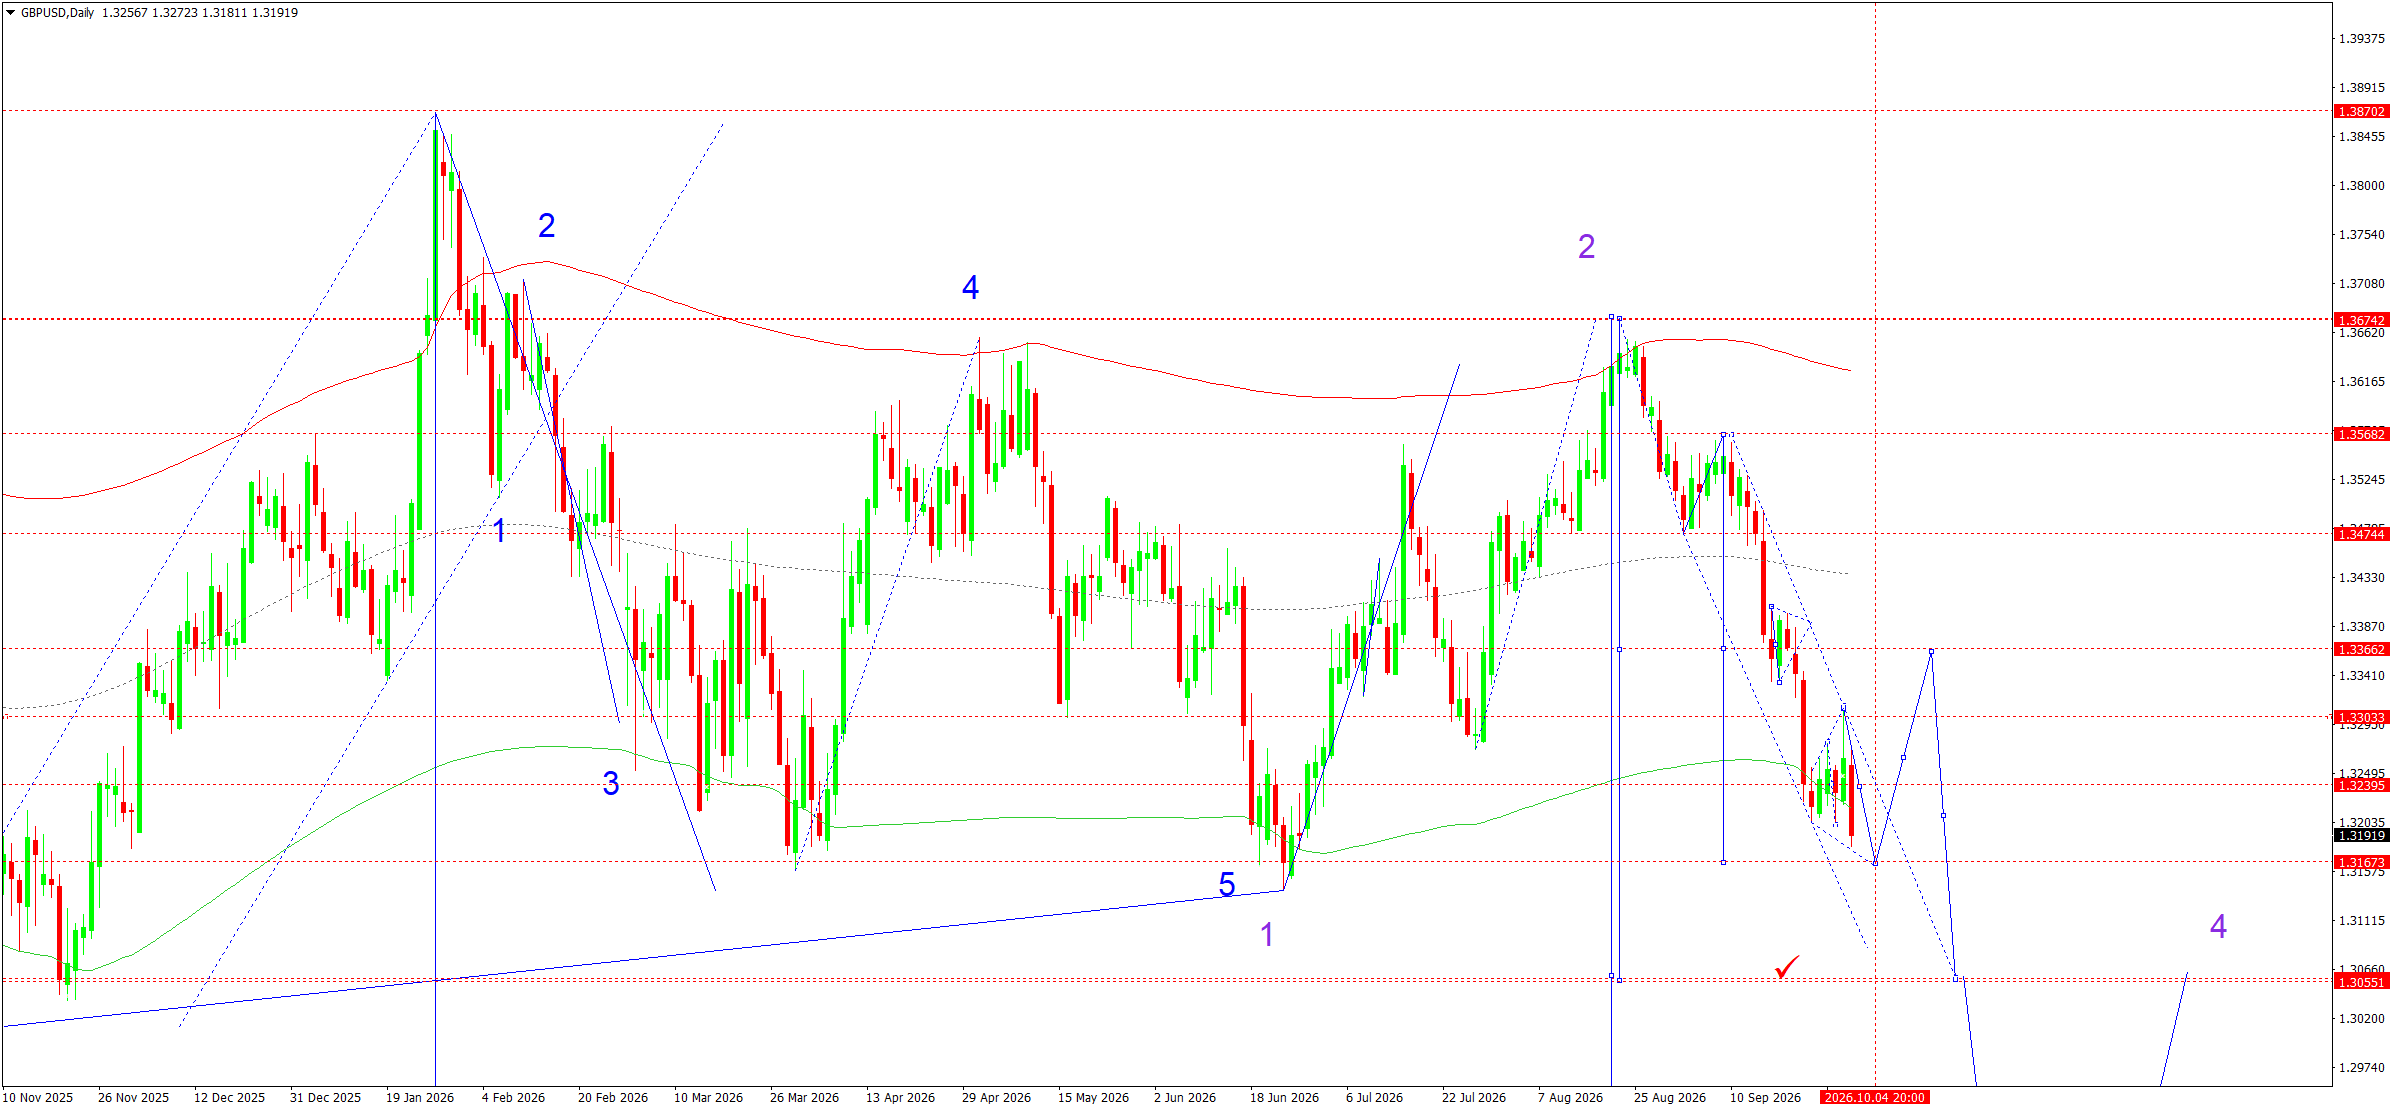
- GBPUSD: Support: 1.3167, 1.3055. Resistance: 1.3303, 1.3366
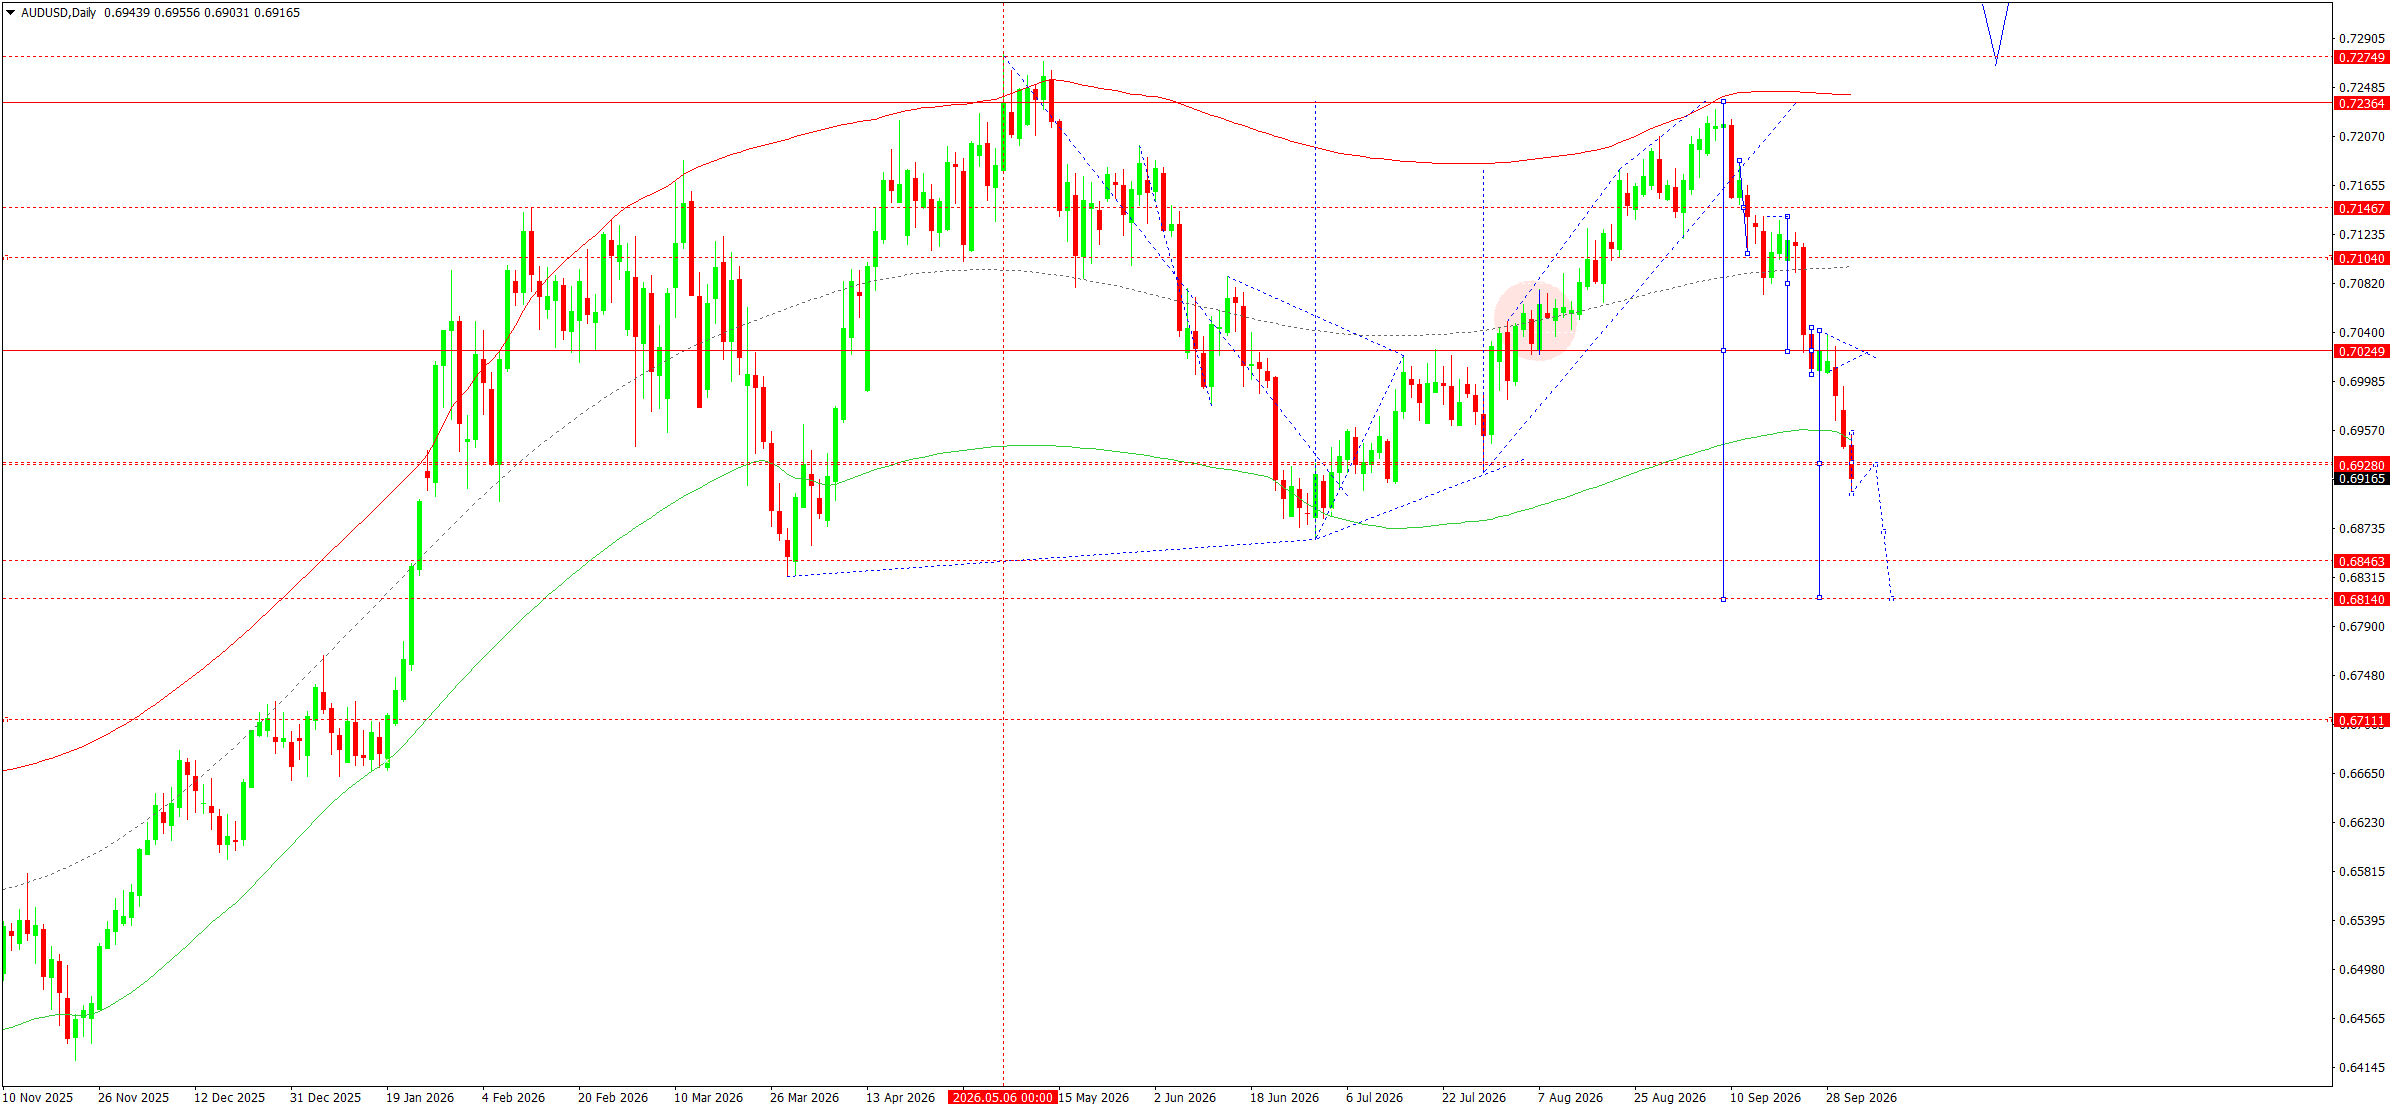
- AUDUSD: Support: 0.6865, 0.6814. Resistance: 0.6928, 0.7025
- USDCAD: Support: 1.4173, 1.4023. Resistance: 1.4286, 1.4319
- Gold: Support: 4,206, 3,946. Resistance: 4,312, 4,363
- US 500: Support: 7,621, 7,515. Resistance: 7,716, 7,812
- BTCUSD: Support: 82,548, 81,201. Resistance: 85,130, 87,714
EURUSD forecast
At the start of October, the fundamental backdrop for EURUSD remains predominantly unfavourable for the euro. The European Central Bank raised its key interest rates by 0.2500 percentage points in September in response to persistent inflationary pressure, including that linked to high energy costs. The ECB expects average eurozone inflation to be around 3.0000% in 2026 and economic growth around 0.9000%. However, monetary tightening has not yet provided sustained support to the euro, as investors are simultaneously assessing the risks of an economic slowdown and deterioration in the European debt market.
Additional pressure on the single currency comes from France’s fiscal risks and rising government bond yields. The widening risk premium between French bonds and German Bunds is increasing caution among market participants. As a result, EURUSD is ending the current week with a notable decline and remains under the influence of a medium-term downward impulse.
On the US dollar side, Federal Reserve policy is the key factor.
Following the September rate increase, the market is assessing the probability of a pause at the October meeting, although high US bond yields continue to support the dollar. US labour-market data are in focus. Stronger figures could preserve expectations of restrictive Fed policy, while a noticeable cooling in employment could trigger a corrective weakening of the US dollar. Therefore, a EURUSD recovery cannot be ruled out at the start of the week, although the fundamental balance does not yet provide convincing grounds for a sustained upward reversal.
EURUSD technical analysis
On the daily chart, EURUSD retains a pronounced downward structure. After the second wave formed around 1.1710, the market continued to decline and successively broke intermediate support levels. The 1.1428 area had previously acted as a consolidation zone, but the downside breakout confirmed the development of the third wave of the main downward move.
The current price is around 1.1238. The nearest local support is the 1.1199–1.1150 area. A technical correction towards 1.1289–1.1325 is possible in the coming week. While quotes remain below 1.1428, such a recovery should be viewed as a correction within the downtrend.
The main scenario assumes the end of the corrective phase and a continuation of the decline first towards 1.1199 and then 1.1150. Consolidation below this zone would give the third-wave structure room to develop further. The next medium-term target would be around 1.0870, while the more distant main chart target remains 1.0740. A return above 1.1428 would significantly weaken this bearish scenario.
EURUSD forecast scenario
Trading scenario: SELL
- Price at the time of writing: 1.1238
- Entry price: 1.1233
- Stop loss: 1.1290
- Take profit: 1.1150
- Risk-to-reward ratio: 1:1.4600
The trade idea is valid until 8:00 on 10 October 2026 (server time, UTC+3).
USDJPY forecast
At the start of the week, the fundamental backdrop for USDJPY is shaped by opposing factors from monetary policy in Japan and the US. The Bank of Japan raised the interest rate to 1.25% in September, the highest level in several decades. Fresh Tokyo inflation data provided additional support for expectations of further tightening: the core Consumer Price Index accelerated to 2.7% year-on-year in September, while the measure excluding fresh food and energy reached 3.0%.
Persistent price pressure increases the likelihood that the BoJ will maintain a restrictive tone at upcoming meetings.
At the same time, Japanese authorities continue to monitor the currency market closely. Following previous interventions and joint signals from Tokyo and Washington, Japanese officials again warned against excessive yen weakness. This creates an additional fundamental barrier to a sustained rise in USDJPY and increases the probability of sharp corrective moves if quotes return to local highs.
On the US dollar side, the situation remains the opposite.
The Federal Reserve raised the rate to a range of 3.75–4.00% in September, while policymakers retain the option of further tightening. The yield on 10-year US Treasuries rose above 5.3%, supporting the dollar through the still-significant US–Japan yield differential. Therefore, USDJPY may remain volatile in the coming week, while the release of the minutes from the Fed’s September meeting on 7 October could further change market expectations.
USDJPY technical analysis
On the daily chart, USDJPY formed a pronounced downward impulse after completing the five-wave upward structure around 163.99. The subsequent recovery towards 160.38 also ended in a downward reversal, after which the market tested the 152.08–153.50 area.
The current price is around 157.72 and is forming a local consolidation range around 157.33.
The main scenario remains the development of another downward leg. The nearest target is 155.51–155.60. From this area, the chart structure allows for corrective growth and another test of 157.33–157.35. If buyers fail to consolidate above this zone, the next downward wave towards 153.50 is likely to form. Deeper support is located around 152.88–152.08.
Therefore, the 157.33 area is the nearest pivot point. Holding below 158.99 supports the downward structure, while consolidation above this resistance could temporarily postpone the decline and open a move towards 160.38.
USDJPY forecast scenario
Trading scenario: SELL
- Price at the time of writing: 157.72
- Entry price: 157.67
- Stop loss: 159.05
- Take profit: 153.50
- Risk-to-reward ratio: 1:3.02
The trade idea is valid until 8:00 on 10 October 2026 (server time, UTC+3).
GBPUSD forecast
GBPUSD enters the week under pressure from a strong US dollar and deteriorating investor sentiment towards UK assets. The Federal Reserve raised its rate range to 3.75–4.00% in September, while persistent inflation leaves room for further policy tightening. However, recent comments from Fed officials indicate a willingness to wait for new data, making US labour-market statistics the main short-term factor for the dollar. Weak employment figures could trigger a correction in the US currency, while resilient wage and employment growth would support the dollar.
The Bank of England kept its rate at 3.75% in September, with three of the nine Committee members voting for an increase to 4.00%. UK inflation reached 3.10%, while high energy prices increase the risk of further acceleration. At the same time, a survey of UK companies shows some easing in expectations for selling-price growth while wage-growth expectations remain stable. This creates a mixed backdrop for sterling: the possibility of BoE tightening limits the downside, but expensive energy, rising UK bond yields, and fiscal risks increase pressure. Therefore, the fundamental balance for 5–9 October remains predominantly unfavourable for GBPUSD.
Government bond yields will be another factor during the week. Rising US yields generally support the dollar, but the UK market is also facing an elevated premium for inflation and fiscal risks. Therefore, even expectations of a BoE rate increase do not guarantee sustained sterling strength. A shift in the balance would require a combination of weaker US data, stabilisation in the energy market, and lower stress in the UK debt market. Until such signals appear, corrective rises in the pair technically look more like part of the downward structure than the start of a full reversal within the current daily wave.
GBPUSD technical analysis
On the daily chart, the downward structure remains intact. After the second wave was completed around 1.3674, the price formed a sustained downward impulse, successively breaking below 1.3474, 1.3366, and 1.3303. The pivot point of the current wave is around 1.3366; consolidation below it confirms that sellers retain the advantage. The decline has now reached the 1.3180–1.3167 area, where local consolidation and a corrective rebound are likely.
The main scenario assumes that any recovery will remain limited to the 1.3303–1.3366 area. Once the correction is complete, a new downward wave towards 1.3167 and then key support at 1.3055 is expected. A breakout below 1.3055 would expand the potential of the third downward wave and open the way for a deeper move. The medium-term local target remains around 1.2450, while if the strong impulse persists, the market could continue towards 1.2260. Invalidation of the bearish structure would require a return above 1.3366 followed by consolidation above this area.
GBPUSD forecast scenario
Trading scenario: SELL
- Price at the time of writing: 1.3192
- Entry price: 1.3187
- Stop loss: 1.3303
- Take profit: 1.3055
- Risk-to-reward ratio: 1:1.14
The trade idea is valid until 8:00 on 10 October 2026 (server time, UTC+3).
AUDUSD forecast
The Australian dollar enters the new trading week under the influence of mixed fundamental factors. The main domestic driver remains the Reserve Bank of Australia’s policy. On 29 September, the RBA raised the interest rate by 0.25 percentage points to 4.60%. The regulator explained the decision by persistent inflationary pressure, rising energy costs, and more resilient domestic demand. The latest data showed Australian inflation accelerating to 4.0% year-on-year, while underlying price pressure remains elevated. This keeps the possibility of further RBA tightening in place and fundamentally limits the potential for a prolonged weakening of the AUD.
However, the external backdrop is currently working against the Australian currency. The US dollar remains supported by high US government bond yields and the Federal Reserve’s cautious stance. Following the September rate increase, Fed officials signalled the need to assess incoming data before the next decision. Softer inflation data reduced the probability of another increase as early as October, although the market continues to price in the possibility of further tightening later.
Therefore, US labour market data will be one of the main factors for AUDUSD. Commodity prices, the geopolitical situation, and overall investor risk appetite also remain important.
AUDUSD technical analysis
On the daily chart, the downward structure remains intact. After the upward wave around 0.7236 was completed, the price formed a sustained downward impulse, breaking below 0.7147, 0.7104, and 0.7025 and confirming that sellers had taken the initiative. The current price around 0.6917 is directly near the local target at 0.6928. A consolidation range and short-term correction may form here.
The main scenario remains a continuation of the downward wave. After stabilisation near 0.6928, another impulse towards 0.6865 is likely, followed by the main weekly target at 0.6814. The 0.6814 area is viewed as important support and a potential completion point for the current downward wave. After it is tested, the probability of a corrective move back towards 0.6928 would increase. A return above 0.7025 would weaken the bearish scenario and open the way for a deeper correction.
AUDUSD forecast scenario
Trading scenario: SELL
- Price at the time of writing: 0.6917
- Entry price: 0.6912
- Stop loss: 0.6960
- Take profit: 0.681
- Risk-to-reward ratio: 1:2.04
The trade idea is valid until 8:00 on 10 October 2026 (server time, UTC+3).
USDCAD forecast
At the start of the week, the fundamental backdrop for USDCAD is being shaped primarily by a notable divergence in monetary conditions between the US and Canada. At its September meeting, the Federal Reserve raised the rate by 0.25 percentage points to a range of 3.75–4.00%. However, the latest inflation data were softer than expected, so the probability of another rate increase as early as October has declined significantly.
Fed officials are also showing a willingness to wait for additional data before the next decision. As a result, the US dollar remains supported by high US bond yields, although the scope for further strengthening has become less clear.
The Bank of Canada kept the rate unchanged at 2.25% in September. The regulator noted an improvement in economic activity while highlighting persistent uncertainty related to US trade policy. The latest data showed no growth in the Canadian economy in July, although a preliminary estimate suggests GDP expanded by 0.2% in August. The oil market remains an additional factor for the Canadian dollar, as high energy prices can limit pressure on the CAD.
In the US, the labour market is the key short-term reference point. Therefore, after the strong rise in USDCAD, the fundamental backdrop allows for elevated volatility and a transition to a correction after the upper targets are tested.
USDCAD technical analysis
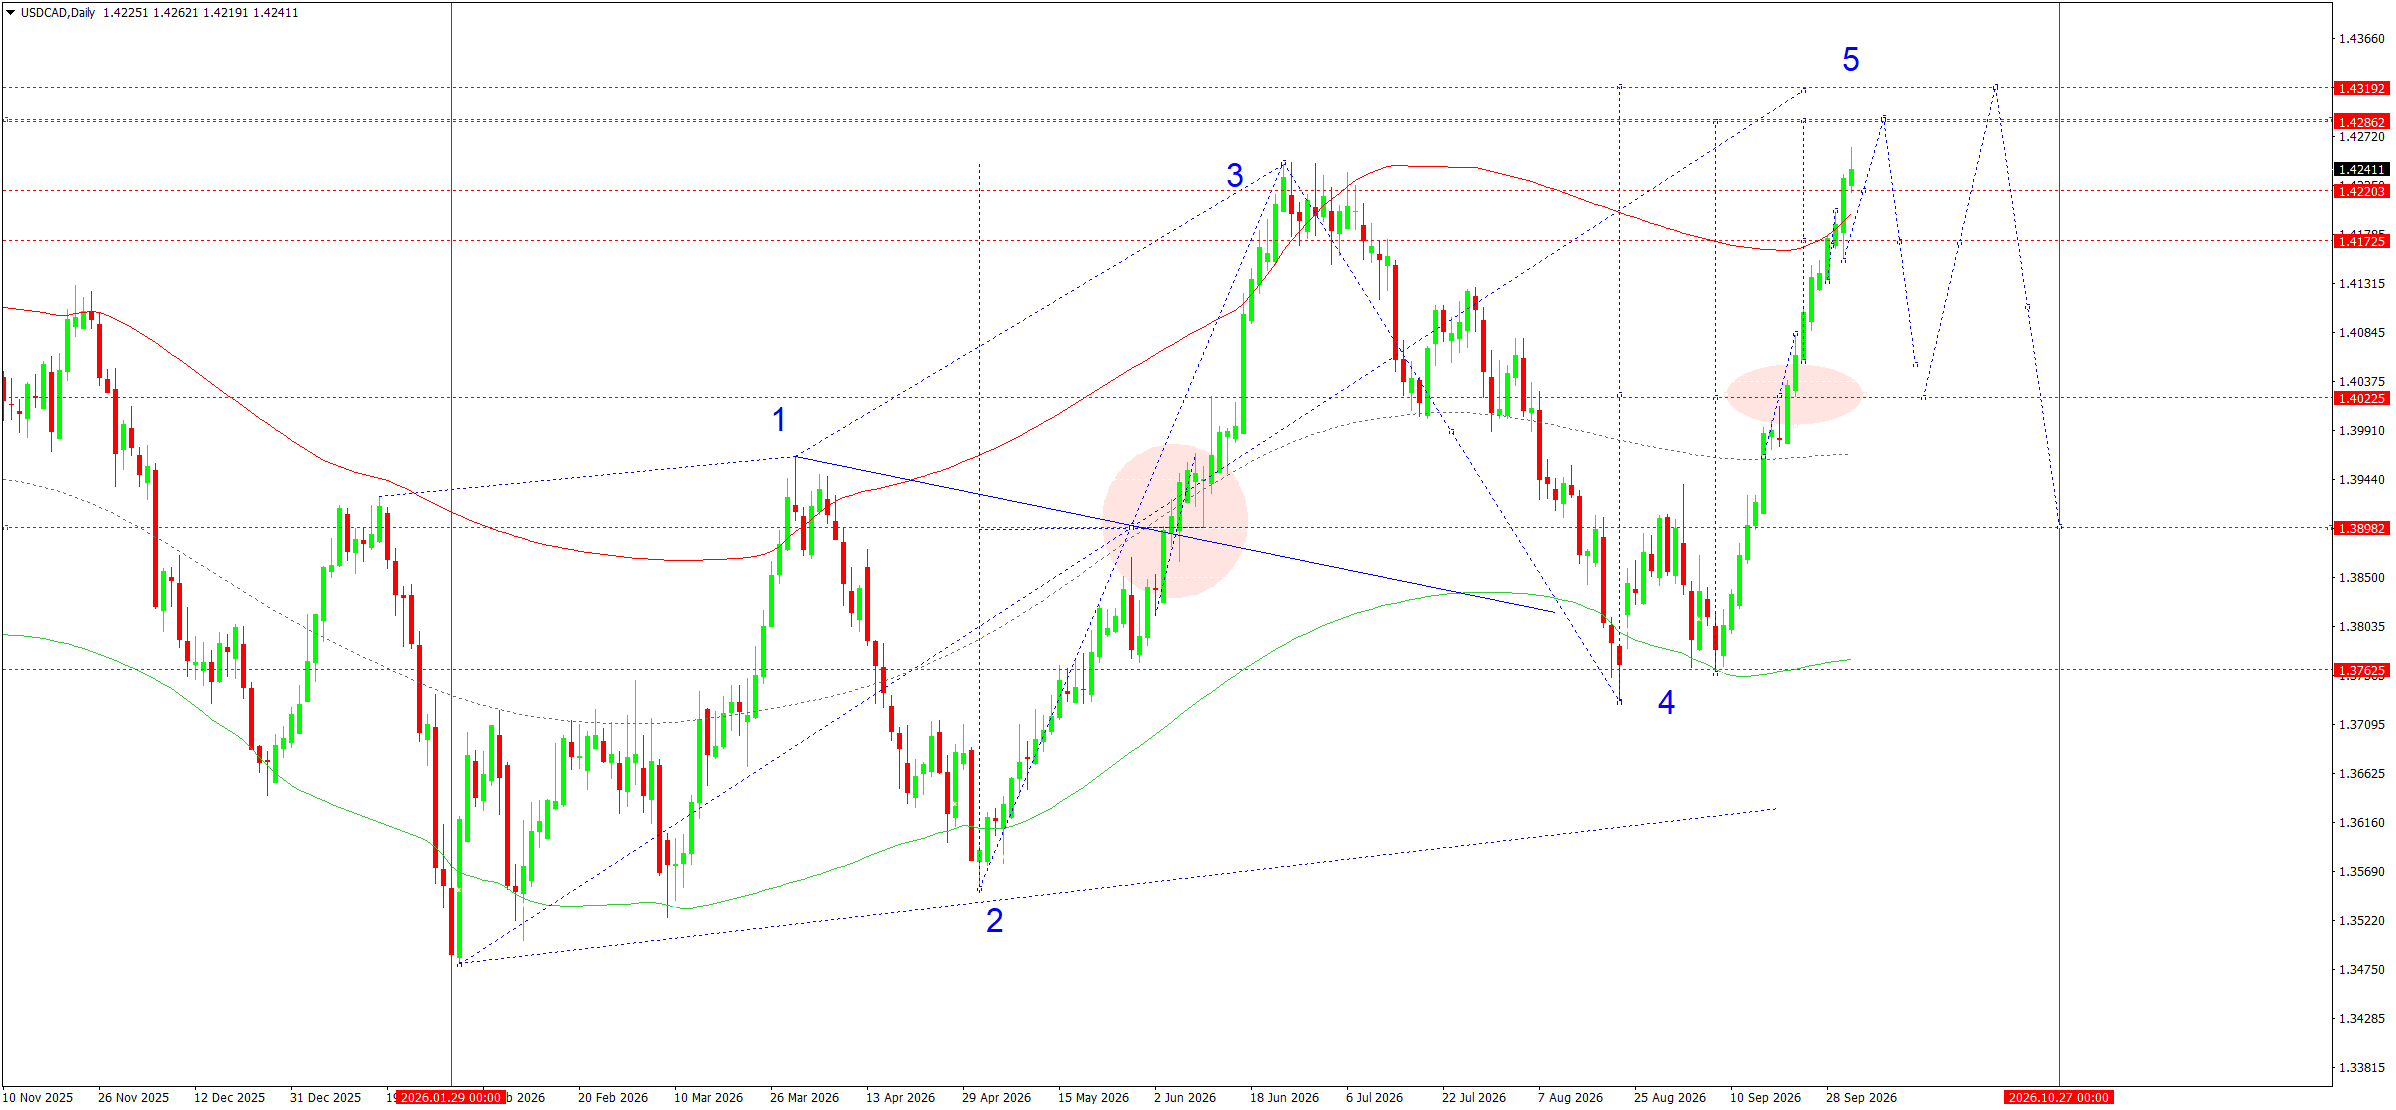
On the daily chart, the upward structure remains intact. After forming wave 4 around 1.3763, the pair reversed higher and successively moved above 1.3898, 1.4023, and 1.4173. Consolidation above 1.4173 confirms the development of the final upward leg of wave 5. The nearest target is 1.4286, while an extension of the impulse opens the possibility of testing 1.4319.
At the start of the week, the base-case scenario is a continuation of the rise towards 1.4286, followed by the formation of a local range. From this area, the probability of a corrective move towards 1.4173 increases, which would technically represent a test from above of the broken resistance. Holding this support would allow another impulse towards 1.4319 to be considered. The 1.4286–1.4319 area appears to be a potential completion zone for the current wave 5.
Once the upward structure is complete, a deeper correction is expected. The first intermediate target would be 1.4173, while the main downside target is 1.4023. A loss of 1.4023 would strengthen the corrective scenario and open the way towards 1.3898.
Therefore, despite the daily uptrend remaining intact, the price approaching the upper targets increases the relevance of looking for a SELL entry once wave 5 is complete.
USDCAD forecast scenario
Trading scenario: SELL
- Price at the time of writing: 1.4241
- Entry price: 1.4236
- Stop loss: 1.4325
- Take profit: 1.4023
- Risk-to-reward ratio: 1:2.39
The trade idea is valid until 8:00 on 10 October 2026 (server time, UTC+3).
XAUUSD forecast
Gold starts the current week under pressure after another attempt to consolidate above the 4,200 area. The main fundamental factor for XAUUSD remains changing expectations regarding the Federal Reserve’s future monetary policy. The September rate increase and rising US government bond yields supported the US dollar and increased the opportunity cost of holding gold. The yield on 10-year US Treasuries rose towards multi-year highs in early October, remaining a significant constraint on the precious metal’s recovery.
At the same time, published inflation data somewhat softened expectations of further policy tightening. The core PCE index for August rose by 0.2% month-on-month, while the annual reading remained around 3.0%. As a result, the probability of another Fed rate increase at the October meeting declined. The US labour market is now in focus, as its condition will determine the dynamics of the US dollar and bond yields ahead of the Fed meeting on 27–28 October.
Fundamental support for gold remains in place due to geopolitical uncertainty, elevated energy risks, and continued demand for safe-haven assets. Central-bank reserve diversification is an additional long-term factor. Therefore, even if the corrective move continues, XAUUSD remains sensitive to any decline in bond yields and weakening of the US dollar.
XAUUSD technical analysis
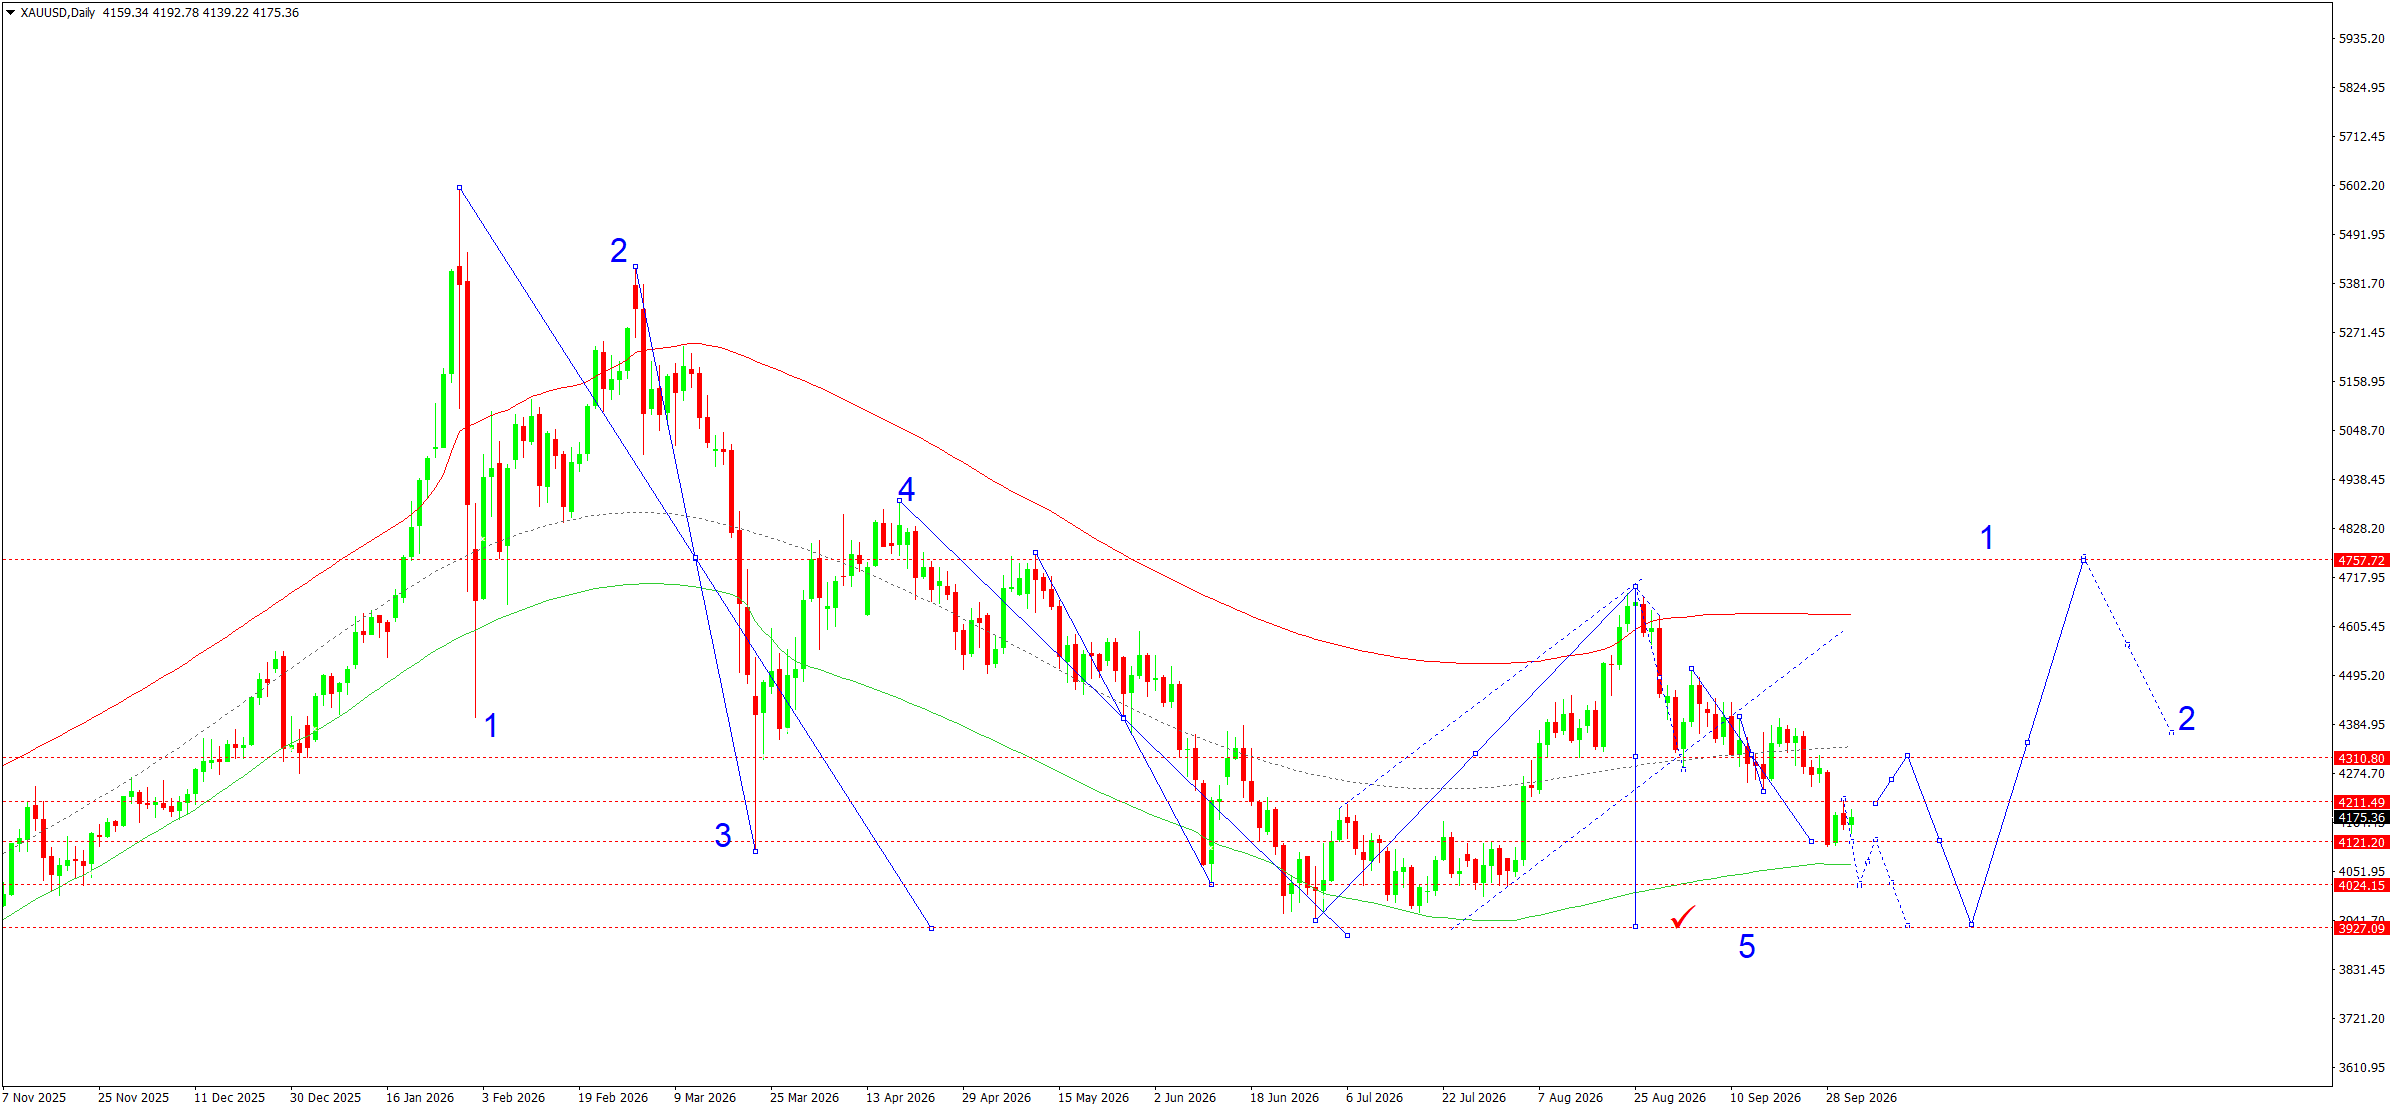
On the daily XAUUSD chart, the downward structure remains intact. After forming a high around 4,700, prices moved into another downward wave and declined towards 4,110. A recovery impulse then formed towards 4,211, after which the market effectively entered a local consolidation phase.
At the start of the week, a continued correction, with prices retesting the 4,211 level, appears likely. If quotes consolidate above this mark, the recovery could extend towards 4,311, where the nearest significant resistance area is located. However, such a move should still be viewed as corrective within the main downward structure.
Once the correction is complete, the baseline technical scenario suggests a new downward wave. The initial target is around 4,024, while further pressure would open the way towards key support at 3,927–3,930. Reaching this area could complete the fifth wave shown on the chart and create conditions for a larger upward move. In this case, the next medium-term target could be around 4,758.
XAUUSD forecast scenario
Trading scenario: SELL
- Price at the time of writing: 4,175
- Entry price: 4,170
- Stop loss: 4,311
- Take profit: 3,930
- Risk-to-reward ratio: 1:1.70
The trade idea is valid until 8:00 on 10 October 2026 (server time, UTC+3).
US 500 forecast
The US stock market enters the new week highly sensitive to US government bond yields and expectations regarding the Federal Reserve’s future policy. At the end of the current week, the yield on 10-year Treasuries retreated somewhat after reaching multi-year highs, easing pressure on the technology sector and supporting a recovery in S&P 500 futures. At the same time, lower oil prices reduced short-term inflation concerns and improved investor sentiment towards risk assets.
The main fundamental reference point remains the US labour market. At the time this review was prepared, the official September employment report had not yet been published; its release is scheduled for 2 October at 08:30 US Eastern Time. In August, the economy added 162,000 jobs and unemployment stood at 4.1%. New data could therefore significantly change market expectations for the Fed’s October meeting.
The debt market remains another important factor for US 500. Persistently high Treasury yields limit the scope for equity revaluation, while a sustained decline in yields could support demand for technology companies and the broader market. Therefore, the fundamental backdrop for 5–9 October remains mixed: the index’s medium-term structure remains resilient, but high borrowing costs and geopolitical risks could keep volatility elevated.
US 500 technical analysis
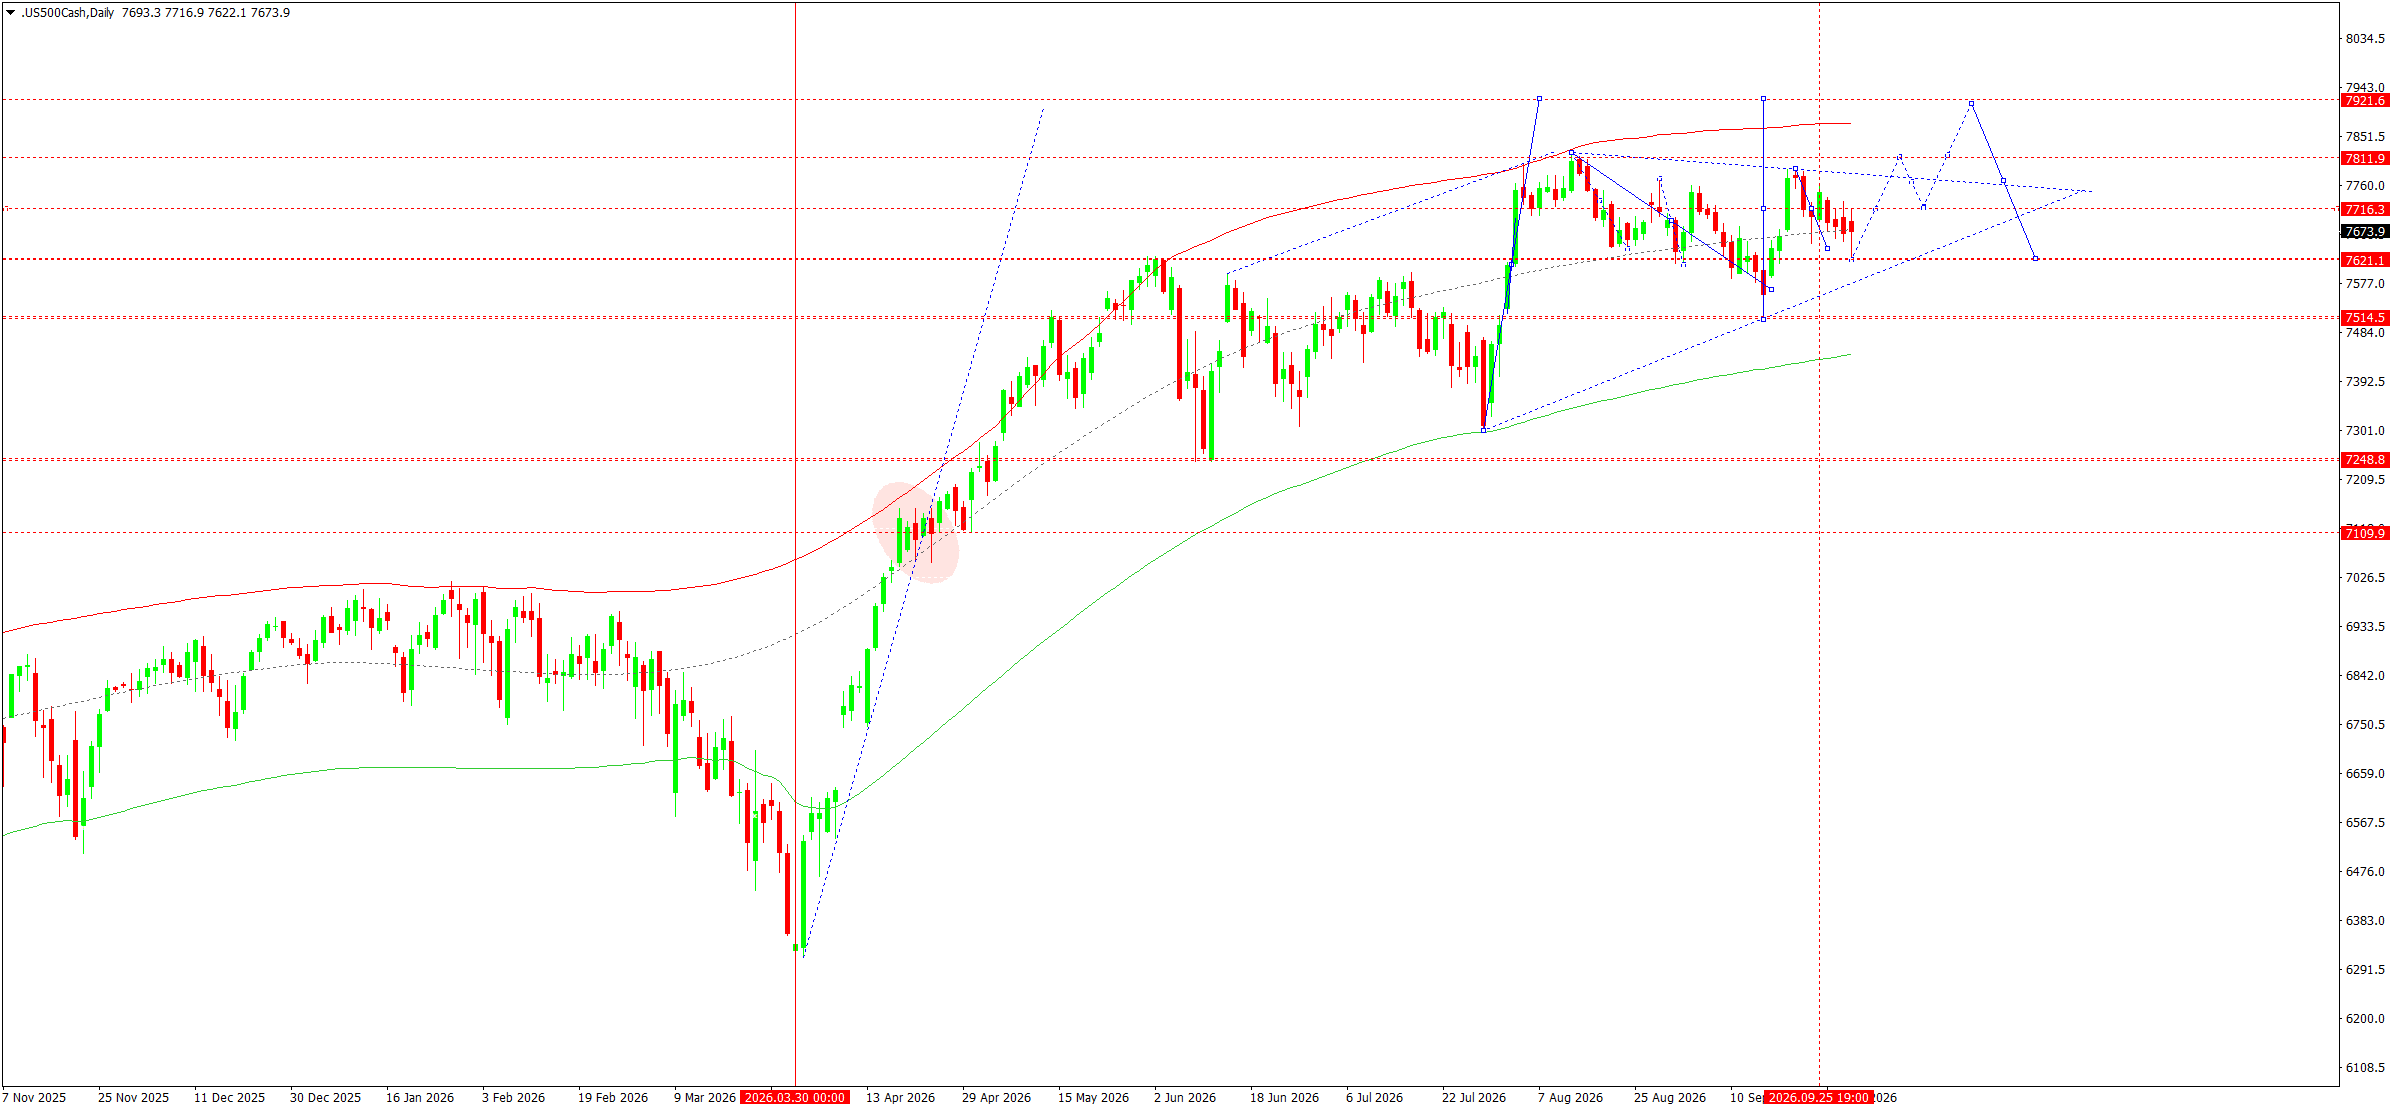
On the daily chart, the US 500 retains a medium-term upward structure, although after reaching the 7,812 area the market moved into broad consolidation. The latest downward wave reached its local target around 7,622, after which a recovery impulse formed. The current price is around 7,674, directly above important support at 7,621.
For the coming week, the base technical model remains the formation of a range followed by an attempt to continue the rise. The first target is 7,716. Consolidation above it would allow a move towards 7,812 to be considered. If a stronger impulse develops, the next target would be the 7,921 area.
The ascending support line remains intact, so the structure does not yet confirm a full downward reversal.
A negative signal would be consolidation below 7,621. In that case, the correction could continue towards 7,515, where the next significant demand area is located. While the price remains above 7,621, the recovery scenario retains the advantage.
US 500 forecast scenario
Trading scenario: BUY
- Price at the time of writing: 7,674
- Entry price: 7,679
- Stop loss: 7,618
- Take profit: 7,812
- Risk-to-reward ratio: 1:2.18
The trade idea is valid until 8:00 on 10 October 2026 (server time, UTC+3).
BTCUSD forecast
At the start of the new week, the fundamental backdrop for Bitcoin remains mixed, but risk appetite has recovered noticeably. The main driver is the shift in expectations regarding the Federal Reserve’s monetary policy. Following comments from Fed officials, the market significantly reduced the probability of another rate increase as early as October. At the same time, the yield on 10-year US Treasuries retreated from multi-year highs and the US dollar corrected, creating more favourable conditions for cryptocurrencies.
However, upcoming US labour market data could change expectations again: strong employment and wage figures could restore pressure through higher yields and a stronger US dollar.
Institutional demand is providing additional support to Bitcoin. US spot Bitcoin ETFs ended the final full week of September with significant net capital inflows, indicating a recovery in interest from large investors. At the same time, risks related to high borrowing costs, geopolitical tensions, and elevated energy prices remain.
These factors could sustain inflation expectations and limit the Fed’s room to ease policy. Therefore, during 5–9 October, the main fundamental reference points will remain the dynamics of US bond yields, the US dollar, and expectations for the Fed’s next decision.
BTCUSD technical analysis
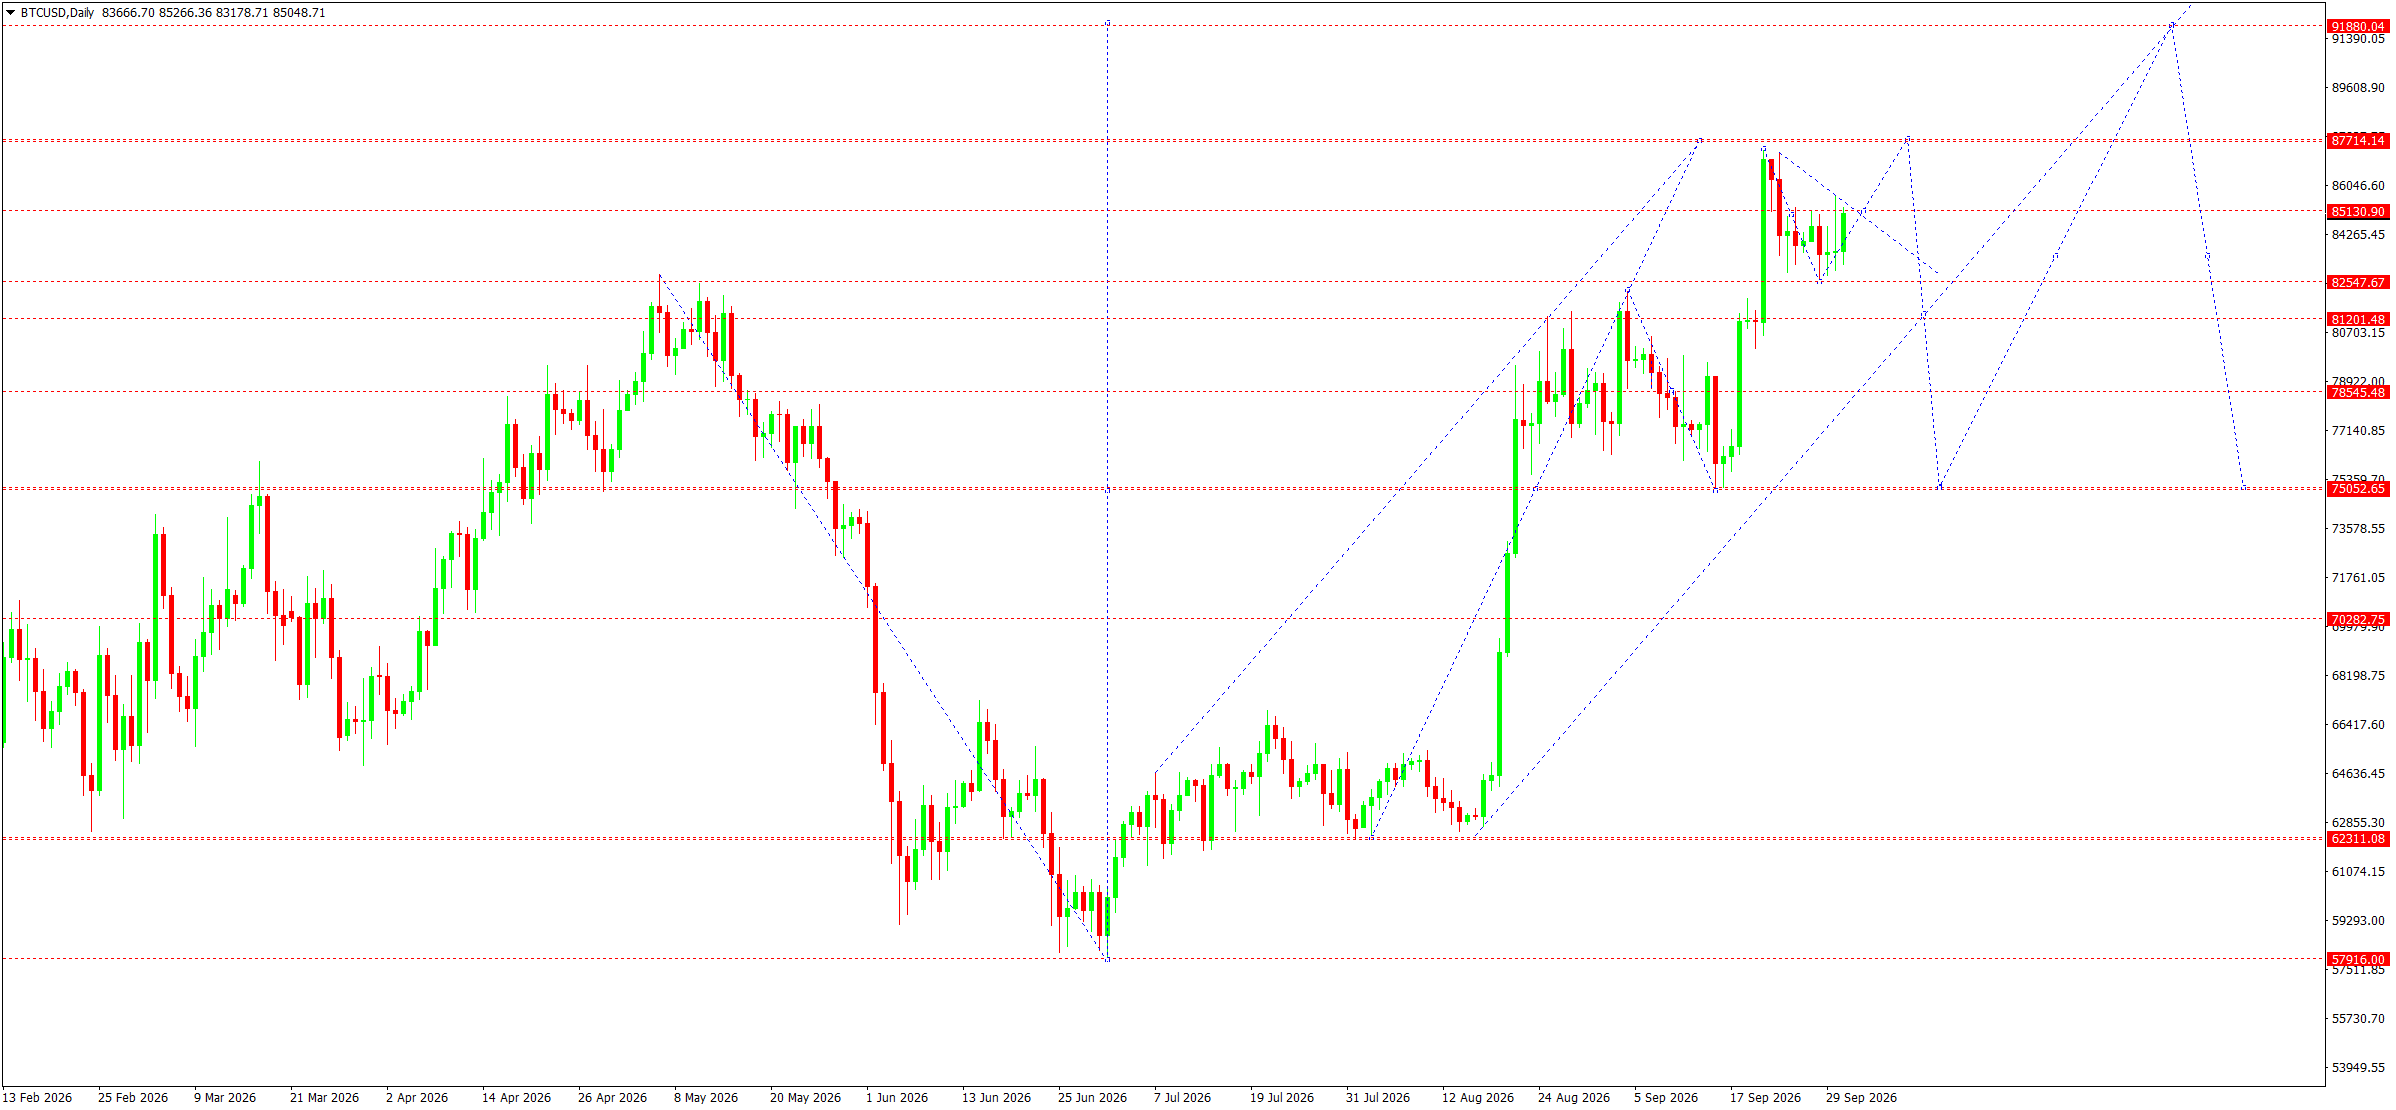
On the daily chart, BTCUSD retains an upward structure after forming a base around 57,916 and a subsequent strong upward impulse. The market reached the 87,714 area, after which it corrected and moved into local consolidation. The current price is around 85,049, directly below resistance at 85,130. Consolidation above this level would create conditions for another test of 87,714. A breakout above 87,714 would confirm continuation of the upward leg, with the main target at 91,880.
At the same time, the current structure allows for an intermediate correction. If buyers fail to consolidate above 85,130, a decline towards 82,548 is likely. The next support area is at 81,201; a loss of this level would strengthen the corrective scenario and open the way towards 78,545. The main weekly trend remains upward for now, as the price is holding well above the August base and the sequence of higher lows remains intact.
An important confirmation of the positive scenario would be sustained demand on pullbacks towards the nearest support levels. While quotes remain above 82,548, the decline can be viewed as a correction within the broader upward structure. A return below 81,201 would worsen the technical picture and increase the probability of a deeper decline. At the same time, a breakout above 87,714 could accelerate the impulse as the market exits the current range and forms a new local high. In that case, the wave structure would continue towards the upper projected area.
BTCUSD forecast scenario
Trading scenario: BUY
- Price at the time of writing: 85,049
- Entry price: 85,054
- Stop loss: 82,450
- Take profit: 91,880
- Risk-to-reward ratio: 1:2.6
The trade idea is valid until 8:00 on 10 October 2026 (server time, UTC+3).
Editors’ picks
 EURUSD forecast 2026–2027: technical analysis, price levels & predictions
The EURUSD outlook for 2026 and 2027: key levels on the daily chart, three trading scenarios and the policy gap between the Fed and the ECB that drives the pair.
 Gold (XAUUSD) forecast 2026: technical analysis, price levels & predictions
Where gold could trade in 2026: key levels, three trading scenarios with entry triggers and the forecasts from J.P. Morgan, Deutsche Bank and Goldman Sachs.
Forecasts presented in this section only reflect the author’s private opinion and should not be considered as guidance for trading. RoboForex bears no responsibility for trading results based on trading recommendations described in these analytical reviews.