
Weekly technical analysis and forecast (12–16 October 2026)
In this weekly technical analysis, we examine the key chart patterns and price levels for EURUSD, USDJPY, GBPUSD, AUDUSD, USDCAD, gold (XAUUSD), US 500, and Bitcoin (BTCUSD) to forecast market developments for the week ahead (12–16 October 2026).
Major technical levels to watch this week
- EURUSD: Support: 1.1139, 1.1102. Resistance: 1.1227, 1.1376
- USDJPY: Support: 157.94, 156.51. Resistance: 158.92, 159.54
- GBPUSD: Support: 1.3188, 1.3090. Resistance: 1.3244, 1.3303
- AUDUSD: Support: 0.6903, 0.6846. Resistance: 0.7025, 0.7147
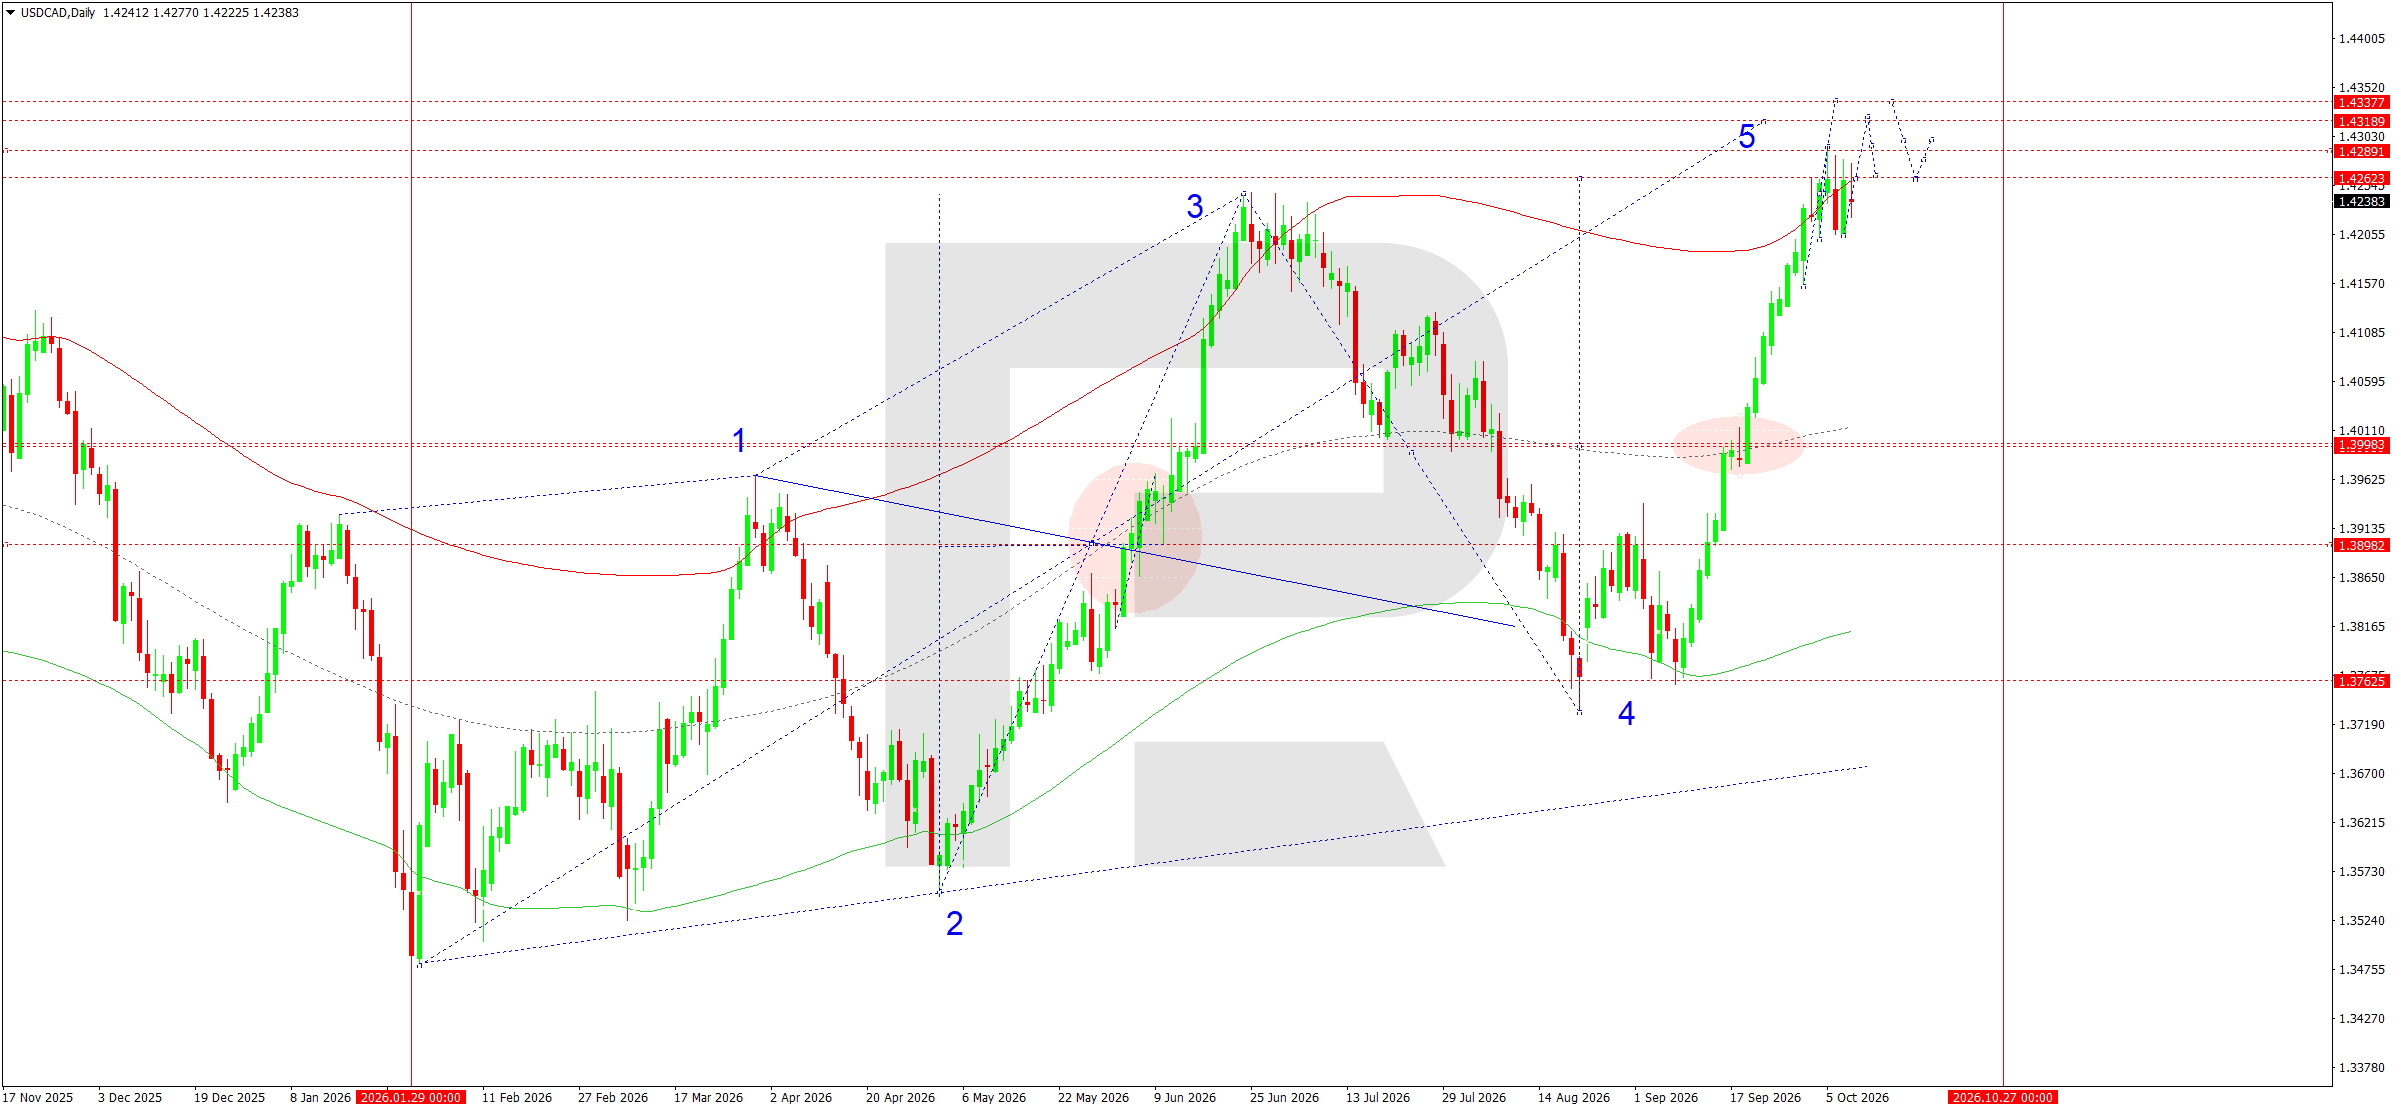
- USDCAD: Support: 1.4197, 1.3998. Resistance: 1.4289, 1.4338
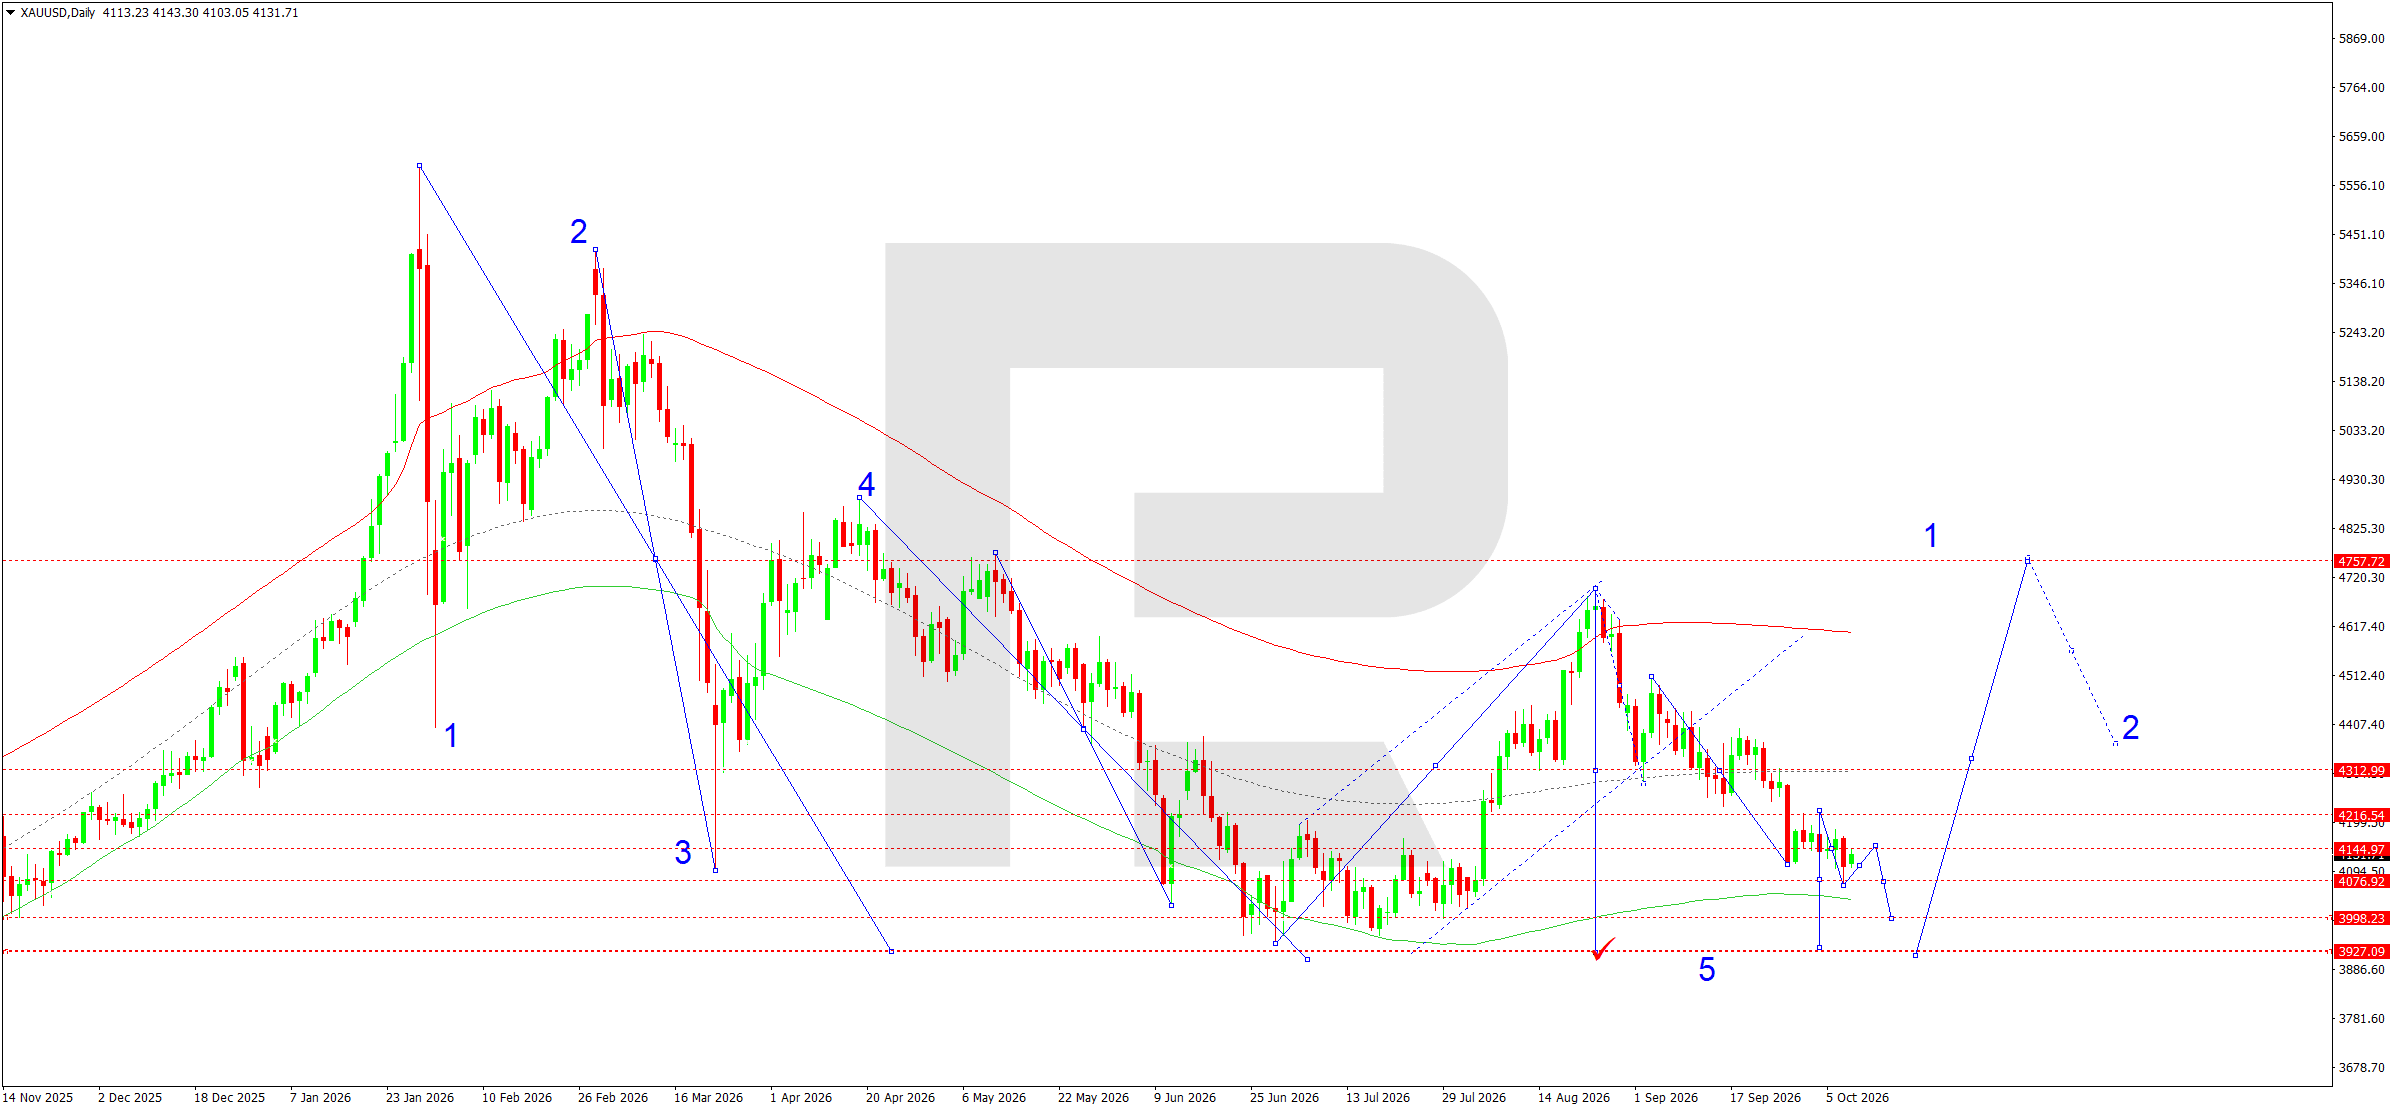
- Gold: Support: 4,076, 3,998. Resistance: 4,216, 4,313
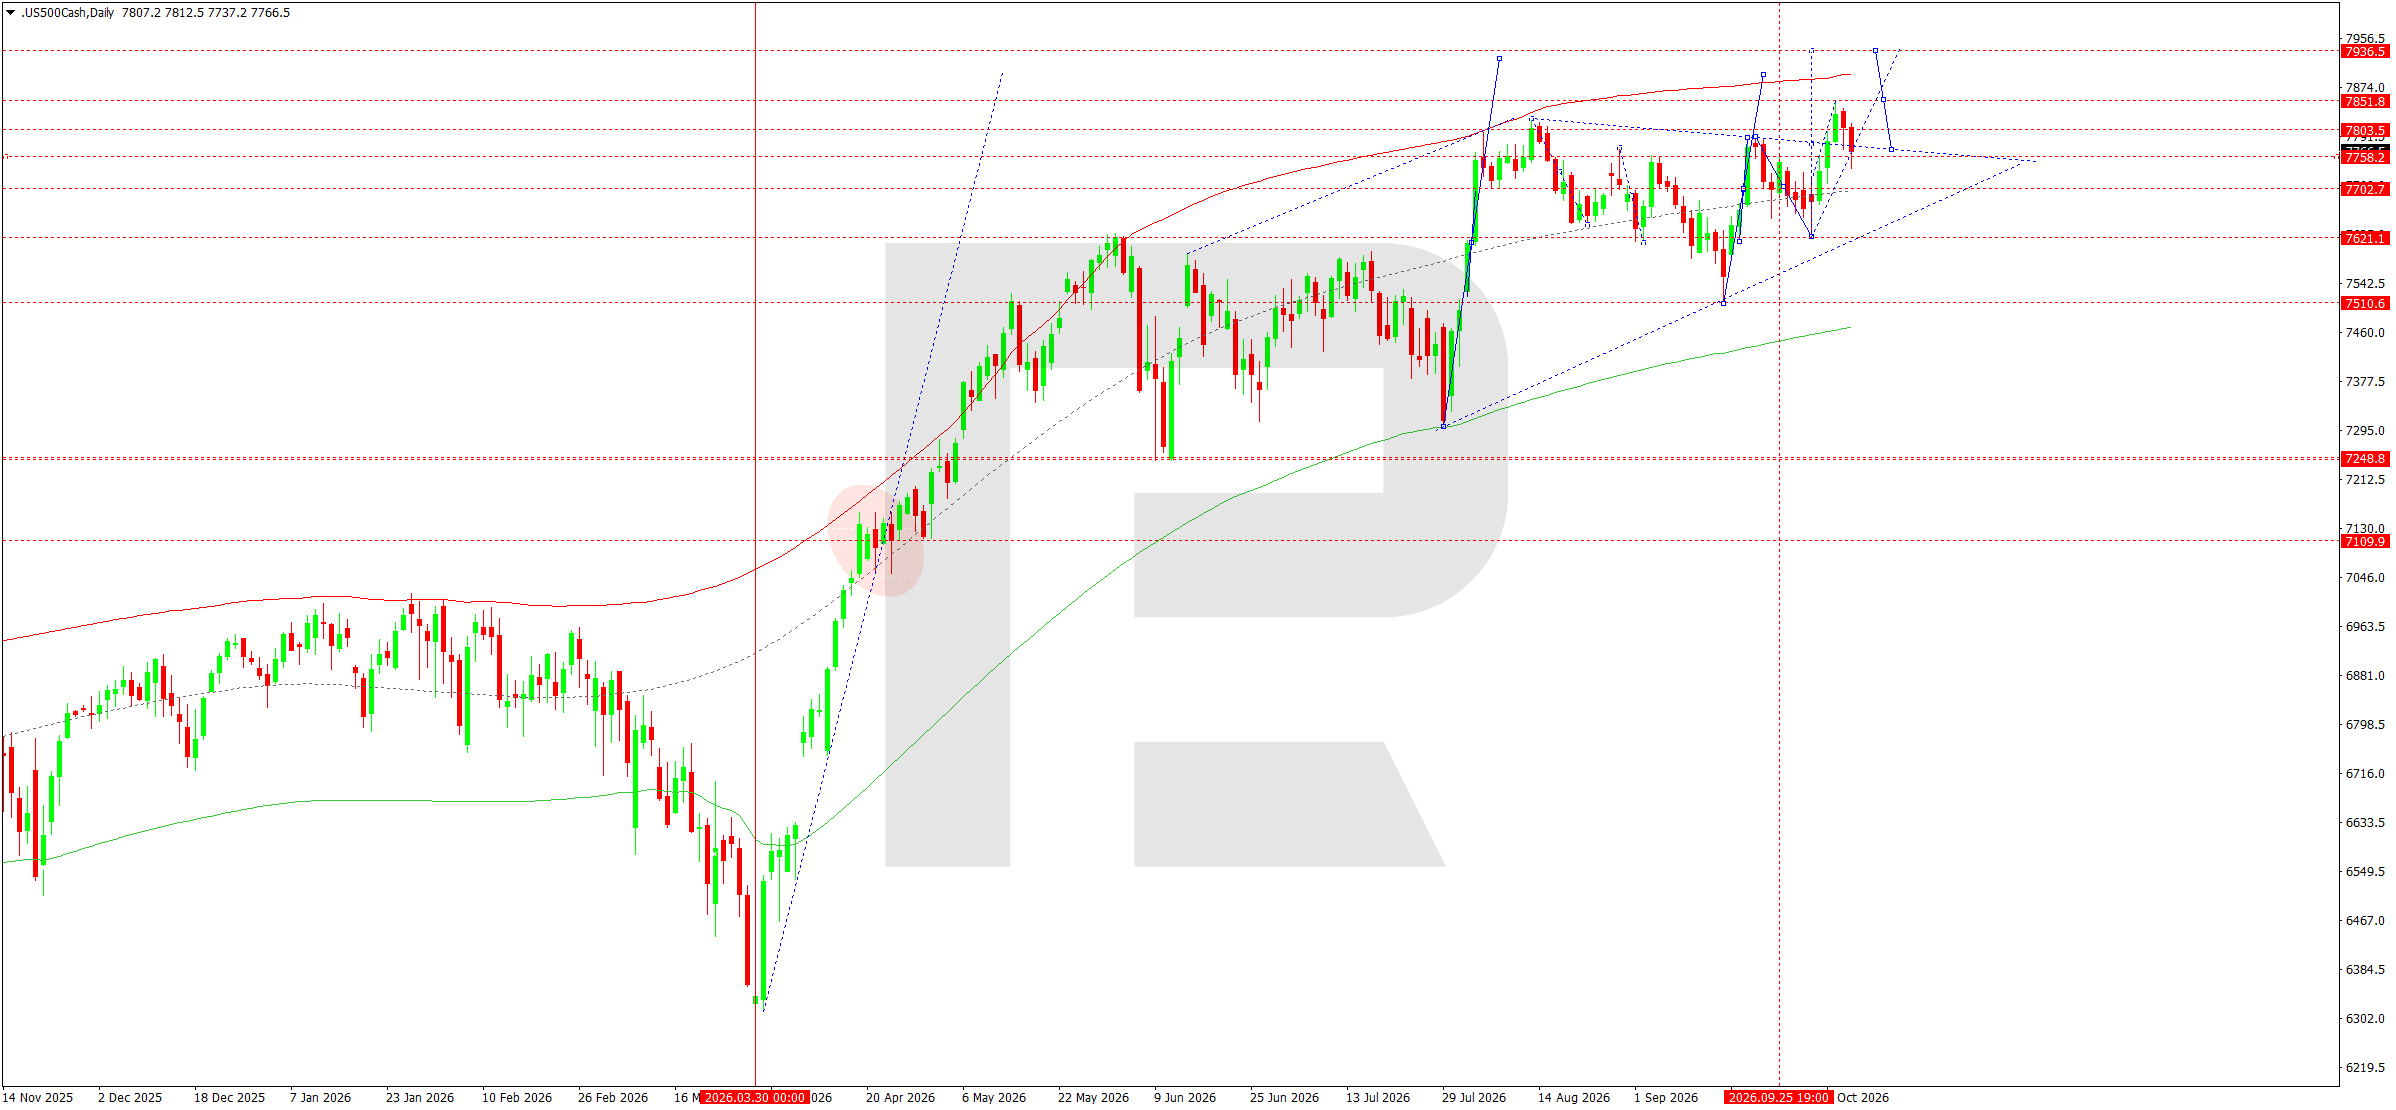
- US 500: Support: 7,758, 7,702. Resistance: 7,803, 7,852
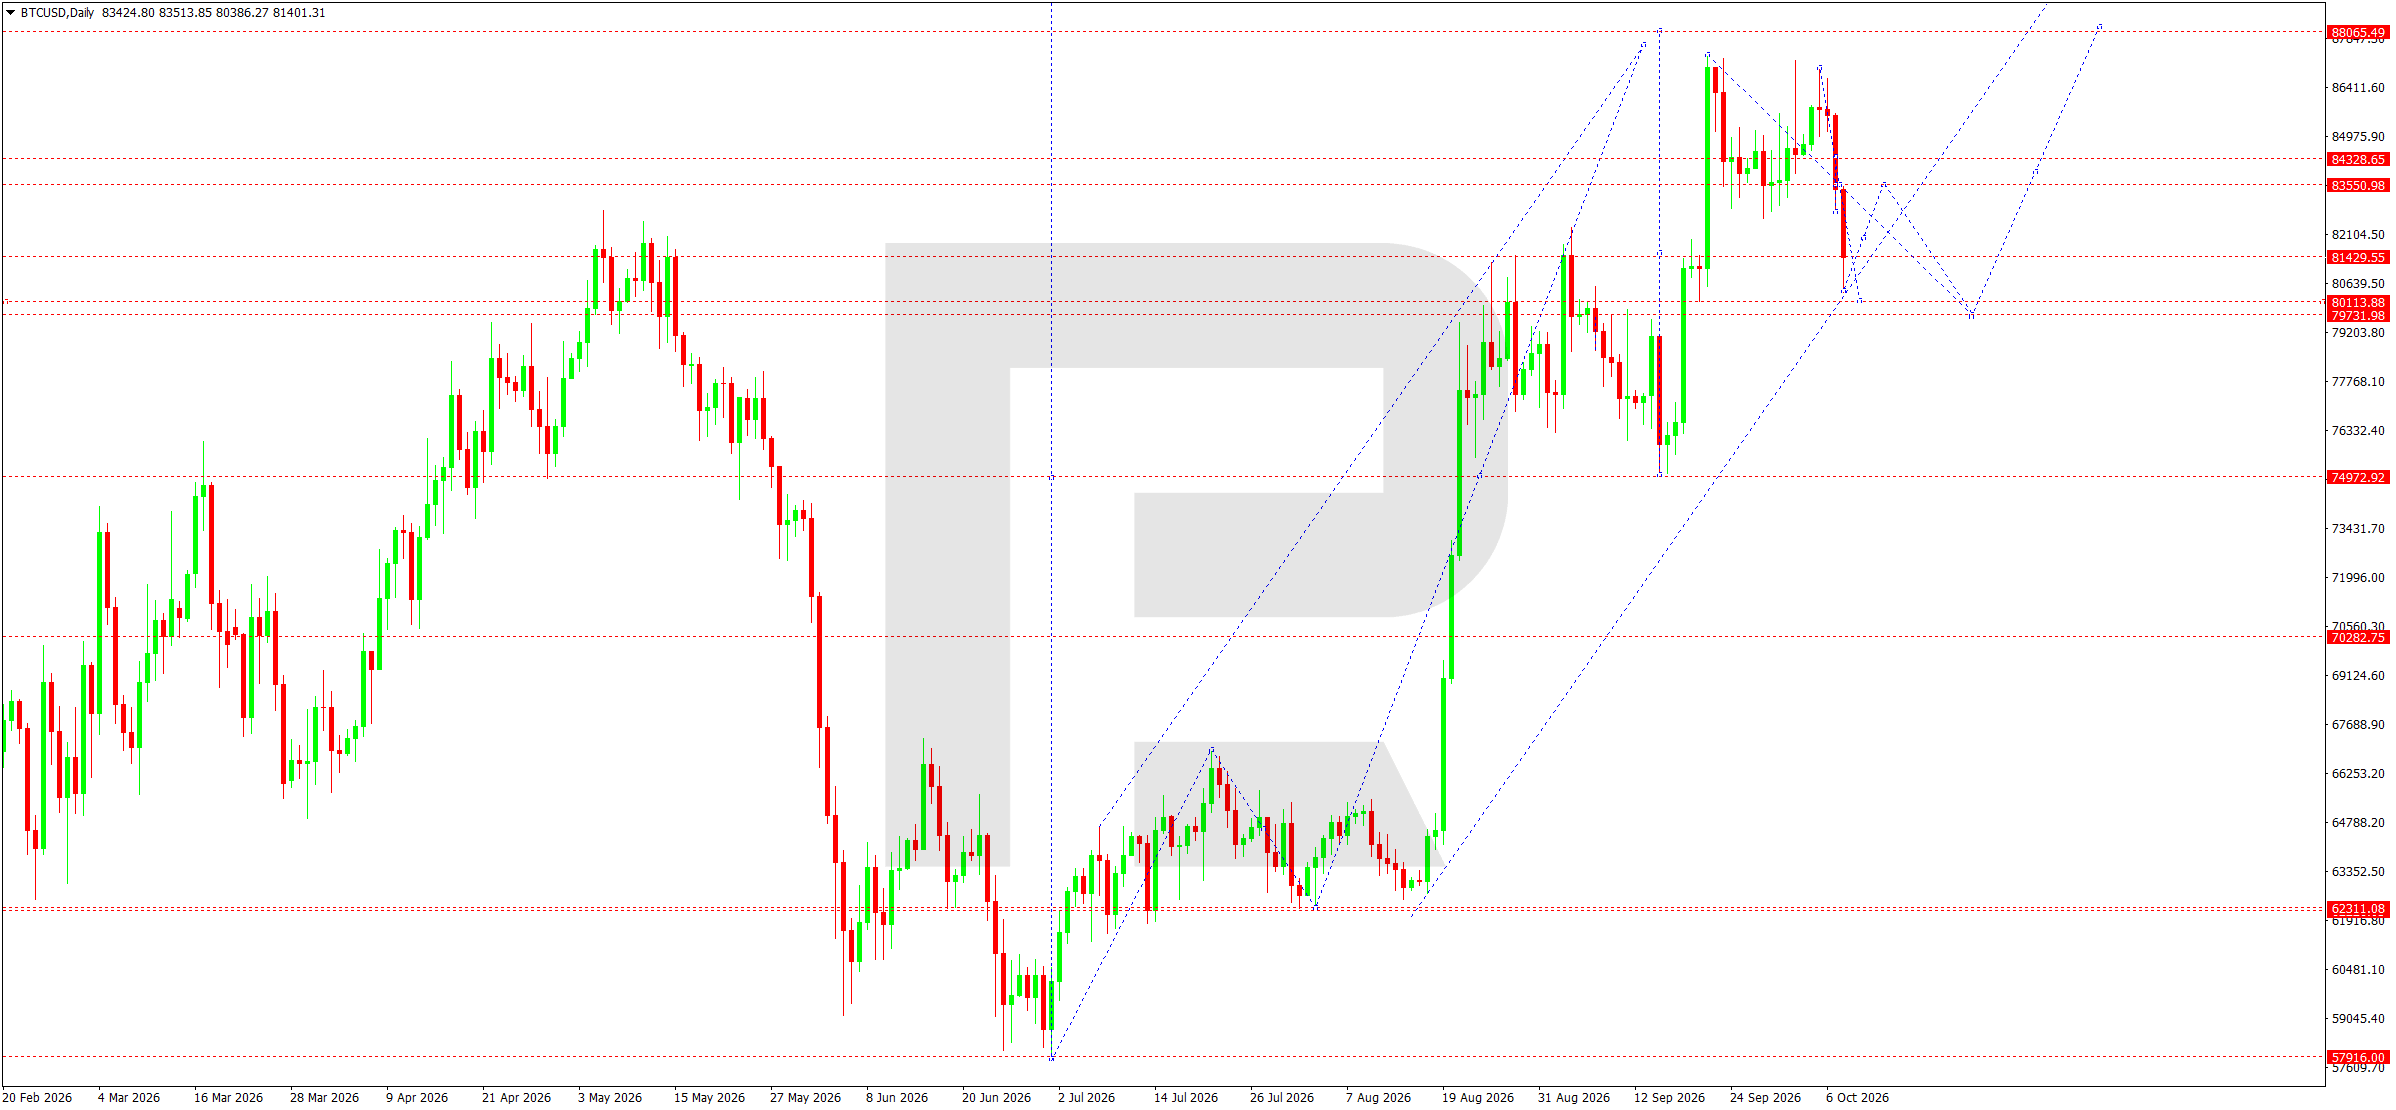
- BTCUSD: Support: 80,113, 79,731. Resistance: 81,249, 83,550
EURUSD forecast
The euro ends the trading week under pressure from the US dollar despite attempts at a technical recovery. The main factor remains the divergence in expectations regarding the monetary policies of the US Federal Reserve and the European Central Bank. High US bond yields, energy risks, and instability in European debt markets are also having an impact.
The published Fed minutes confirmed that the regulator continues to maintain a restrictive stance. Market participants continue to assess the probability of an additional interest rate increase before the end of the year. At the same time, the upcoming US inflation release could significantly change investor expectations. Persistent price pressure would support the US dollar, while slower inflation would create conditions for a correction in the currency pair.
In the eurozone, attention is focused on inflation, which has reached 3.8%, and on the prospects for further ECB tightening. Most economists surveyed expect the rate to remain unchanged in October, with a possible increase in December. However, France's fiscal problems and high energy costs limit the euro's appeal.
EURUSD technical analysis
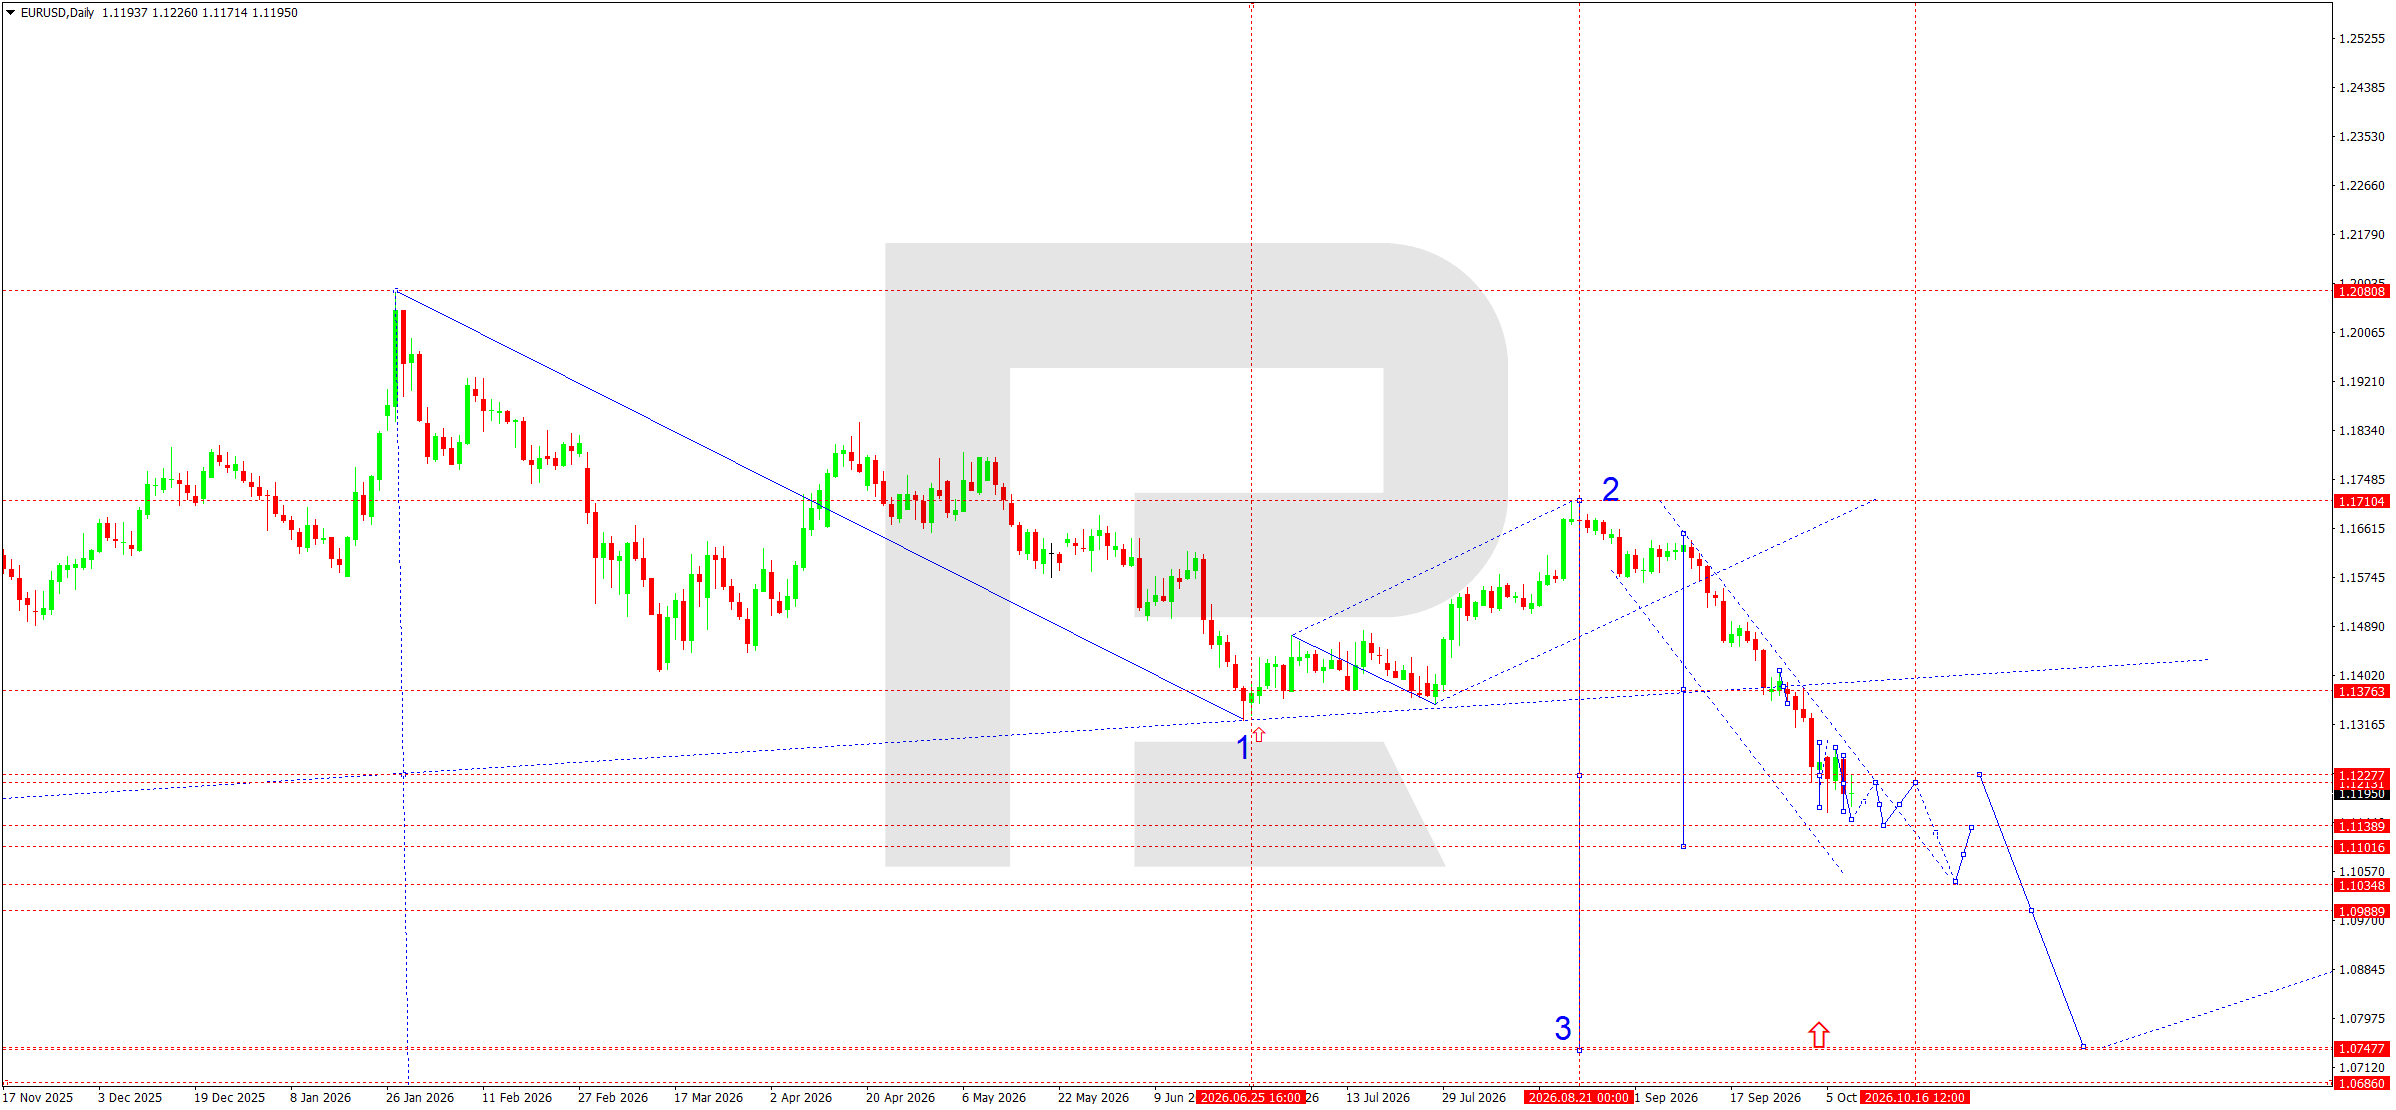
On the daily chart, EURUSD remains in a downtrend formed after the corrective upward wave ended around 1.1710. The subsequent decline became impulsive and corresponds to the development of the third wave in the direction of the main move.
During the decline, a consolidation range formed around 1.1227. A downside breakout confirmed the sellers' advantage and opened the way for a continuation towards the estimated local target at 1.1102.
The current structure allows for a short-term technical correction with another test of the 1.1227 area from below. This level is the nearest resistance and, at the same time, an important area for trading decisions. While quotes remain below it, selling remains the priority.
A breakout below support at 1.1139 would strengthen the downward impulse and allow a sequence of targets at 1.1102, 1.1035, and 1.0990 to be considered. A deeper development of the third wave implies a move towards the main medium-term target at 1.0748.
An alternative scenario involves consolidation above 1.1227. In that case, a correction towards 1.1376 would be possible, although such a move is still viewed purely as a recovery within the downward structure.
Therefore, for the week of 12–16 October, the main scenario remains a continuation of the decline after a possible corrective recovery. Selling remains the priority until there are sustained signs of a reversal in the daily structure and quotes return above the nearest resistance area.
EURUSD forecast scenario
Trading scenario: SELL
- Price at the time of writing: 1.1195
- Entry price: 1.1190
- Stop loss: 1.1230
- Take profit: 1.1102
- Risk-to-reward ratio: 1:2.20
The trade idea is valid until 8:00 AM on 17 October 2026 (server time, UTC+3).
USDJPY forecast
During the coming trading week, USDJPY price movements will be determined by the divergence in expectations regarding monetary policy in the US and Japan, changes in government bond yields, and investor sentiment towards risk assets. After significant fluctuations in September, the currency pair moved into a recovery phase, although the sustainability of the upward move still requires additional confirmation.
The key factor for the US dollar remains Federal Reserve policy. Market participants are assessing the outlook for interest rates in light of inflation, the state of the US labour market, and business activity. Persistently high Treasury yields could support the US dollar, while stronger expectations of Fed policy easing would limit the upside potential of USDJPY.
For the Japanese yen, the Bank of Japan's stance remains decisive. Possible further tightening of monetary conditions would increase the attractiveness of the national currency. Investors are also focusing on wage dynamics, consumer prices, and the resilience of domestic demand.
USDJPY technical analysis
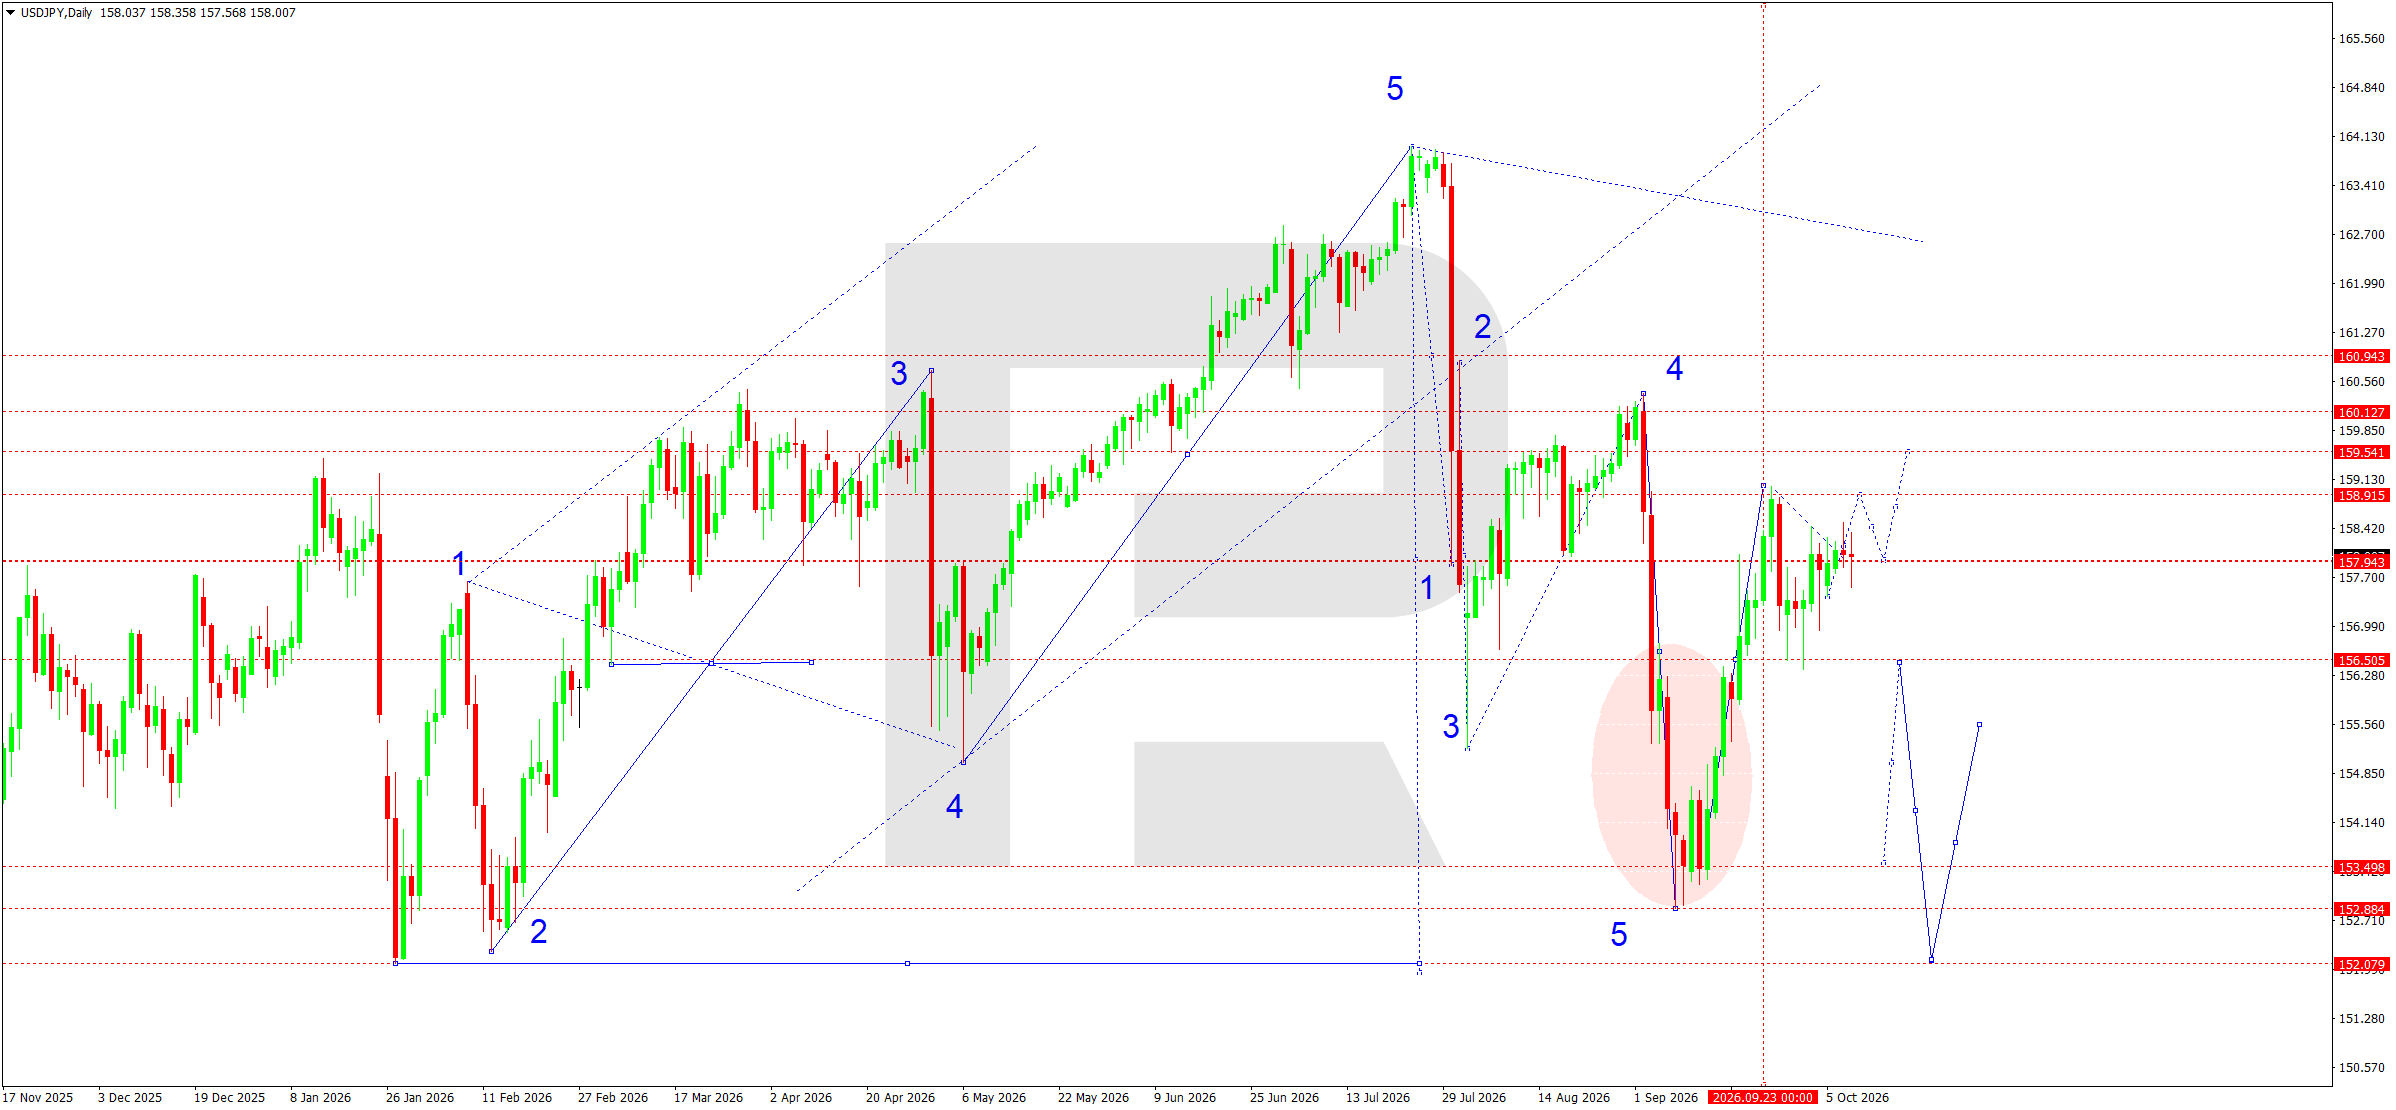
On the daily chart, USDJPY formed a recovery move after completing the fifth downward wave in the 152.88 area. The current structure is characterised by consolidation around the 157.94 pivot point, which serves as the main reference for the short-term direction.
As long as quotes remain above this level, the upward wave is expected to continue towards resistance at 158.92. After this area is tested, a local correction back towards 157.94 is likely. A successful retest of support would create conditions for the next upward impulse towards 159.54.
Intermediate resistance is located at 159.54, while the next significant target is at 160.13. Reaching the latter would confirm the development of a broader recovery after the September decline.
An alternative scenario involves consolidation below 157.94. In that case, the probability of a move towards 156.51 would increase, followed by a test of 153.50. The main trend is currently viewed as a recovery within the preceding downward move.
USDJPY forecast scenario
Trading scenario: BUY
- Price at the time of writing: 158.01
- Entry price: 158.06
- Stop loss: 157.56
- Take profit: 159.54
- Risk-to-reward ratio: 1:2.96
The trade idea is valid until 8:00 AM on 17 October 2026 (server time, UTC+3).
GBPUSD forecast
The British pound begins the 12–16 October trading week amid heightened uncertainty over the future monetary policies of the UK and the US. The main factor for GBPUSD remains the interest-rate differential, which determines the relative attractiveness of US dollar and UK assets.
Changes in government bond yields, inflation expectations, and global demand for safe-haven assets are also having an impact.
The Bank of England continues to balance the need to contain inflationary pressure against the risks of slowing economic activity. Wage, employment, and consumer-price data are crucial for the pound. Persistent services inflation could limit the scope for policy easing, while a deterioration in the labour market would strengthen the case for lower borrowing costs.
The Federal Reserve is also assessing the outlook for inflation and economic growth. Persistently high US Treasury yields support the dollar, particularly when investors' risk appetite declines. Conversely, falling yields could support a short-term recovery in GBPUSD.
During the coming week, market participants will focus on new macroeconomic releases, comments from central-bank officials, and changes in interest rate expectations. In the absence of a sustained improvement in UK data, the fundamental conditions for a prolonged strengthening of the pound remain limited.
GBPUSD technical analysis
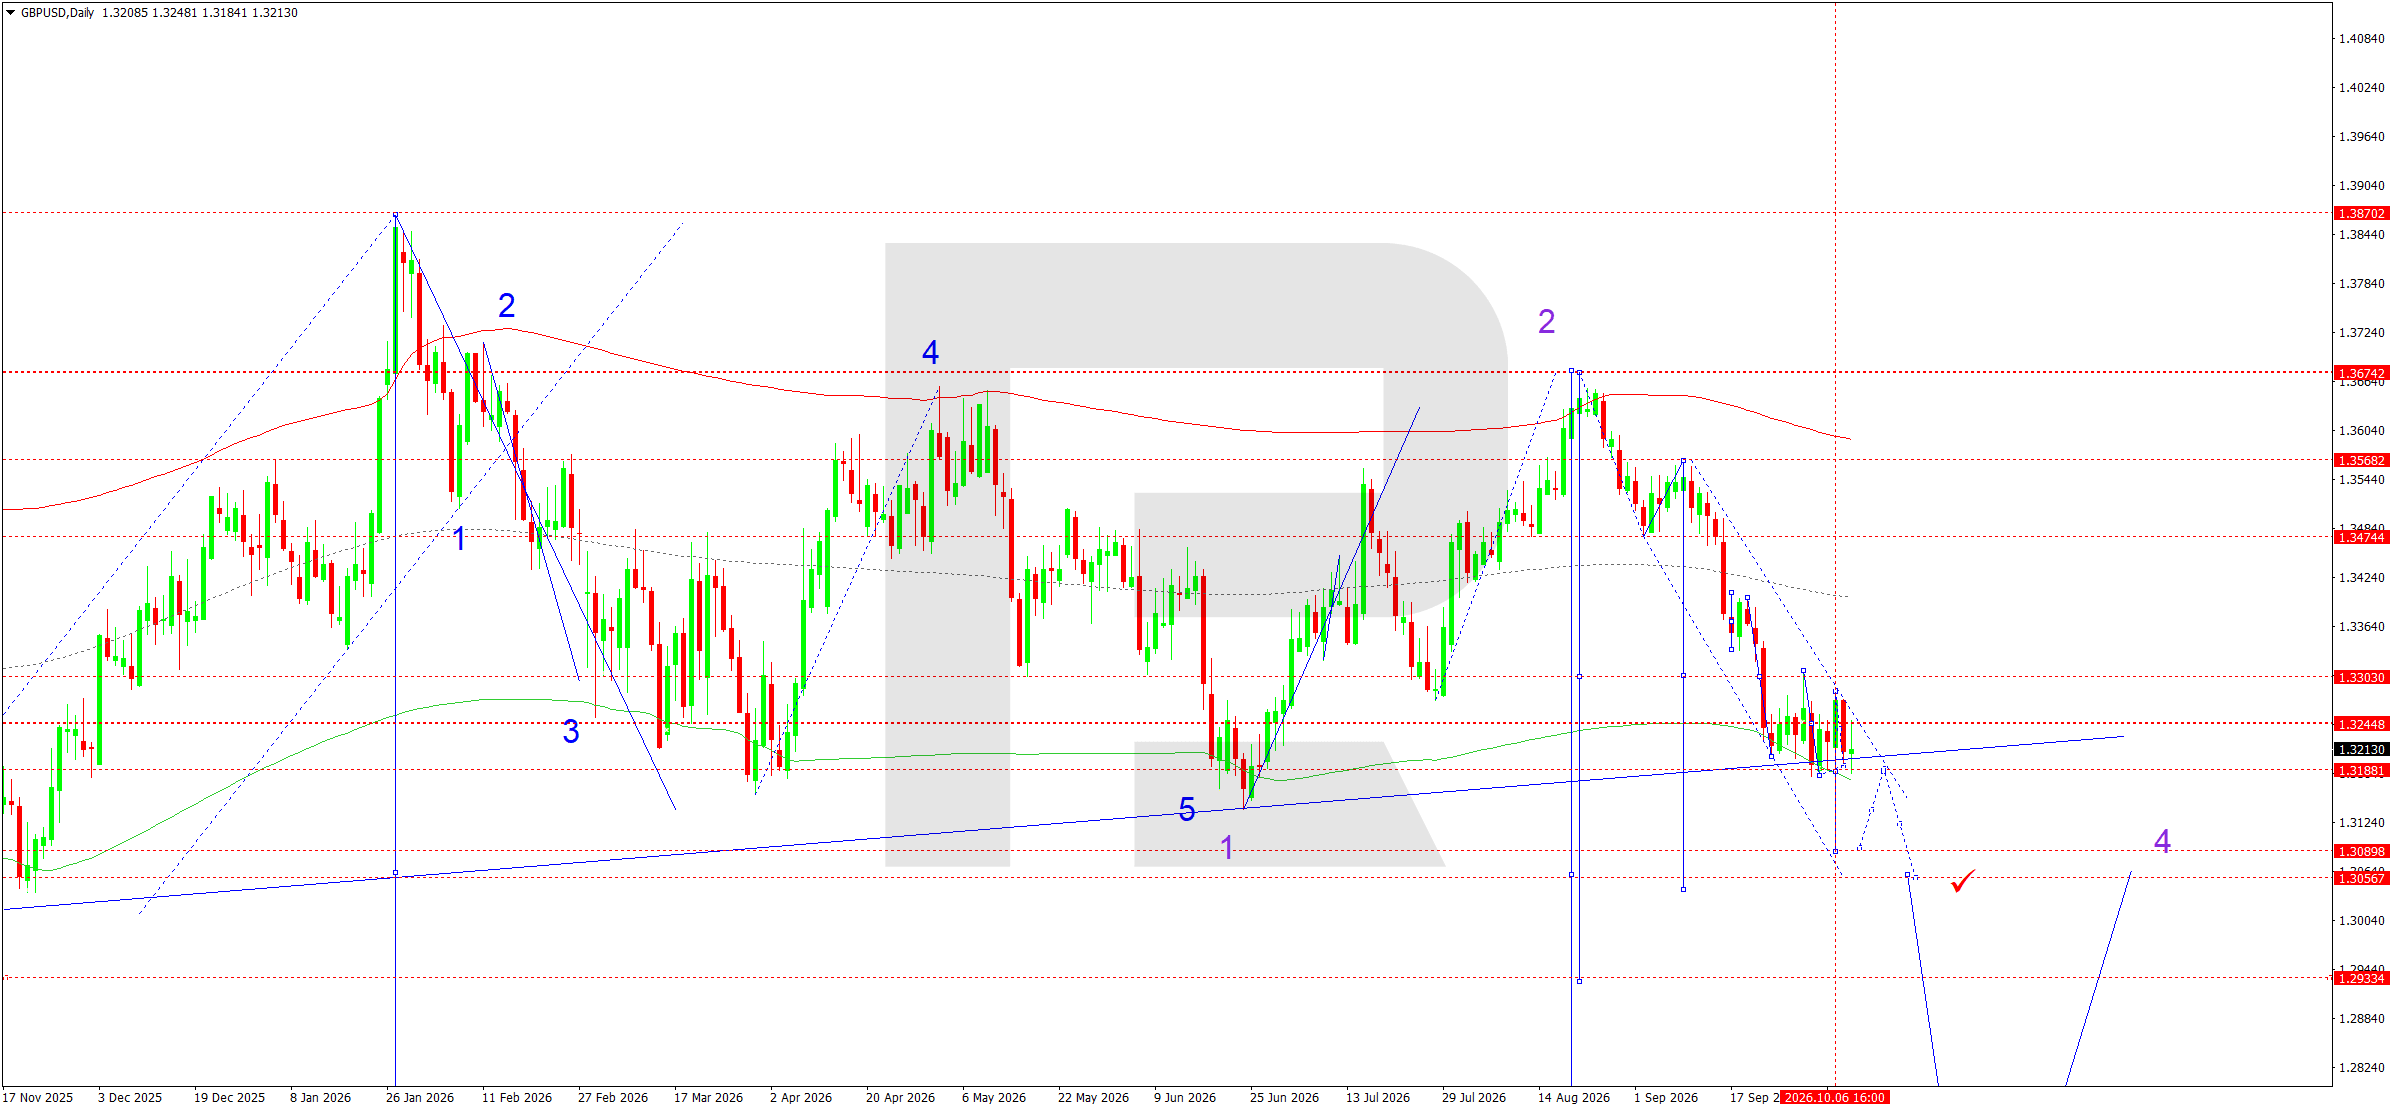
On the daily chart, GBPUSD retains a downward structure after the corrective second wave ended around 1.3674. The subsequent decline formed a sequence of lower highs, confirming the sellers' advantage. The current price is around 1.3213, directly above ascending trend support.
The pair completed a pivot structure around 1.3244, after which a downward impulse towards 1.3184 developed. During the coming week, a local consolidation range is expected to form above this support. Recovery attempts may be limited to the 1.3244–1.3303 area, where selling activity could resume.
The main scenario suggests a continuation of the downward wave towards 1.3090. After this level is reached, a brief consolidation is likely, followed by a move towards 1.3055. Consolidation below this level would create technical conditions for the development of the third Elliott downward wave.
In the medium term, the next reference points are 1.2933 and 1.2450. If the pronounced downward impulse persists, the move could extend towards 1.2260. Such a development would imply limited upward corrections and a sequence of new local lows.
GBPUSD forecast scenario
Trading scenario: SELL
- Price at the time of writing: 1.3213
- Entry price: 1.3208
- Stop loss: 1.3303
- Take profit: 1.3055
- Risk-to-reward ratio: 1:1.61
The trade idea is valid until 8:00 AM on 17 October 2026 (server time, UTC+3).
AUDUSD forecast
The Australian dollar ends the trading week under pressure from the US currency, remaining dependent on differences in the monetary policies of Australia and the US. The main factors for AUDUSD remain interest rate expectations, government bond yield dynamics, the outlook for the Chinese economy, and changes in global risk appetite.
The Reserve Bank of Australia continues to pay close attention to the persistence of inflationary pressure, domestic demand, and labour-market conditions. The assessment of the future interest-rate path is crucial for the Australian currency. A persistently restrictive RBA stance could limit declines in AUDUSD, while weaker Australian economic data would strengthen expectations of monetary easing.
On the US side, Federal Reserve policy is the decisive influence. Investors are assessing the outlook for borrowing costs, inflation dynamics, and the resilience of the US labour market. Rising US Treasury yields support the dollar and limit the Australian currency's recovery potential. Falling yields, by contrast, could create conditions for a short-term correction in AUDUSD.
AUDUSD technical analysis
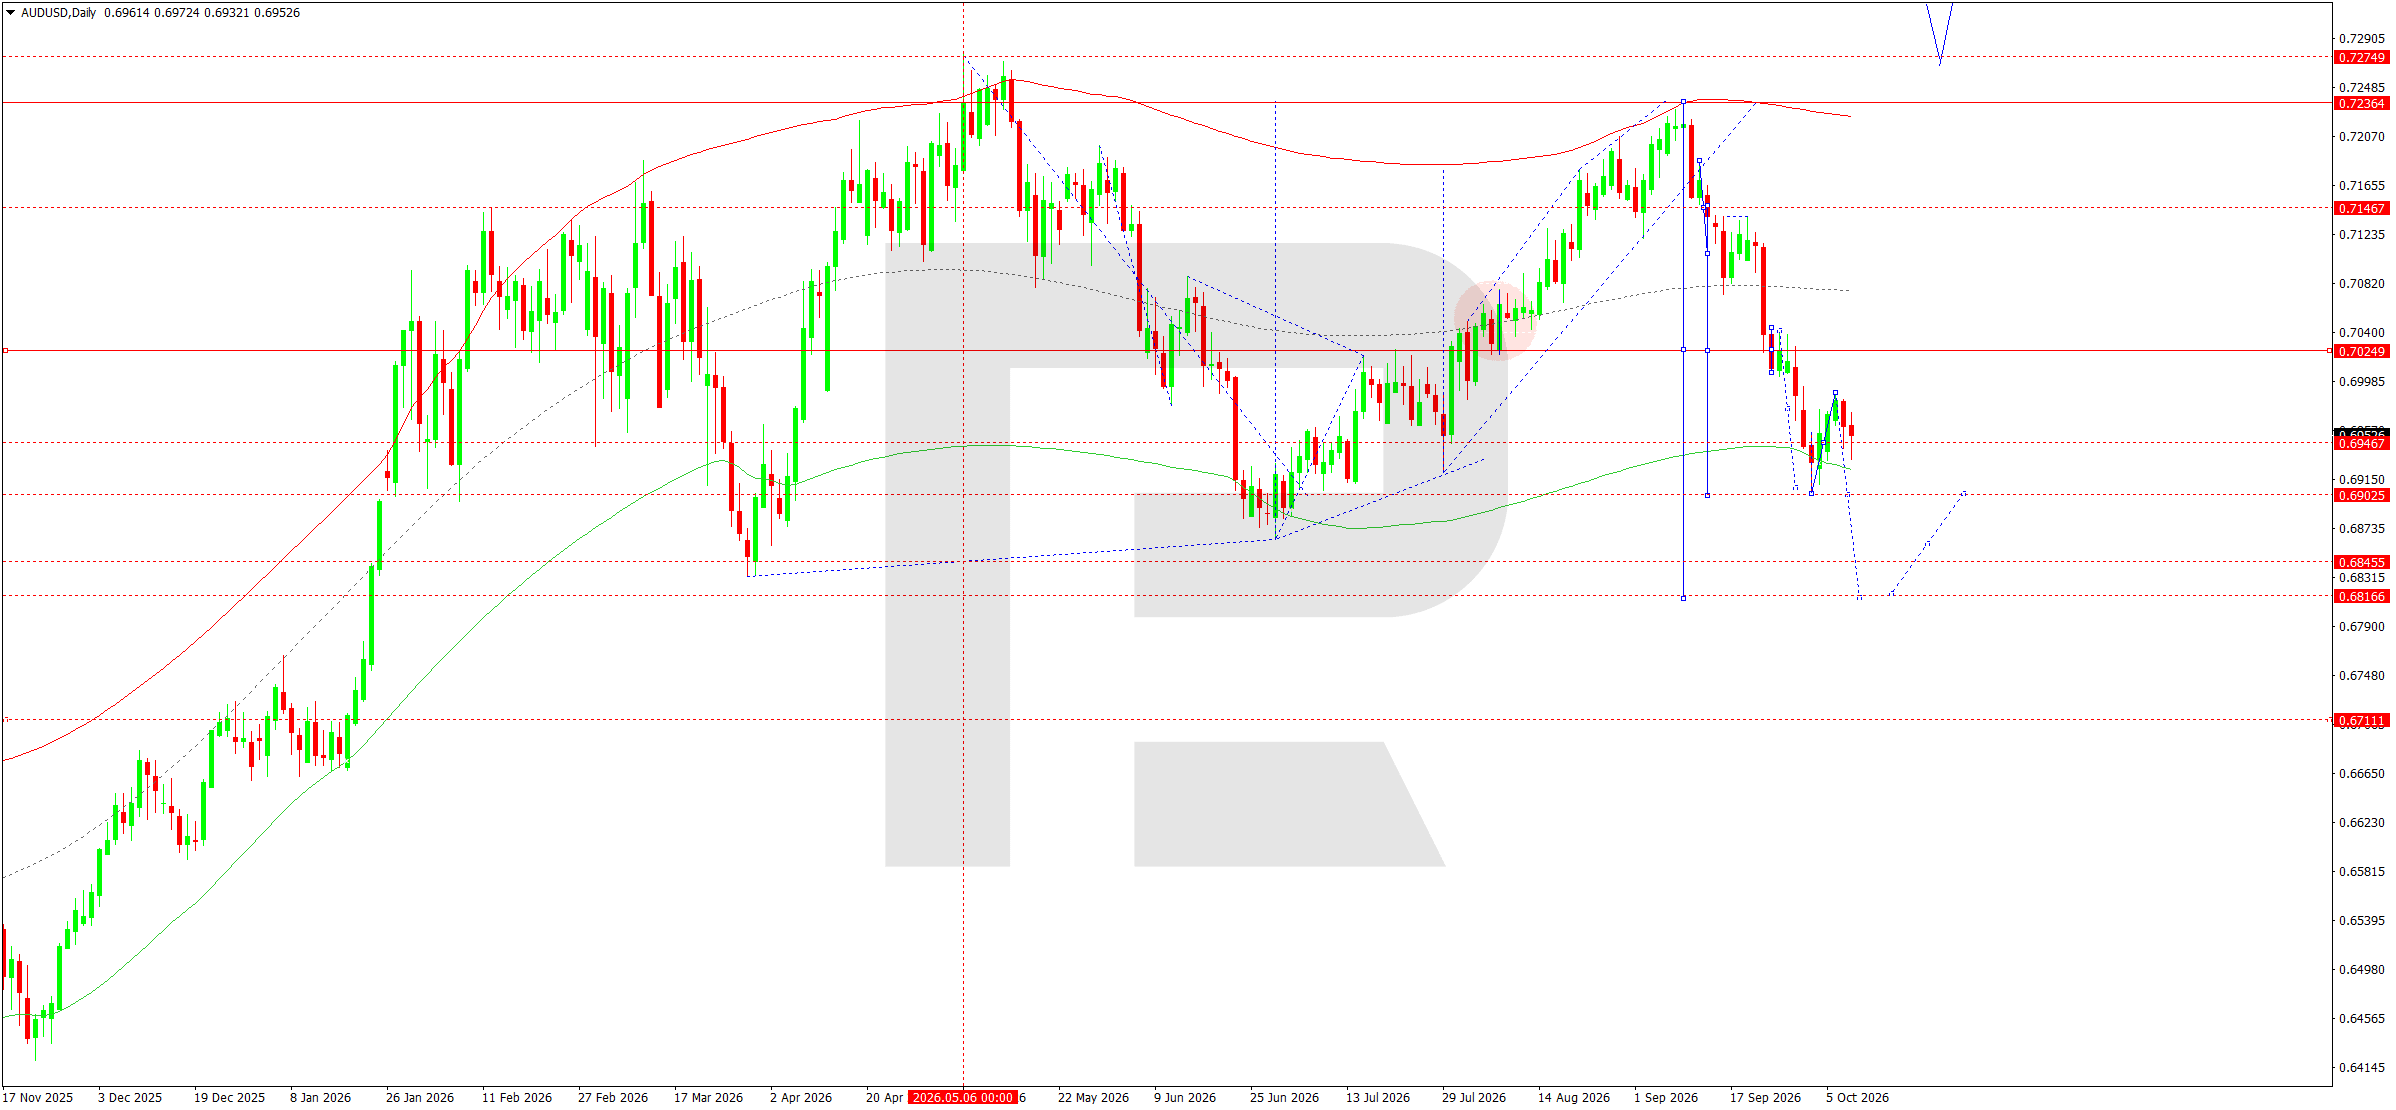
On the daily chart, AUDUSD remains in a downward structure after the upward wave ended around 0.7236. The subsequent decline formed a sequence of lower highs and lower lows, confirming the sellers' advantage. The price reached support at 0.6903, after which a local correction towards 0.6988 began.
Within the Elliott wave model, the current recovery is viewed as a corrective phase within the main downward move. A continuation of the rise towards 0.7025 cannot be ruled out, where important resistance and the previous breakout area are located. Remaining below this level would preserve the likelihood of another downward impulse.
The main scenario assumes the correction will end and the decline will resume towards 0.6903. A breakout below this support would open the way towards 0.6846 and the main target at 0.6817. This area is expected to complete another downward wave and create conditions for a subsequent corrective recovery.
After 0.6817 is reached, an upward correction towards 0.6920 is likely. A return above 0.7025 would weaken the bearish scenario and create conditions for a more prolonged recovery. However, while the price remains below this resistance, selling on corrective rises remains the priority.
Therefore, the coming week is expected to begin with a recovery in AUDUSD, followed by another downward move.
The main medium-term trend remains bearish, with the stability of resistance at 0.7025 being the key condition for its continuation. New lows on lower timeframes would provide additional confirmation.
AUDUSD forecast scenario
Trading scenario: SELL
- Price at the time of writing: 0.6953
- Entry price: 0.6948
- Stop loss: 0.7030
- Take profit: 0.6817
- Risk-to-reward ratio: 1:1.60
The trade idea is valid until 8:00 AM on 17 October 2026 (server time, UTC+3).
USDCAD forecast
During the coming trading week, USDCAD dynamics will be determined by diverging expectations regarding monetary policy in the US and Canada, conditions in the oil market, and changes in demand for the US dollar. After a prolonged strengthening of the US currency, market participants are assessing the sustainability of the pair's upward move and the probability of a technical correction.
Particular attention will be paid to the outlook for US Federal Reserve policy. The future path of interest rates depends on inflation data, labour-market conditions, and the resilience of consumer demand. Persistently high US government bond yields could support the dollar, while stronger expectations of policy easing would create conditions for it to weaken.
For the Canadian currency, decisions by the Bank of Canada, employment data, consumer inflation, and the economic growth outlook remain decisive. Oil prices are an additional factor. Stronger oil traditionally supports the Canadian dollar, although the influence of the commodity market may weaken if global demand for safe-haven assets changes significantly.
Throughout the week, investors' reaction to incoming macroeconomic data will be important. In the absence of material changes in the fundamental backdrop, elevated volatility with a gradual transition of the pair into a corrective phase appears the most likely scenario.
USDCAD technical analysis
On the daily chart, USDCAD retains an upward structure formed by a sequence of Elliott waves. After the fourth corrective wave ended around 1.3763, buyers regained the initiative, allowing the fifth wave to develop and reach intermediate resistance at 1.4292.
The current technical picture suggests that the local impulse is nearing completion and a corrective leg may form. The initial downside target is the 1.4197 area, where buyers could emerge and quotes may move into a consolidation range. Holding this support would create conditions for the rise to resume.
The next target for buyers is resistance at 1.4327. If positive momentum persists, a short-term extension towards 1.4338 is possible. Reaching this area could complete the five-wave upward structure and create conditions for a deeper correction.
In the medium term, once the rise is complete, a downward leg towards the psychological 1.4000 level is possible. Additional confirmation would come from consolidation below 1.4197 followed by a retest of the broken support from below.
The main daily trend remains upward for now, although the price approaching the upper boundary of the projected range increases the probability of profit-taking. The priority scenario for the week is an initial decline towards 1.4197 followed by an assessment of the potential for a price recovery. A breakout above resistance at 1.4338 could temporarily invalidate the corrective scenario and extend the upward impulse.
USDCAD forecast scenario
Trading scenario: SELL
- Price at the time of writing: 1.4238
- Entry price: 1.4233
- Stop loss: 1.4340
- Take profit: 1.4197
- Risk-to-reward ratio: 1:0.34
The trade idea is valid until 8:00 AM on 17 October 2026 (server time, UTC+3).
XAUUSD forecast
During the coming trading week, gold dynamics will be determined by expectations regarding the future monetary policy of the US Federal Reserve, changes in US government bond yields, and the behaviour of the US dollar. Market participants are primarily focused on the outlook for interest rates, the persistence of inflationary pressure, and the state of the US economy.
For gold, the relationship between real bond yields and investment demand for safe-haven assets is crucial. Falling government bond yields could support a recovery in prices, while a stronger US dollar and higher yields would limit buyers' opportunities. Geopolitical uncertainty remains an additional factor that can periodically strengthen demand for precious metals.
Upcoming US macroeconomic releases and comments from Fed officials could change investors' expectations regarding the future rate path. At the same time, short-term upward moves in gold should still be viewed in the context of the ongoing technical correction, as there are not yet enough sustained signs of a recovery in the medium-term uptrend.
XAUUSD technical analysis
On the daily chart, XAUUSD retains a downward structure formed after the August high. Within the Elliott wave model, the final segment of the fifth downward wave is developing. The price reached the 4,068 area, after which a recovery impulse towards 4,190 formed.
However, buyers have not yet consolidated above the nearest resistance levels.
The market is currently consolidating around 4,144, which acts as a short-term pivot point. The nearest resistance is at 4,216. A breakout above this level would create conditions for continued corrective growth towards 4,313, where selling activity is expected to strengthen again.
The position of quotes below the long-term moving average confirms that the predominantly bearish direction remains intact. At the same time, the price approaching the lower boundary of the established range increases the probability of a temporary recovery before the next downward impulse.
The main scenario suggests corrective growth towards 4,313 followed by a reversal and decline towards 3,998 and 3,927. Consolidation below 3,998 would confirm the development of the final wave of the downward structure. An alternative scenario involves a recovery above 4,313, although sellers retain the advantage until this level is broken.
XAUUSD forecast scenario
Trading scenario: SELL
- Price at the time of writing: 4,131
- Entry price: 4,126
- Stop loss: 4,320
- Take profit: 3,998
- Risk-to-reward ratio: 1:0.66
The trade idea is valid until 8:00 AM on 17 October 2026 (server time, UTC+3).
US 500 forecast
During the coming trading week, the US 500 stock index retains the potential to continue rising, although its proximity to historically high price levels increases the probability of short-term consolidation. Market participants will focus primarily on the outlook for US Federal Reserve monetary policy, inflation dynamics, and the state of the US economy.
Expectations regarding the future path of interest rates will remain the key factor. Falling US government bond yields could support technology shares and other index constituents. Conversely, a stronger US dollar and rising Treasury yields could limit buying activity, particularly among companies with high market valuations.
Macroeconomic releases reflecting the resilience of consumer demand, labour-market conditions, and price pressure will also have an impact. Investors will assess incoming data in terms of whether the Fed can continue easing monetary conditions without materially weakening economic activity.
US 500 technical analysis
On the daily chart, US 500 remains in an uptrend formed after the March reversal. The sequence of higher lows confirms the buyers' dominance despite periodic corrective moves. The latest downward wave ended around 7,739, after which a recovery impulse towards resistance at 7,800 followed.
During the coming week, a consolidation range is expected to form around 7,800. This area is the nearest pivot point determining the next direction. Holding above support at 7,758 would create conditions for continuation of the upward wave, with an initial target at 7,852.
A breakout above this resistance would allow the next impulse towards 7,936 to be considered. As the upward wave structure expands, additional reference points are 7,870 and 7,921, corresponding to the projected intermediate targets for buyers.
The position of the price relative to the ascending trend line confirms that the positive medium-term structure remains intact. At the same time, proximity to the upper boundary of the price Envelope indicates the likelihood of local pullbacks before the next stage of growth.
An alternative scenario involves consolidation below 7,758 followed by a decline towards 7,702. A deeper correction could take the index towards support at 7,621, although this option is currently considered secondary.
The main weekly forecast suggests consolidation near 7,800 followed by a continuation of the rise. Confirmation would come from a sustained breakout above the nearest resistance while buying activity remains intact.
US 500 forecast scenario
Trading scenario: BUY
- Price at the time of writing: 7,766
- Entry price: 7,771
- Stop loss: 7,735
- Take profit: 7,870
- Risk-to-reward ratio: 1:2.75
The trade idea is valid until 8:00 AM on 17 October 2026 (server time, UTC+3).
BTCUSD forecast
During the coming trading week, Bitcoin dynamics will be determined by changing expectations regarding US monetary policy, the state of US dollar liquidity, and international investors' attitude towards risk assets. After a period of active growth, the cryptocurrency market is moving to assess the sustainability of the price levels reached. Increased volatility raises the probability of corrective moves, especially after local highs have formed.
Federal Reserve policy remains the most important fundamental factor. The outlook for interest rate changes directly affects the attractiveness of speculative instruments. Falling US government bond yields could support demand for Bitcoin, while a stronger US dollar and higher real yields would create conditions for profit-taking.
Market participants will pay particular attention to new inflation data, the state of the US labour market, and comments from Fed officials. Releases capable of changing expectations regarding the future rate path could trigger sharp fluctuations in BTCUSD. At the same time, the cryptocurrency market's reaction will depend not only on the absolute values of the indicators but also on how actual results differ from forecasts.
BTCUSD technical analysis
On the daily chart, BTCUSD retains an upward structure formed after the reversal from 57,916. The subsequent impulse allowed the market to reach the 88,065 area, after which a corrective wave began to develop. The current decline is viewed as an intermediate move within a larger Elliott upward pattern.
As part of the correction, the market declined towards 80,433 and then formed a recovery impulse towards 82,610. During the coming week, a consolidation range is expected to form below this resistance. The main short-term scenario is a continuation of the decline towards 79,892, where the nearest potential demand area is located.
After this level is reached, an upward correction towards 83,550 is possible. This level is an important technical resistance and may limit the buyers' recovery. Completion of the corrective move would create conditions for another decline towards 79,731, corresponding to the lower boundary of the projected structure.
The wave configuration suggests that the local corrective cycle may end directly in the 79,731 area. If this support holds, a new upward impulse is likely to form, with a successive recovery above 81,249 and 84,328. The main medium-term target for buyers remains 88,065.
A breakout below support at 79,731 would require a reassessment of the scenario and increase the probability of a deeper correction. Until a confirmed reversal appears, sellers retain the short-term advantage despite the positive medium-term market structure.
BTCUSD forecast scenario
Trading scenario: SELL
- Price at the time of writing: 81,401
- Entry price: 81,396
- Stop loss: 82,610
- Take profit: 79,892
- Risk-to-reward ratio: 1:1.24
The trade idea is valid until 8:00 AM on 17 October 2026 (server time, UTC+3).
Editors’ picks
 EURUSD forecast 2026–2027: technical analysis, price levels & predictions
The EURUSD outlook for 2026 and 2027: key levels on the daily chart, three trading scenarios and the policy gap between the Fed and the ECB that drives the pair.
 Gold (XAUUSD) forecast 2026: technical analysis, price levels & predictions
Where gold could trade in 2026: key levels, three trading scenarios with entry triggers and the forecasts from J.P. Morgan, Deutsche Bank and Goldman Sachs.
Forecasts presented in this section only reflect the author’s private opinion and should not be considered as guidance for trading. RoboForex bears no responsibility for trading results based on trading recommendations described in these analytical reviews.