
Weekly technical analysis and forecast (19–23 October 2026)
In this weekly technical analysis, we examine the key chart patterns and price levels for EURUSD, USDJPY, GBPUSD, AUDUSD, USDCAD, gold (XAUUSD), US 500, and Bitcoin (BTCUSD) to forecast market developments for the week ahead (19–23 October 2026).
Major technical levels to watch this week
- EURUSD: Support: 1.1112, 1.1037. Resistance: 1.1223, 1.1379
- USDJPY: Support: 157.57, 156.47. Resistance: 158.94, 160.06
- GBPUSD: Support: 1.3179, 1.3137. Resistance: 1.3235, 1.3363
- AUDUSD: Support: 0.6893, 0.6843. Resistance: 0.6929, 0.6961
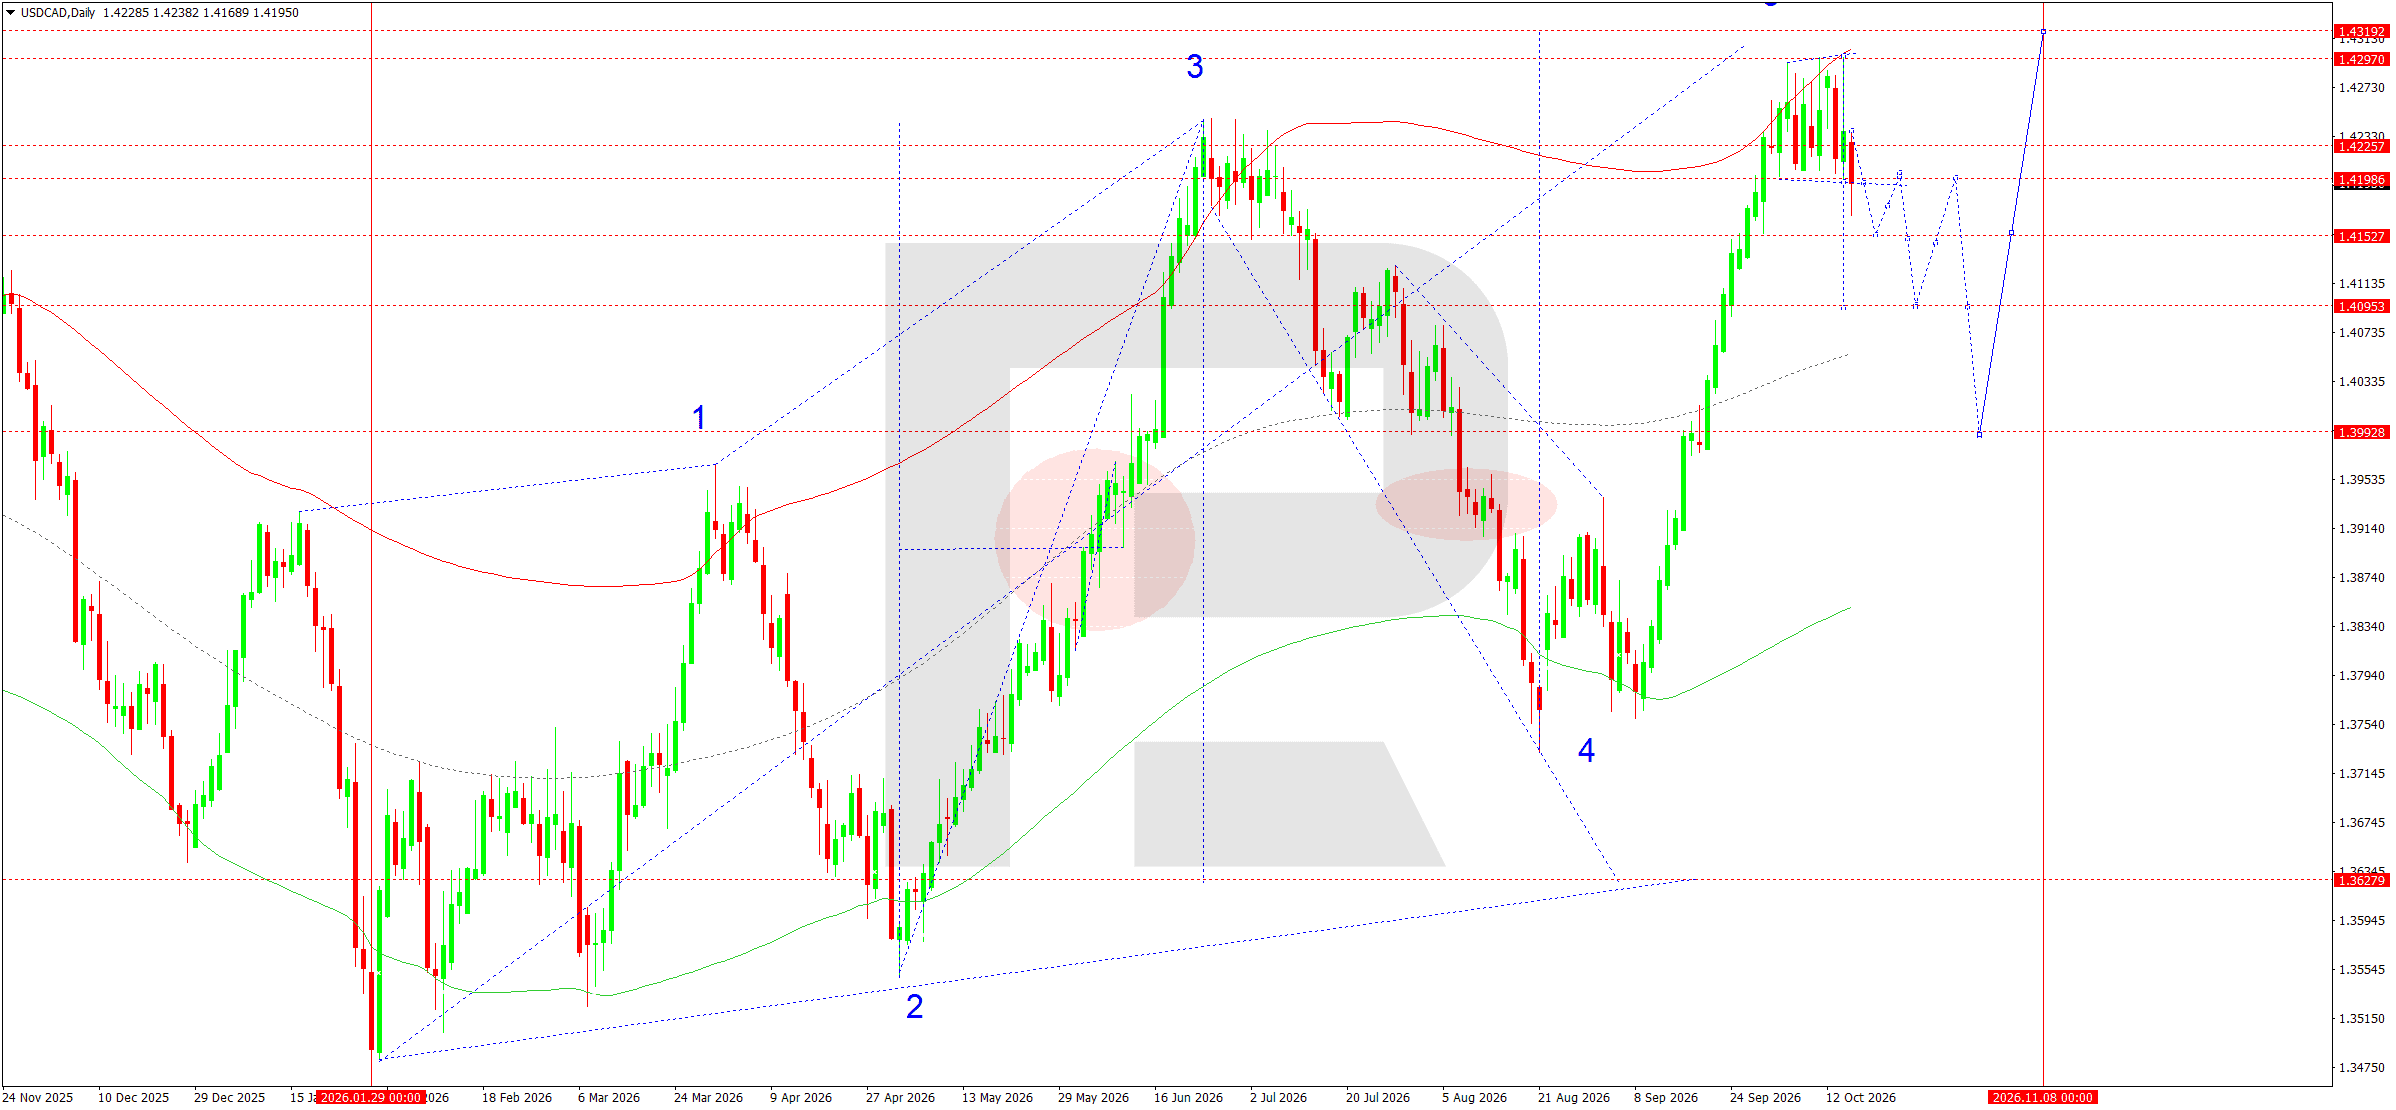
- USDCAD: Support: 1.4153, 1.4095. Resistance: 1.4226, 1.4297
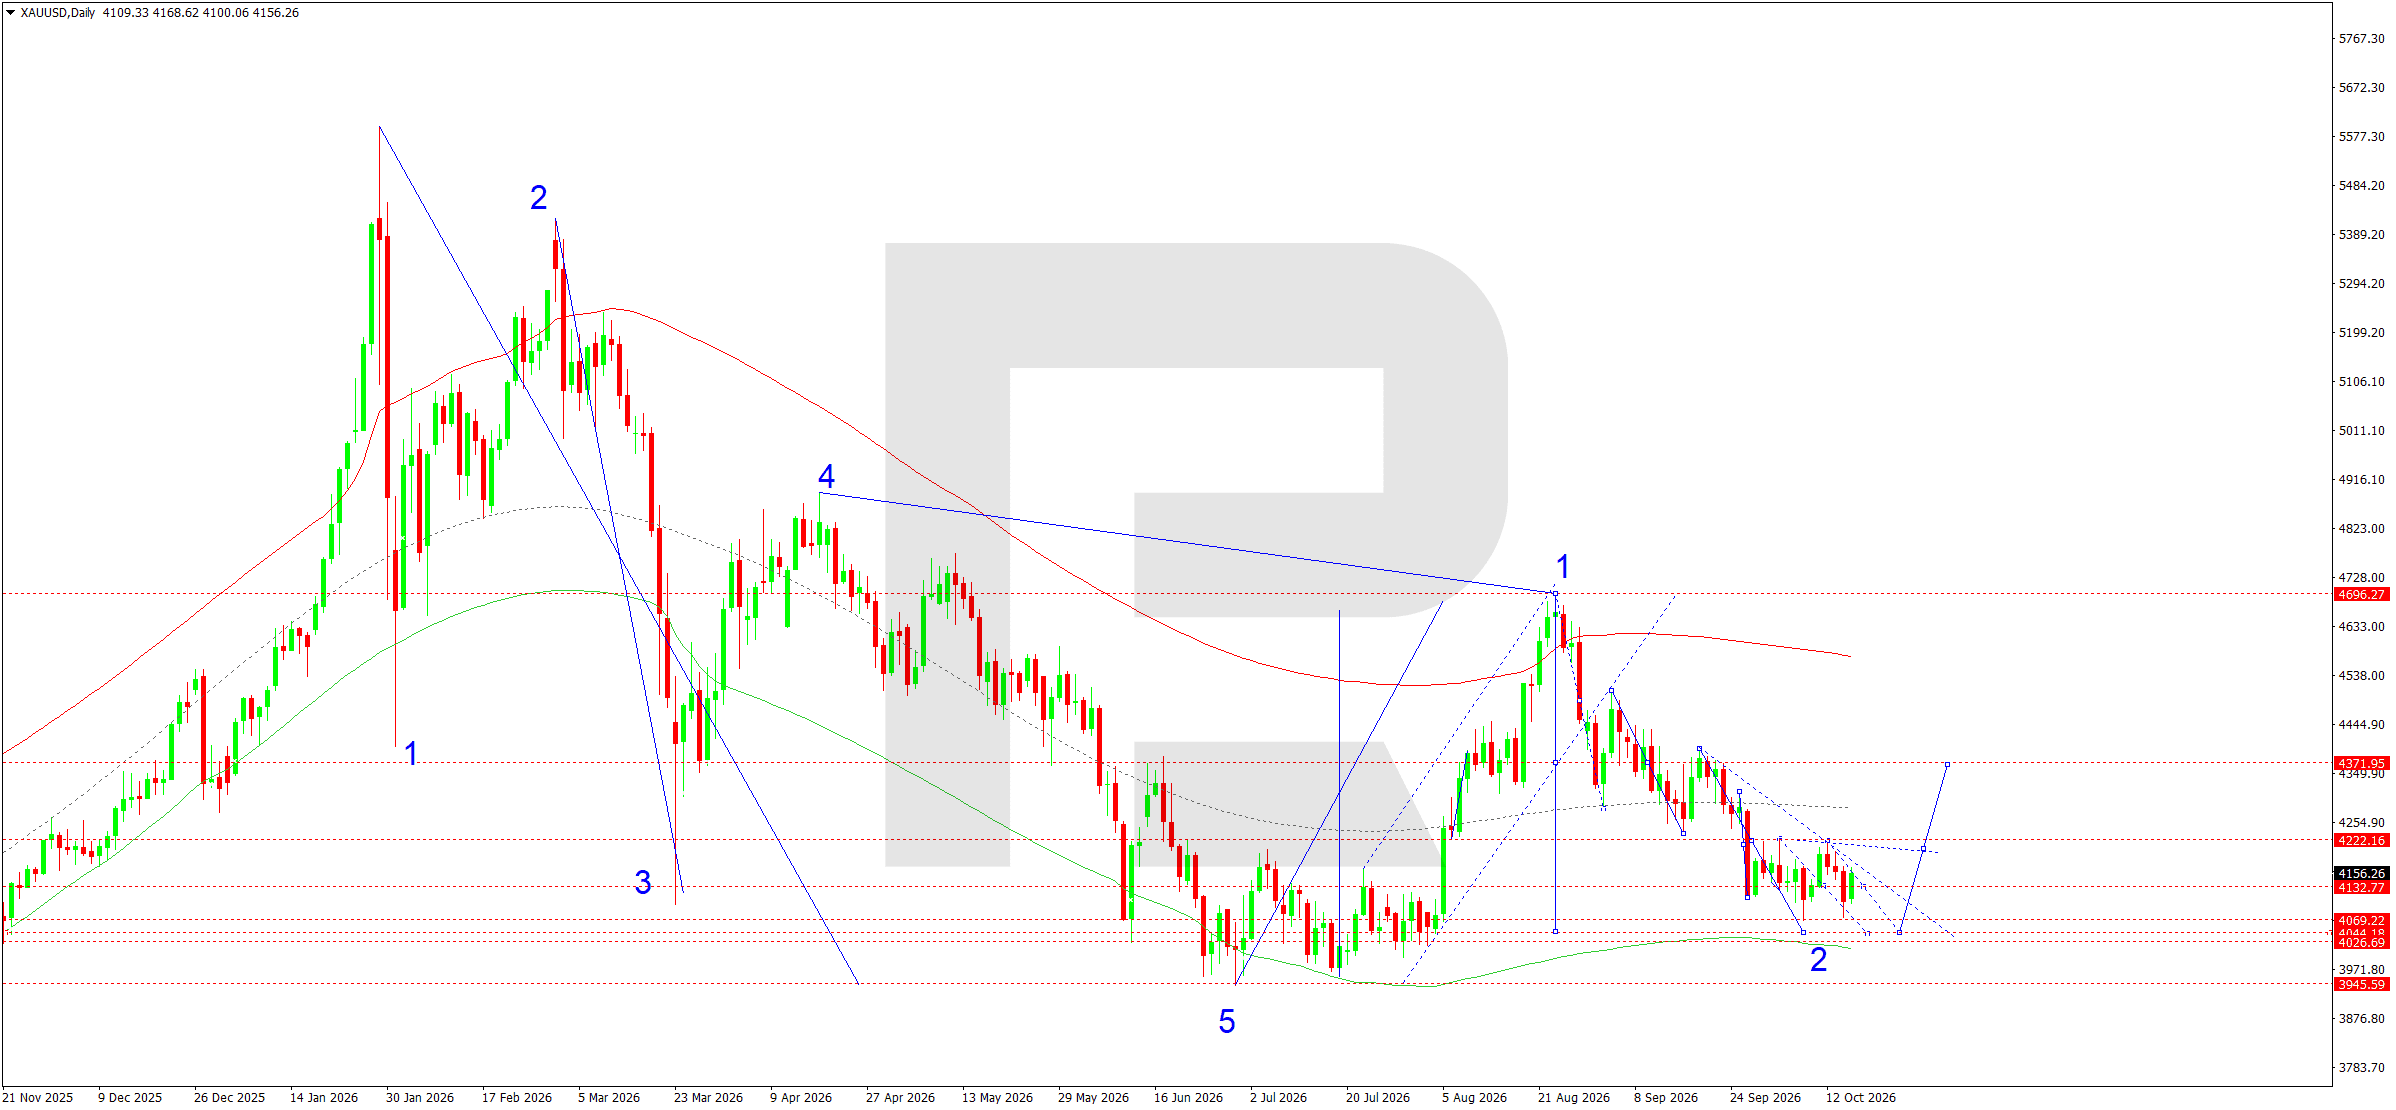
- Gold: Support: 4,069, 4,044. Resistance: 4,222, 4,372
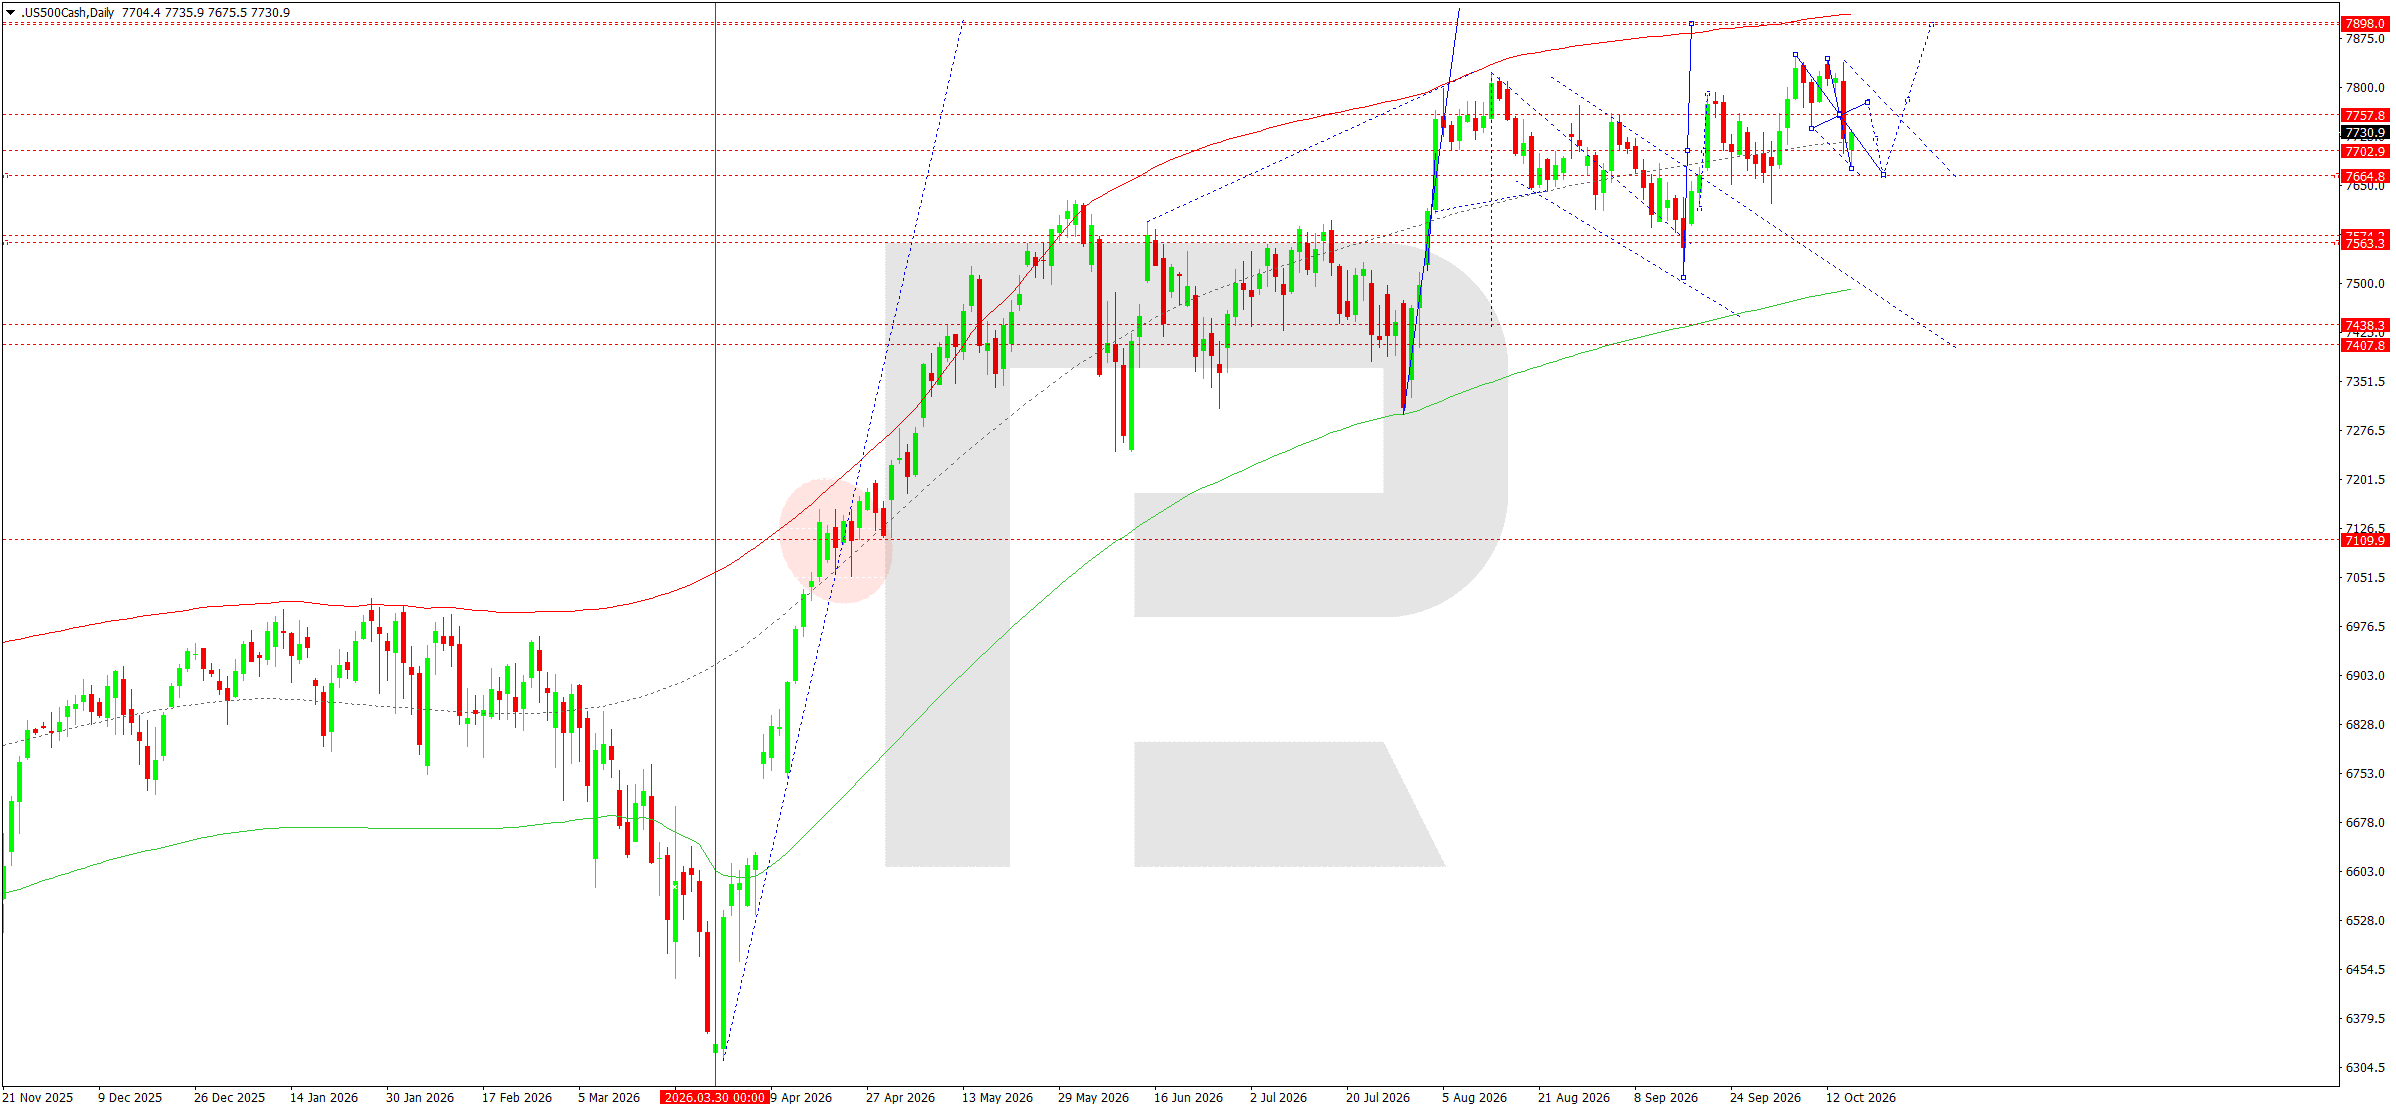
- US 500: Support: 7,665, 7,563. Resistance: 7,776, 7,898
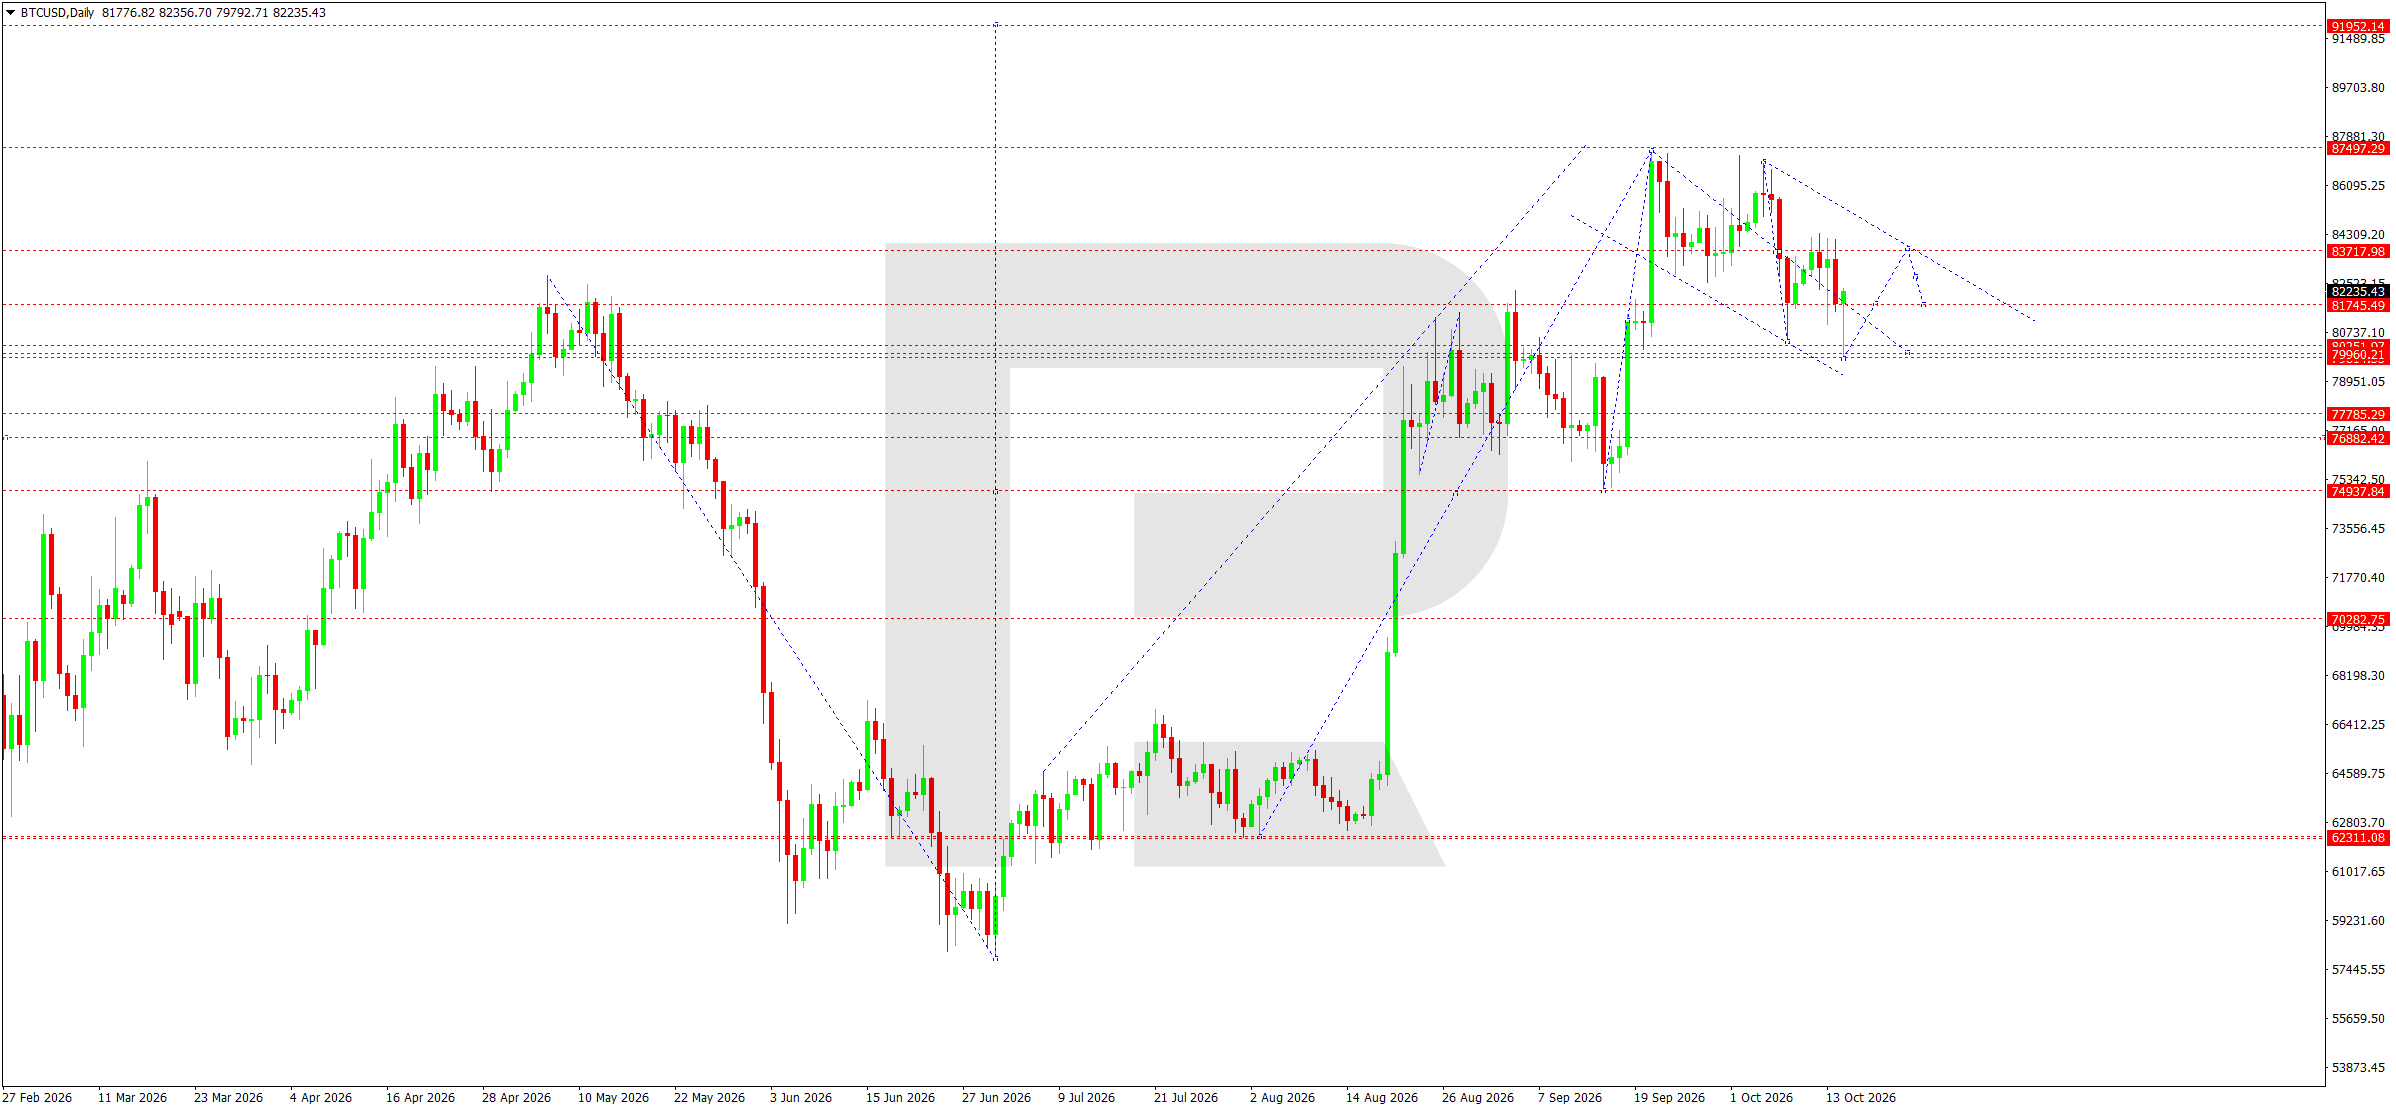
- BTCUSD: Support: 79,621, 77,785. Resistance: 82,606, 83,520.
EURUSD forecast
Over the coming trading week, EURUSD movements will be driven by expectations regarding the future monetary policies of the Federal Reserve and the European Central Bank. Market participants will focus primarily on the outlook for interest rate changes, the persistence of inflationary pressures and conditions in the largest economies.
For the US dollar, the most important factors remain US Treasury yields, labour market indicators and expectations regarding the Fed's future decisions. Persistently elevated yields on US assets could support the dollar and limit a recovery in the European currency.
In the eurozone, investors are assessing the prospects for economic growth, industrial activity and consumer demand. Energy prices and differences between the ECB's and Fed's monetary policy outlooks are also affecting the euro.
Continued investor caution towards risk assets could strengthen the dollar. Meanwhile, declining US Treasury yields would create conditions for a short-term EURUSD correction without necessarily changing the underlying downtrend.
EURUSD technical analysis
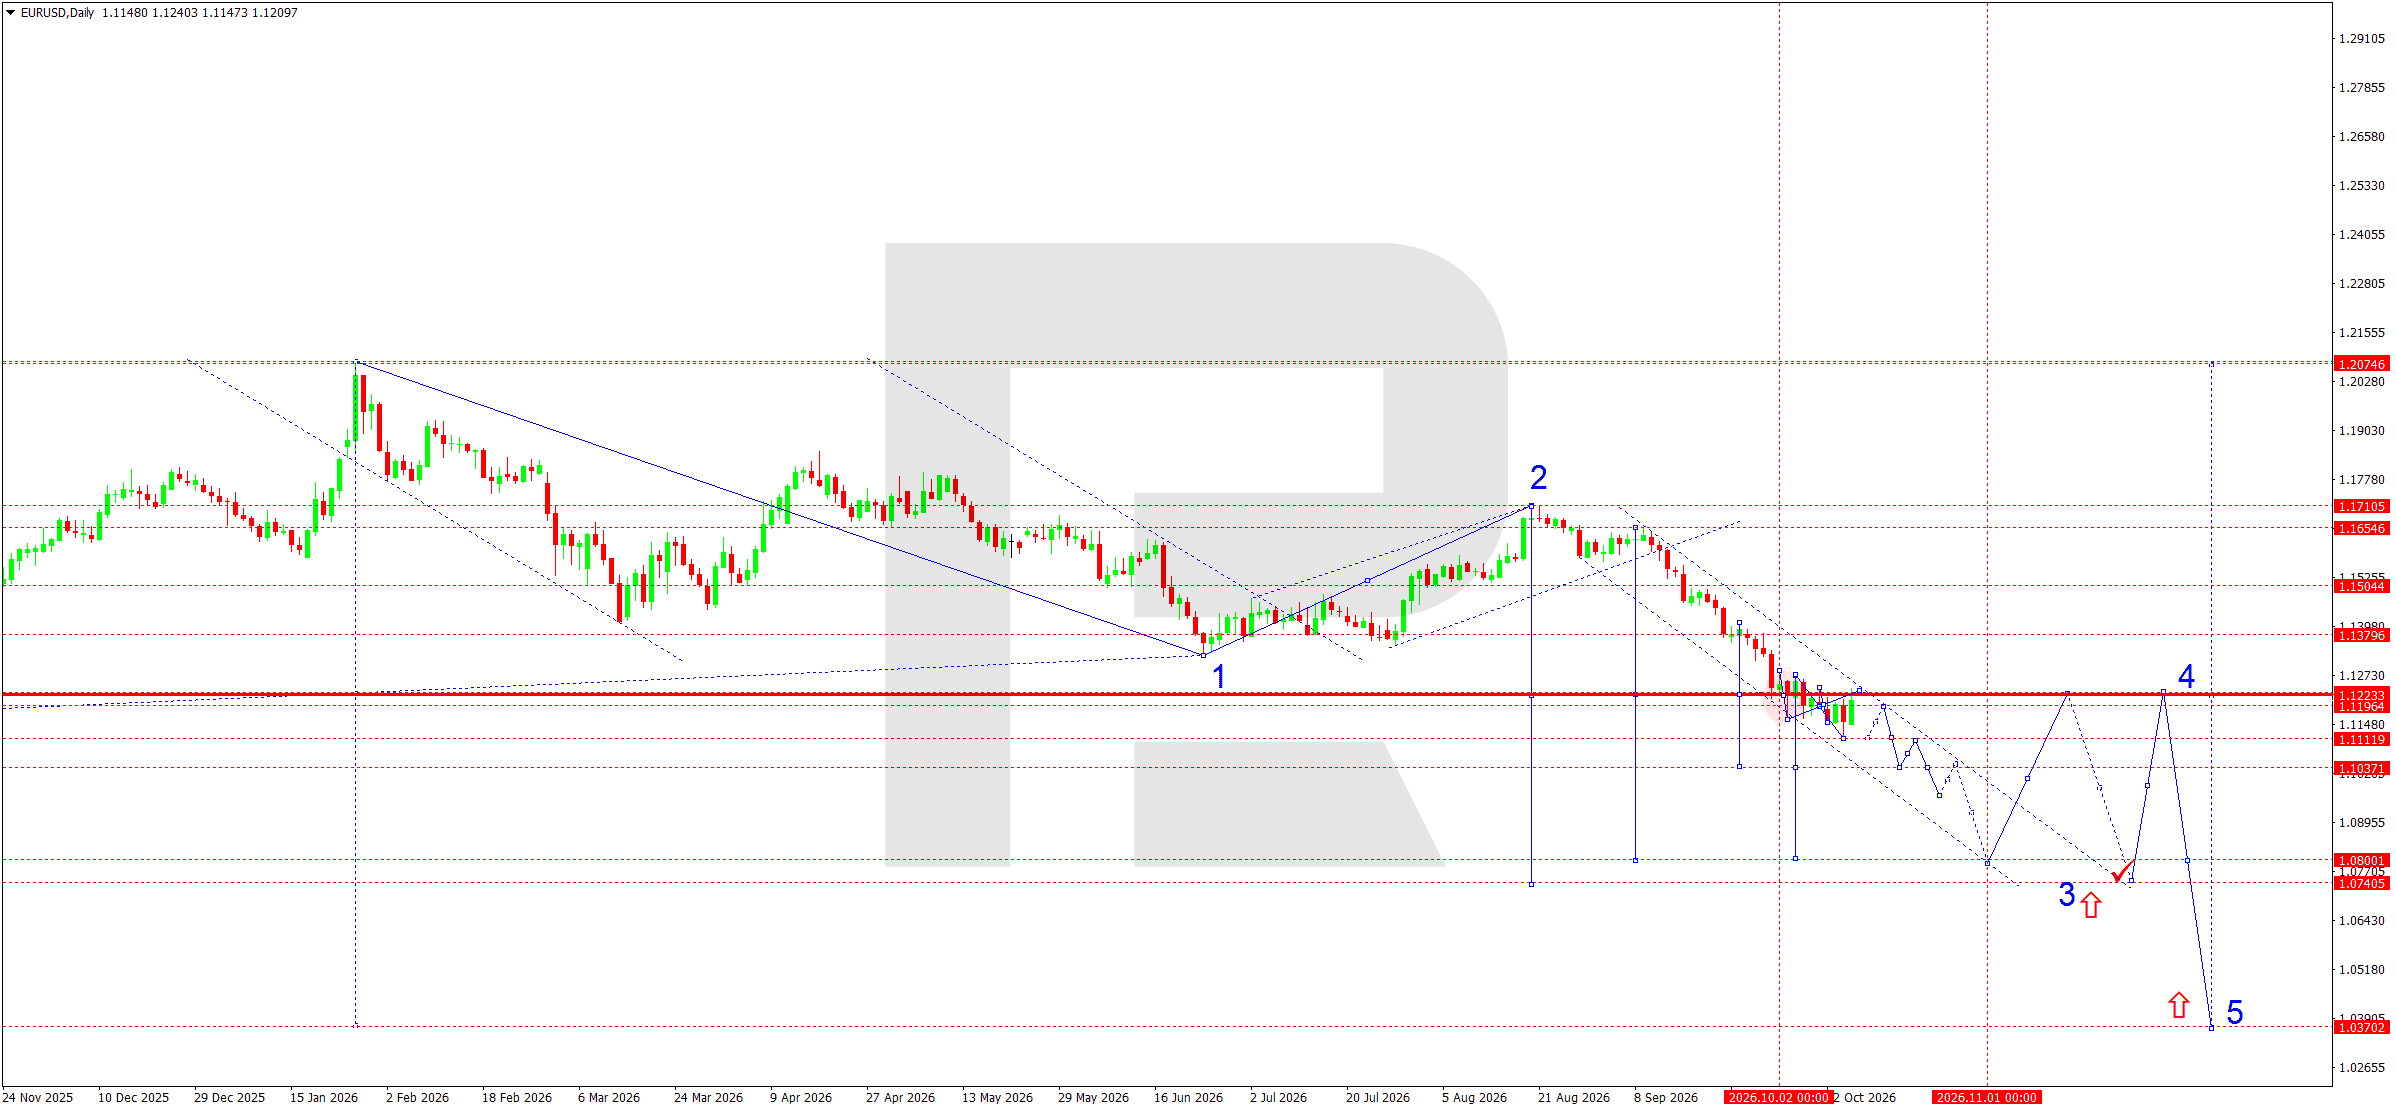
On the daily EURUSD chart, a sustained downtrend remains in place. Following the completion of the second corrective wave around 1.1711, the market formed a downward impulse towards 1.1112. During this move, a consolidation range developed around 1.1223, which serves as a key pivot point.
The current correction is viewed as a retest of 1.1223 from below. If this level holds as resistance, the third downward wave is expected to continue, initially towards 1.1037 and then 1.0800. The latter is the projected target of the current bearish impulse.
Subsequently, a fourth corrective wave could form, with a recovery towards 1.1223. Once it ends, the main scenario will remain the development of a fifth downward wave towards 1.0370. Interim consolidations are possible around 1.1037 and 1.0800.
EURUSD forecast scenario
Trading scenario: SELL
- Price at the time of writing: 1.1209
- Entry price: 1.1204
- Stop loss: 1.1254
- Take profit: 1.1037
- Risk-to-reward ratio: 1:3.34
The trade idea is valid until 8:00 AM on 24 October 2026 (server time, UTC+3).
USDJPY forecast
Over the coming trading week, USDJPY movements will be driven by expectations regarding the future monetary policies of the US Federal Reserve (Fed) and the Bank of Japan (BoJ). The key factor remains the interest rate differential between the two countries, which supports the appeal of dollar-denominated assets but also creates conditions for a correction if US Treasury yields decline.
Investors will pay particular attention to US macroeconomic data, especially inflation, employment and business activity indicators. Signs of resilience in the US economy could support the dollar, while weaker economic readings would reinforce expectations of Fed policy easing.
For the Japanese yen, the prospects for BoJ monetary policy normalisation, wage growth and domestic inflation remain significant. The possibility of currency intervention by the Japanese authorities in the event of excessive depreciation of the national currency is another factor.
Overall, the fundamental backdrop suggests that USDJPY volatility will remain elevated. The direction of movement will depend on changes in interest rate expectations and demand for safe-haven assets.
USDJPY technical analysis
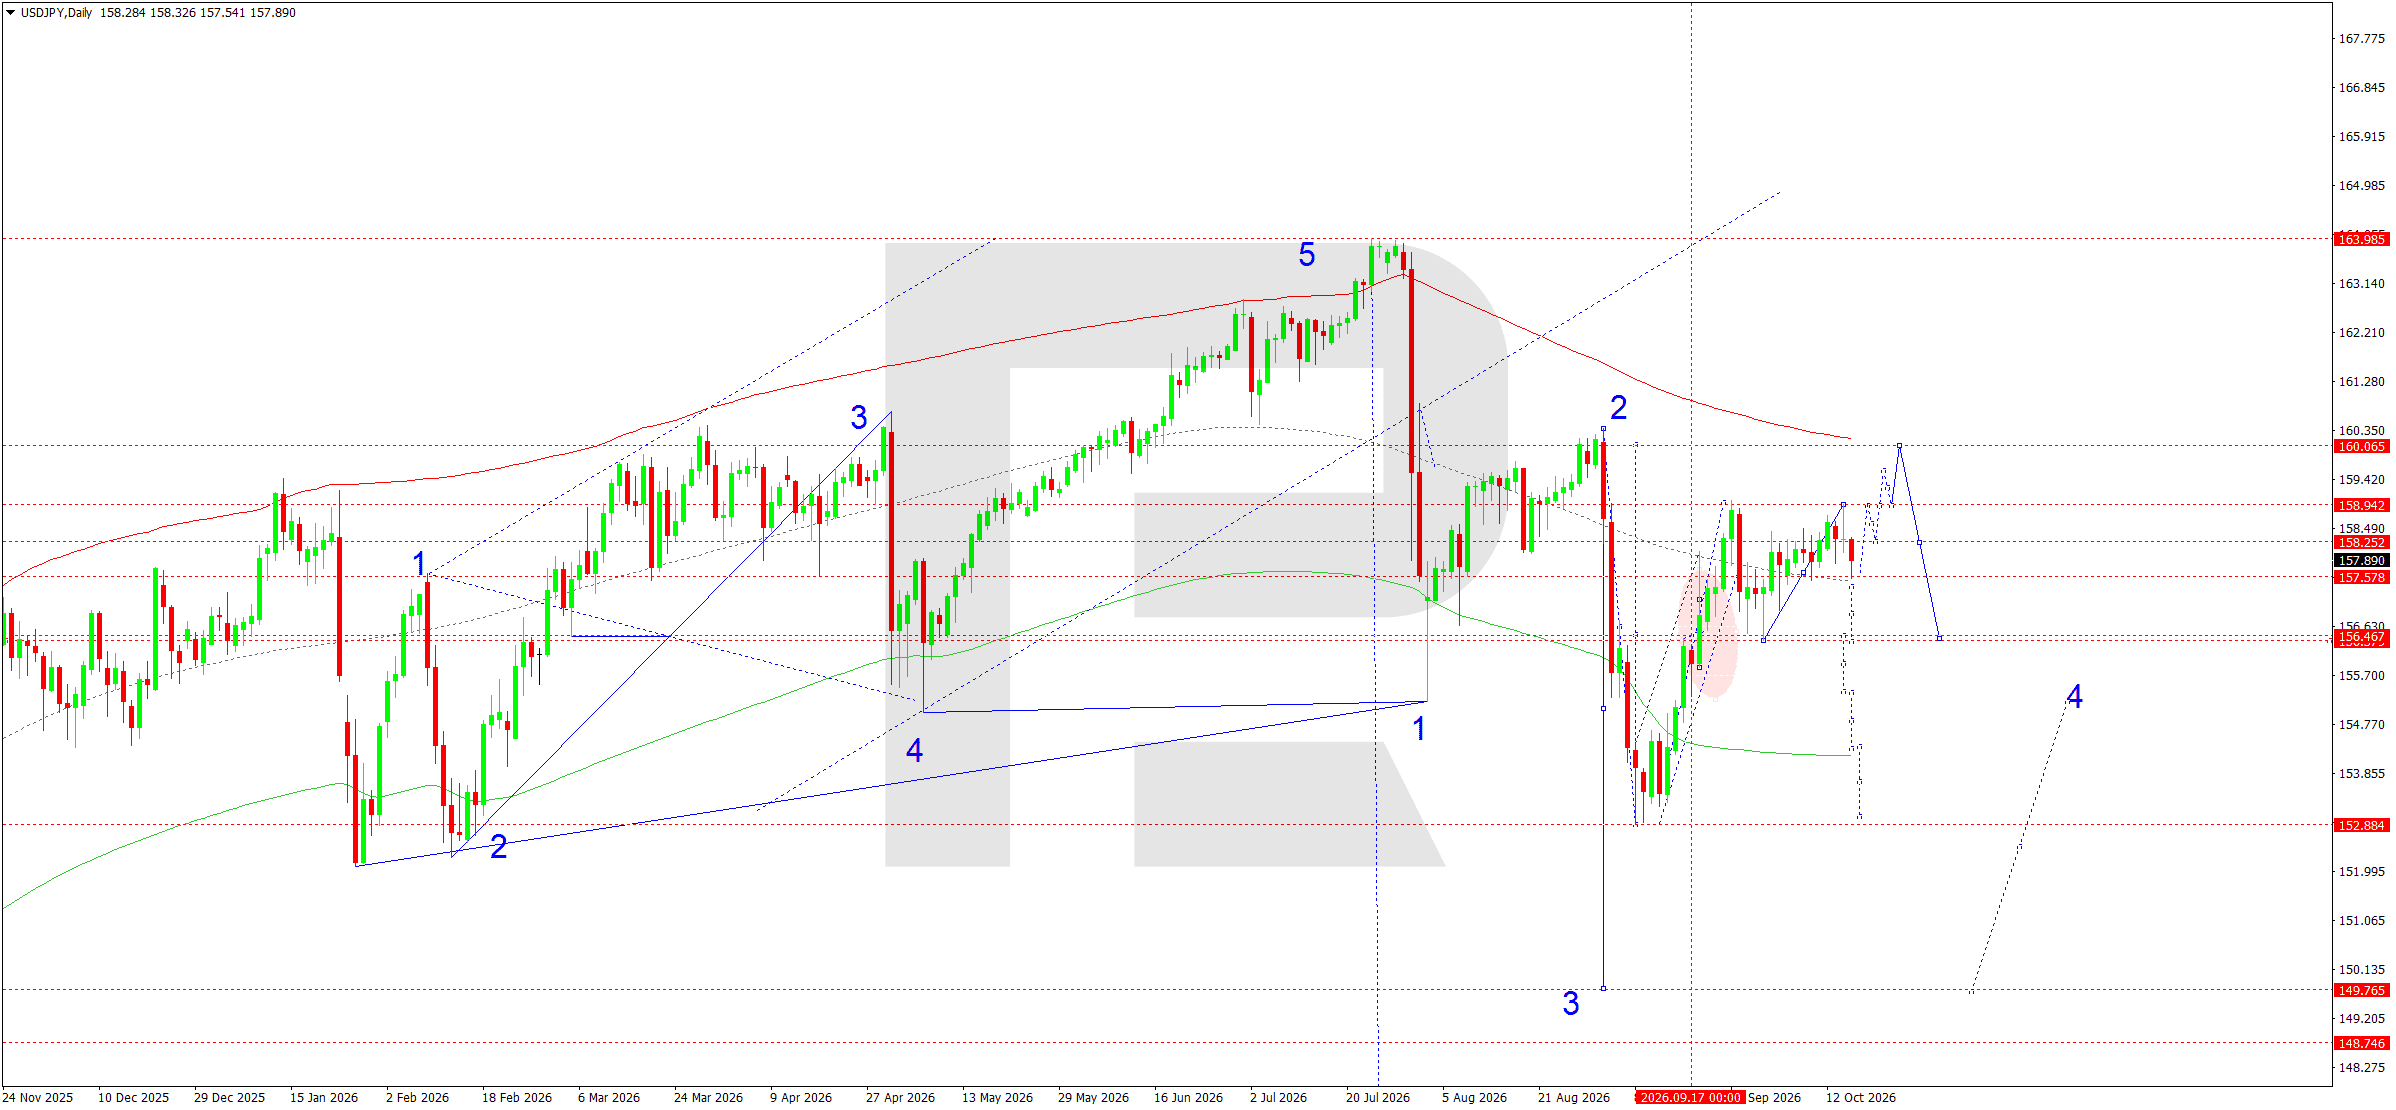
On the daily USDJPY chart, consolidation is forming around 157.57 following the completion of a downward impulse. The current structure allows for an upward correction within an Elliott Wave pattern. The nearest target for buyers is resistance at 158.94.
Once that level is reached, a local correction towards 158.25 is likely, where the resilience of demand is expected to be tested. A subsequent recovery would open the way towards 159.60 and the main resistance at 160.06, which coincides with the dynamic resistance area of the descending channel.
The main medium-term trend remains downward following the completion of the fifth wave near 163.98. The anticipated rise is therefore regarded primarily as corrective.
Failure to consolidate above 160.06 would create conditions for a renewed decline towards 156.47 and subsequently 152.88.
USDJPY forecast scenario
Trading scenario: BUY
- Price at the time of writing: 157.89
- Entry price: 157.94
- Stop loss: 157.40
- Take profit: 159.60
- Risk-to-reward ratio: 1:3.07
The trade idea is valid until 8:00 AM on 24 October 2026 (server time, UTC+3).
GBPUSD forecast
The British pound enters the new trading week under pressure from the US dollar. Market participants are primarily focused on the monetary policy outlooks of the Bank of England (BoE) and the US Federal Reserve (Fed). Differences in expectations regarding future interest rate changes remain an important factor shaping the medium-term GBPUSD trend.
For the British currency, inflation figures, wage growth, labour market conditions and the pace of economic expansion are decisive. Signs of weakening consumer activity could reinforce expectations of BoE easing, limiting a recovery in sterling. At the same time, persistent inflationary pressures may force the regulator to remain cautious.
The US dollar continues to be influenced by Fed rate expectations, US Treasury yields and overall investor risk sentiment. Relatively high yields on US assets support demand for the dollar. New macroeconomic releases and comments from central bank officials will remain key factors over the coming week.
According to data published on 15 October, the UK economy grew by 0.1% in August and by 0.7% over three months. Expectations of a BoE rate increase in November also strengthened. These developments support sterling, although persistent fiscal risks limit its potential to appreciate.
GBPUSD technical analysis
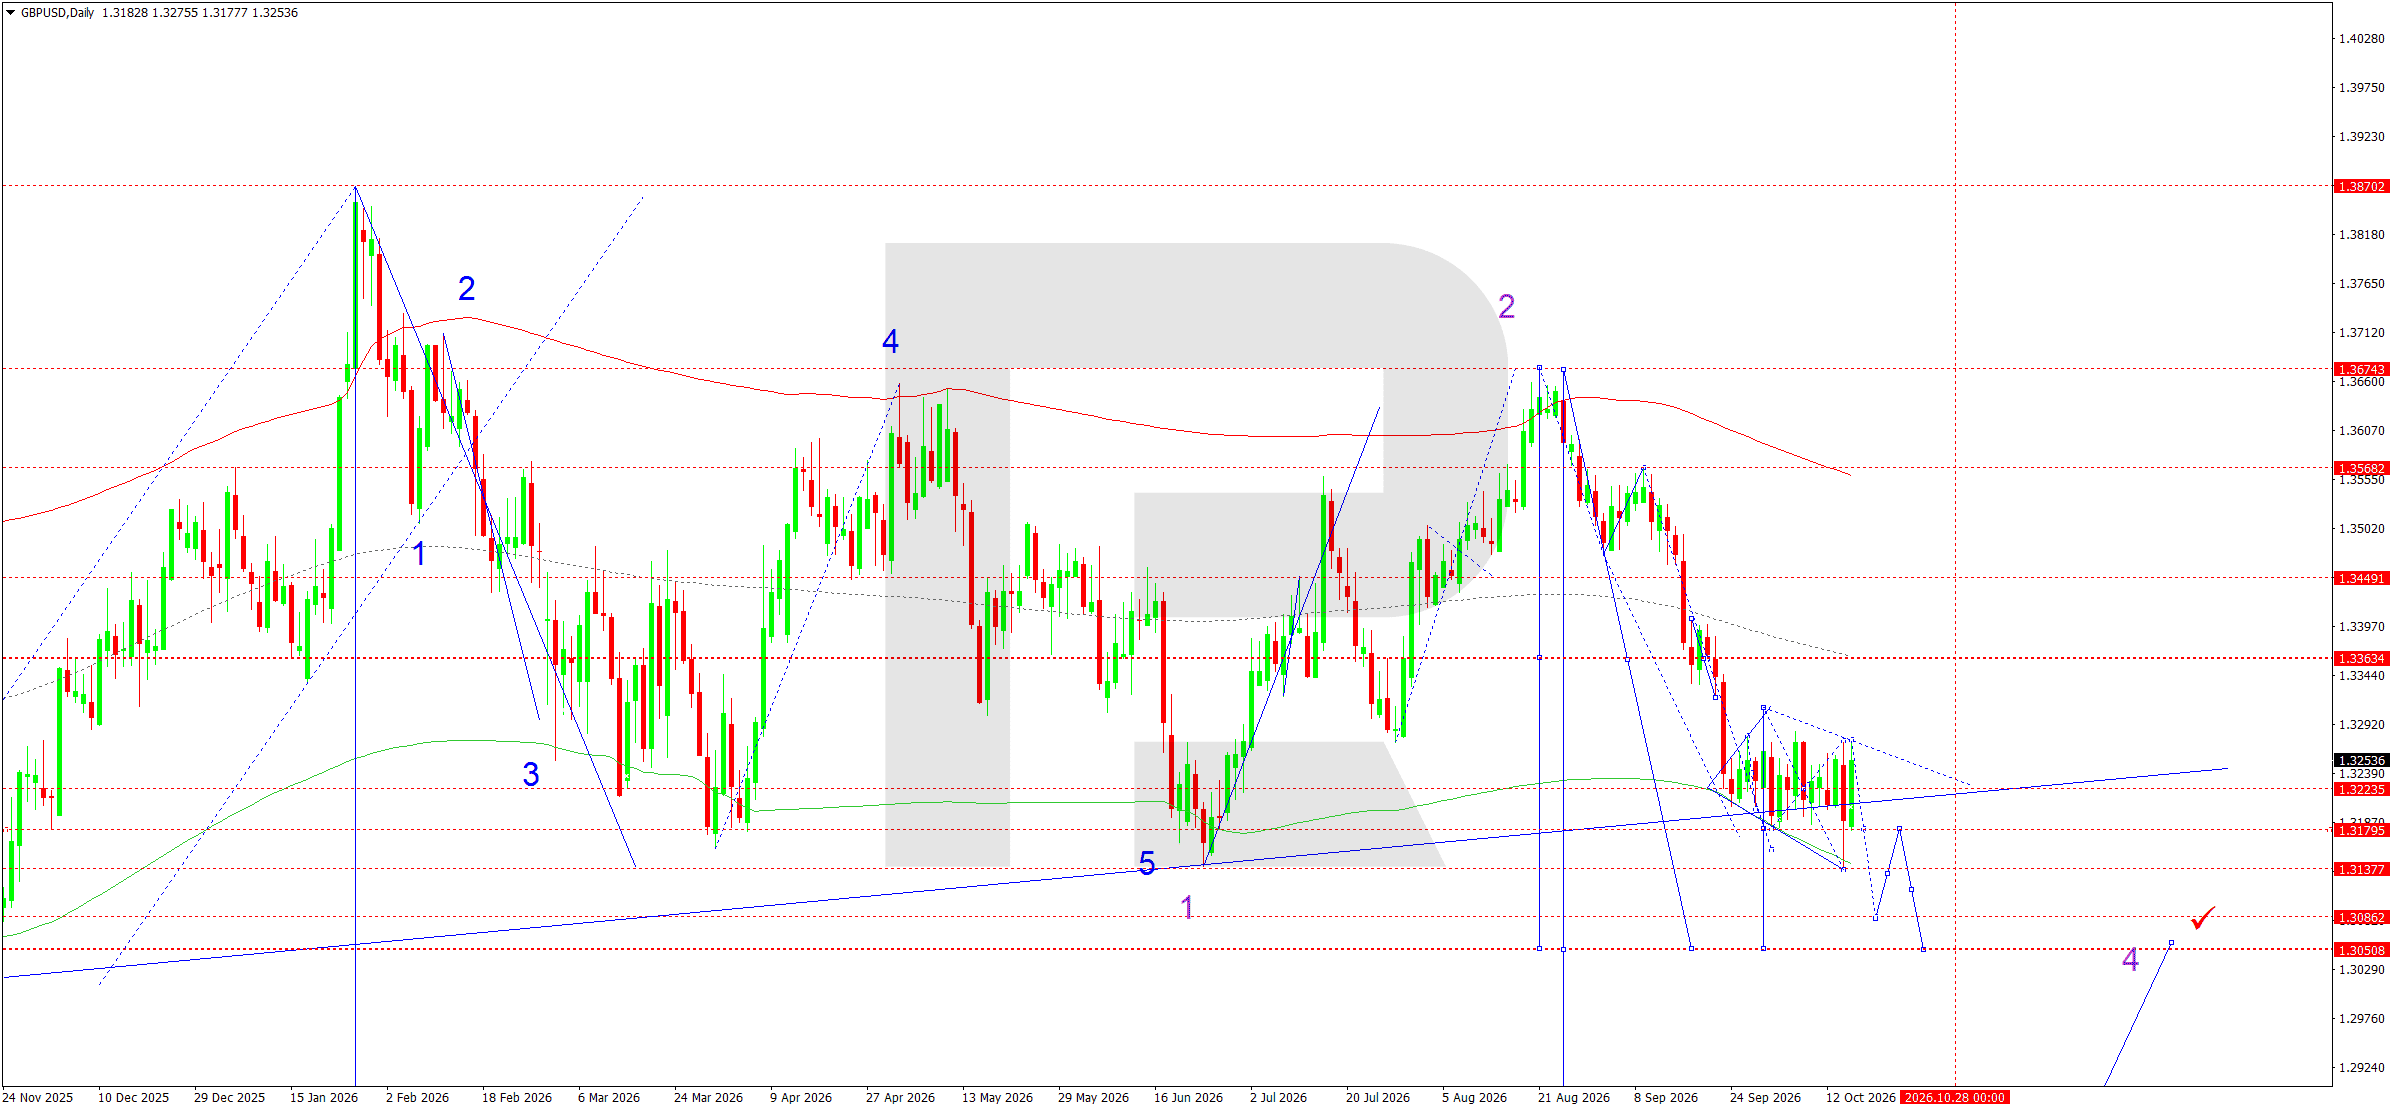
The daily GBPUSD chart retains a bearish structure following the formation of the second wave around 1.3674. The pair completed a downward impulse towards 1.3137 and then entered corrective consolidation below the pivot point at 1.3235.
The main scenario envisages a continued decline after a local correction towards 1.3275 is completed. The nearest target is 1.3086, followed by a test of 1.3050. Consolidation below this level would confirm the development of the third downward wave.
In the medium term, the move could extend towards 1.2430 and, if the bearish impulse remains strong, towards 1.2260. Invalidation of the negative scenario would require a sustained return above 1.3363.
GBPUSD forecast scenario
Trading scenario: SELL
- Price at the time of writing: 1.3254
- Entry price: 1.3249
- Stop loss: 1.3363
- Take profit: 1.3050
- Risk-to-reward ratio: 1:1.75
The trade idea is valid until 8:00 AM on 24 October 2026 (server time, UTC+3).
AUDUSD forecast
The Australian dollar ends the current week under pressure from weak labour market data, which has heightened doubts about further monetary tightening. Employment fell by 39,300 in September, while unemployment remained at 4.7%. These figures point to slowing economic activity and weakening domestic demand.
The Reserve Bank of Australia faces the challenge of balancing persistent inflation risks against deteriorating employment conditions. Following the data release, market participants substantially reduced expectations of another interest rate increase.
This limits the Australian currency's recovery potential.
The Federal Reserve's policy is another influence. The resilience of the US economy and inflationary pressures support the regulator's cautious stance.
At the same time, a weaker US dollar and a recovery in Chinese exports could temporarily support AUDUSD. However, uncertainty about global demand continues to favour sellers.
AUDUSD technical analysis
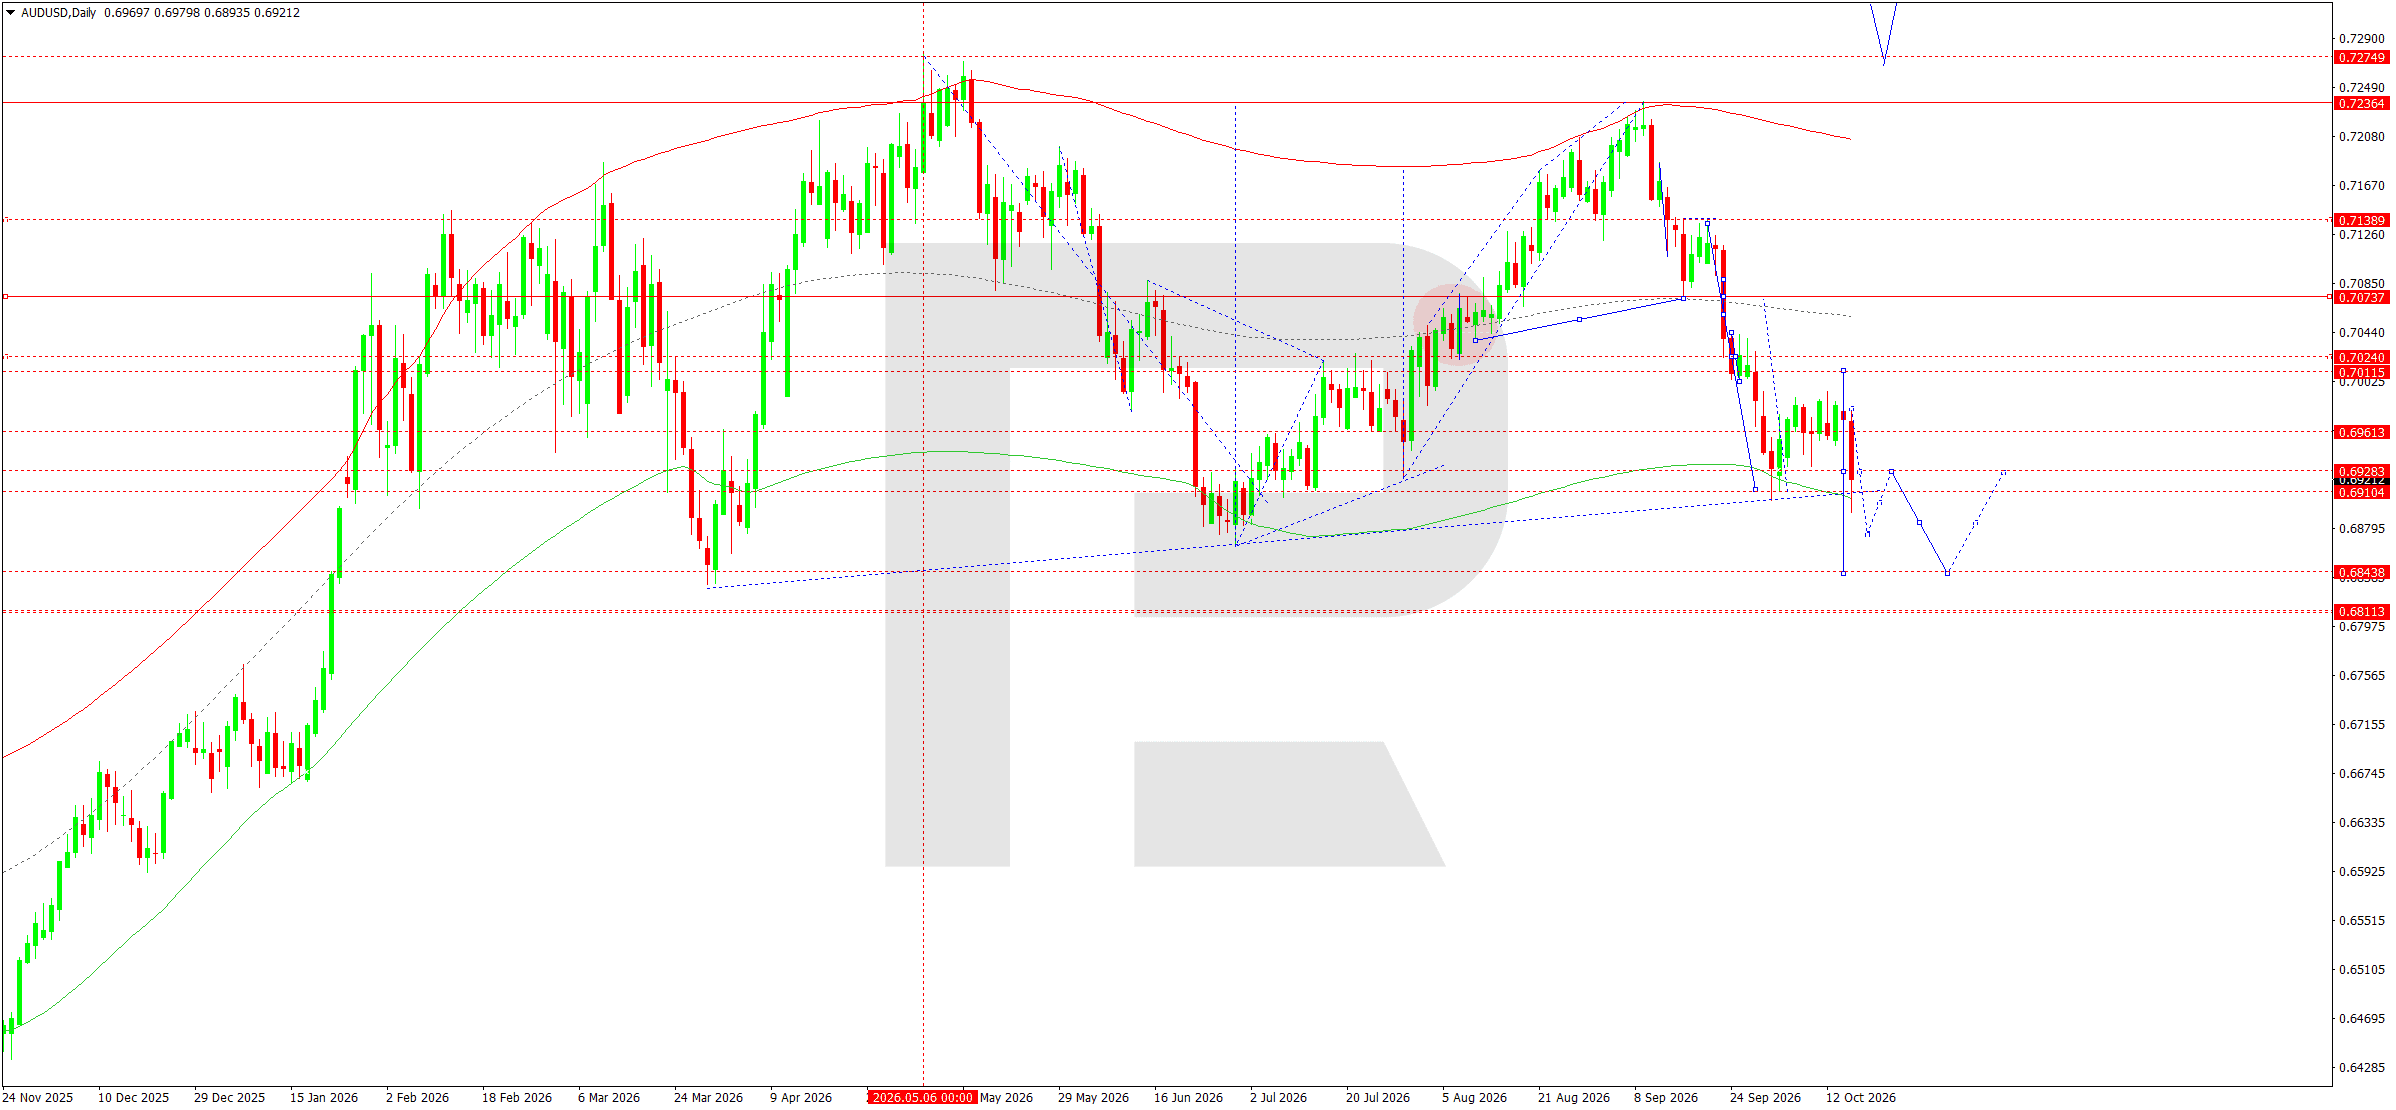
The daily AUDUSD chart maintains a downtrend following the completion of an upward wave structure around 0.7236. The subsequent decline produced a series of lower highs and broke through key support levels.
The pair reached the nearest target of the downward wave at 0.6893, followed by a technical correction towards 0.6918. The current structure allows the recovery to continue towards 0.6929, where selling resistance is expected to intensify.
The main scenario envisages the completion of the corrective wave and a renewed decline towards 0.6843. This level coincides with an important support area and a potential endpoint for the next downward impulse.
Once that target is reached, an upward corrective wave is expected to develop, potentially bringing prices back towards 0.6930. Consolidation above this level would make a more prolonged recovery possible.
As long as the price remains below 0.6961, the bearish scenario takes priority. A break below 0.6843 would open the way to a further decline towards 0.6811.
AUDUSD forecast scenario
Trading scenario: SELL
- Price at the time of writing: 0.6921
- Entry price: 0.6916
- Stop loss: 0.6970
- Take profit: 0.6843
- Risk-to-reward ratio: 1:1.35
The trade idea is valid until 8:00 AM on 24 October 2026 (server time, UTC+3).
USDCAD forecast
Over the coming week, USDCAD movements will be driven by diverging monetary policy expectations in the US and Canada, conditions in the oil market and changes in demand for the US currency. Despite persistent inflation risks, the US dollar is ending the current week under pressure as expectations of imminent Federal Reserve tightening have diminished.
US inflation figures for September exceeded forecasts, but cautious comments from Fed officials limited the rise in government bond yields. Concerns about the sustainability of investment in the technology sector added to uncertainty.
The Canadian dollar continues to face pressure from weak domestic data. The labour market lost 68,300 jobs in September, while unemployment rose to 6.5%. These results reduced expectations of a Bank of Canada rate increase. Meanwhile, fluctuations in oil prices pose additional risks to the Canadian currency.
The fundamental backdrop therefore remains mixed. However, US dollar weakness creates conditions for a corrective decline in USDCAD.
USDCAD technical analysis
On the daily USDCAD chart, the medium-term bullish structure remains intact following the formation of the fourth Elliott wave. The subsequent impulsive movement ended at resistance at 1.4297, corresponding to the upper boundary of the price channel.
The preferred scenario for the coming week is the development of a corrective wave towards 1.4153. Local consolidation may form near this level, with a possible recovery in prices towards 1.4198.
A retest of resistance could end with the formation of another downward leg targeting 1.4095. If selling pressure intensifies, support at 1.3993 will become the next area of interest.
The price remaining below 1.4226 confirms that the corrective scenario is still relevant. Conversely, consolidation above 1.4297 would restore the possibility of a continuation of the fifth upward wave towards 1.4319.
The main medium-term trend remains bullish, but the short-term forecast envisages sellers prevailing and a gradual correction within the existing market structure.
USDCAD forecast scenario
Trading scenario: SELL
- Price at the time of writing: 1.4195
- Entry price: 1.4190
- Stop loss: 1.4300
- Take profit: 1.4095
- Risk-to-reward ratio: 1:0.86
The trade idea is valid until 8:00 AM on 24 October 2026 (server time, UTC+3).
XAUUSD forecast
Over the coming week, gold movements will be driven by expectations regarding the Federal Reserve's monetary policy, changes in US Treasury yields and fluctuations in the dollar. Published US consumer and producer inflation data exceeded forecasts, heightening concerns that interest rates could remain elevated.
However, falling Treasury yields and a weaker US currency allowed gold to recover after dropping towards 4,074. Market participants continue to assess the possibility of further Fed tightening, taking persistent inflationary pressures and risks of slowing economic growth into account.
Geopolitical tensions in the Middle East and instability in equity markets are providing additional support for the precious metal. At the same time, high yields on debt instruments limit gold's investment appeal. Therefore, the short-term recovery does not yet indicate that the downtrend has ended.
XAUUSD technical analysis
The daily XAUUSD chart retains a bearish structure following the formation of corrective wave 1 around 4,696. The subsequent decline formed a presumed wave 2, during which the price reached the 4,069–4,044 area.
An upward impulse from this support reached 4,168. However, buyers have so far failed to consolidate above the nearest resistance at 4,222. Local consolidation has been forming around 4,132 during the week, reflecting a temporary balance between buyers and sellers.
The main scenario envisages an end to the corrective recovery and a continuation of the downward wave. The initial target is a retest of 4,069, followed by a likely move towards 4,044 and 4,027. A break below the latter would create conditions for a decline towards 3,946.
The alternative scenario envisages consolidation above 4,222, opening the possibility of a recovery towards 4,372. As long as the price remains below the indicated resistance, sellers retain the advantage. A breakout from consolidation followed by a sustained move below 4,132 would confirm the bearish scenario.
XAUUSD forecast scenario
Trading scenario: SELL
- Price at the time of writing: 4,156
- Entry price: 4,151
- Stop loss: 4,222
- Take profit: 4,044
- Risk-to-reward ratio: 1:1.51
The trade idea is valid until 8:00 AM on 24 October 2026 (server time, UTC+3).
US 500 forecast
The US stock market is ending the trading week amid heightened sensitivity to expectations regarding future monetary policy. Investors are primarily focused on the outlook for Fed interest rate changes, inflation trends and the resilience of economic growth. For the US 500 index, the balance between government bond yields and the attractiveness of corporate equities remains a decisive factor.
The US corporate quarterly earnings season is another influence. Investors are assessing the technology sector's earnings prospects, the resilience of consumer demand and trends in corporate spending. Strong financial results could support the uptrend, while cautious corporate guidance could intensify profit-taking.
Over the coming week, changes in US Treasury yields, dollar movements and overall risk appetite will remain important factors. Continued expectations of Fed easing create conditions for a recovery in equity indices. However, uncertainty surrounding inflation limits the potential for sustained growth and increases the likelihood of short-term corrections.
US 500 technical analysis
The daily US 500 chart retains a medium-term uptrend, although the market entered a corrective phase after forming a local high. The price declined towards 7,676, followed by a recovery impulse towards 7,760.
The current structure points to the formation of a consolidation range within a broader bullish pattern.
Within the Elliott Wave structure, the possibility of a local correction ending and a subsequent upward wave developing is being considered.
However, the nearest-term scenario remains a retest of the 7,670 area. Holding this support would allow a recovery towards 7,776 and a further move towards 7,898.
A break below support at 7,665 would intensify corrective pressure and open the way for a decline towards 7,563. The main scenario envisages an initial decline followed by a resumption of upward movement.
US 500 forecast scenario
Trading scenario: SELL
- Price at the time of writing: 7,731
- Entry price: 7,726
- Stop loss: 7,790
- Take profit: 7,670
- Risk-to-reward ratio: 1:0.88
The trade idea is valid until 8:00 AM on 24 October 2026 (server time, UTC+3).
BTCUSD forecast
Over the coming week, bitcoin movements will be driven by changes in global risk appetite, expectations regarding US monetary policy and institutional investor activity. Following September's gains, the cryptocurrency market entered a correction, although the medium-term structure still offers scope for a recovery.
Market participants are mainly focused on the outlook for decisions by the Federal Reserve. Expectations of monetary easing could support demand for risk assets, while rising US Treasury yields and a stronger dollar would put additional pressure on bitcoin.
Capital flows into US spot bitcoin ETFs remain an important factor. Sustained inflows could support prices, while outflows increase the likelihood of a continued correction. Conditions in the US stock market, geopolitical uncertainty and changing liquidity also have an impact.
The fundamental backdrop suggests that volatility will remain elevated over the coming week. In the absence of a significant deterioration in market sentiment, the corrective decline could lay the groundwork for another upward impulse.
BTCUSD technical analysis
On the daily BTCUSD chart, a corrective structure is developing after the completion of an upward impulse around 87,497. The market formed a downward wave towards the 79,860 area before recovering to 82,356.
The current price is 82,235. The main medium-term trend remains bullish, although selling pressure persists locally.
Over the coming week, consolidation is expected to form below resistance at 82,606. If the price fails to consolidate above this level, another downward leg towards 79,621 is likely. This area represents the nearest target of the corrective move and a potential zone for renewed buying activity.
After a test of support at 79,621, prices could recover towards 83,520. A break above this resistance would open the way for the upward wave to continue towards 88,065. The alternative scenario envisages a deeper correction towards 77,785 if the price consolidates below 79,621.
BTCUSD forecast scenario
Trading scenario: SELL
- Price at the time of writing: 82,235
- Entry price: 82,230
- Stop loss: 83,520
- Take profit: 79,621
- Risk-to-reward ratio: 1:2.02
The trade idea is valid until 8:00 AM on 24 October 2026 (server time, UTC+3).
Editors’ picks
 EURUSD forecast 2026–2027: technical analysis, price levels & predictions
The EURUSD outlook for 2026 and 2027: key levels on the daily chart, three trading scenarios and the policy gap between the Fed and the ECB that drives the pair.
 Gold (XAUUSD) forecast 2026: technical analysis, price levels & predictions
Where gold could trade in 2026: key levels, three trading scenarios with entry triggers and the forecasts from J.P. Morgan, Deutsche Bank and Goldman Sachs.
Forecasts presented in this section only reflect the author’s private opinion and should not be considered as guidance for trading. RoboForex bears no responsibility for trading results based on trading recommendations described in these analytical reviews.