
Weekly Forex forecast for 2–6 November 2026: key levels for currencies, gold, US 500, and Bitcoin
The weekly forecast for 2–6 November 2026 includes four sell scenarios and four buy scenarios for eight instruments.
Table of Contents (H2)
Key levels for the week
| Instrument | Week | Support | Resistance | Scenario |
|---|---|---|---|---|
| EURUSD | −1.62% | 1.1048 | 1.1223 | Sell from 1.1134 |
| USDJPY | +1.28% | 157.44 | 158.96 | Buy from 158.10 |
| GBPUSD | −1.91% | 1.3140 | 1.3369 | Sell from 1.3313 |
| AUDUSD | −2.60% | 0.6939 | 0.7067 | Sell from 0.7023 |
| USDCAD | +2.37% | 1.3898 | 1.4184 | Buy from 1.3986 |
| XAUUSD | −3.30% | 3,931 | 4,145 | Sell from 4,024 |
| US 500 | +2.36% | 7,663 | 7,809 | Buy from 7,724 |
| BTCUSD | +7.93% | 76,400 | 83,559 | Buy from 77,424 |
What moves markets this week
In the coming week, investors will focus on the outlook for the US Federal Reserve's monetary policy, US dollar movements, and the release of key economic indicators. Business activity data, the state of the US labour market, and changes in inflation expectations will be particularly important. Decisions and statements by major central banks, including the Bank of England and the Reserve Bank of Australia, will also affect currency markets. US Treasury yields, corporate earnings, geopolitical tensions, and fluctuations in oil prices will determine the direction of gold, the US 500 equity index, and Bitcoin. The coming week could bring heightened volatility and the formation of new medium-term price benchmarks.
The week's main events are the Reserve Bank of Australia's decision and the US congressional elections on 3 November, the ISM indices, the Bank of England meeting on 5 November, and the publication of US and Canadian employment data on 6 November.
Events that can move markets this week
| Day | Event | Why it matters |
|---|---|---|
| Monday, 2 November 2026 | US ISM manufacturing PMI | This will indicate the state of the US manufacturing sector. Important for the USD, gold, and US 500. |
| Tuesday, 3 November 2026 | US JOLTS job openings | These will reflect demand for labour and influence expectations of further Fed policy. Important for the USD, XAUUSD, and US 500. |
| Wednesday, 4 November 2026 | ADP employment report and US ISM services PMI | These will help assess the labour market and the largest sector of the US economy. Volatility is possible in the USD, gold, equity indices, and BTCUSD. |
| Thursday, 5 November 2026 | Bank of England interest rate decision and Monetary Policy Report | Key events for GBPUSD. The decision and inflation forecasts could change expectations for sterling. |
| Friday, 6 November 2026 | US labour market: Nonfarm Payrolls (NFP) and unemployment rate | The week's key statistical release. Sharp movements are possible in the USD, EURUSD, USDJPY, XAUUSD, US 500, and BTCUSD. |
EURUSD forecast
EURUSD fundamental analysis
Over the coming week, EURUSD movements will be determined by the balance of expectations concerning monetary policy in the US and eurozone. Market participants will focus on the outlook for interest rates, inflation figures, the state of the US labour market, and changes in US Treasury yields. Relatively high yields on dollar-denominated assets could support the US currency and limit the euro's recovery.
The Federal Reserve remains a key source of expectations regarding the future cost of dollar funding. Signals about how long restrictive monetary policy will remain in place are particularly important to the market. The European Central Bank, meanwhile, must balance inflation risks against the eurozone's economic growth prospects. Weakness in manufacturing and consumer demand could undermine the appeal of the European currency.
Business activity indicators, employment figures, and changes in global risk appetite will also have an impact. Unless the European macroeconomic picture improves sustainably, the dollar could retain the advantage.
EURUSD technical analysis
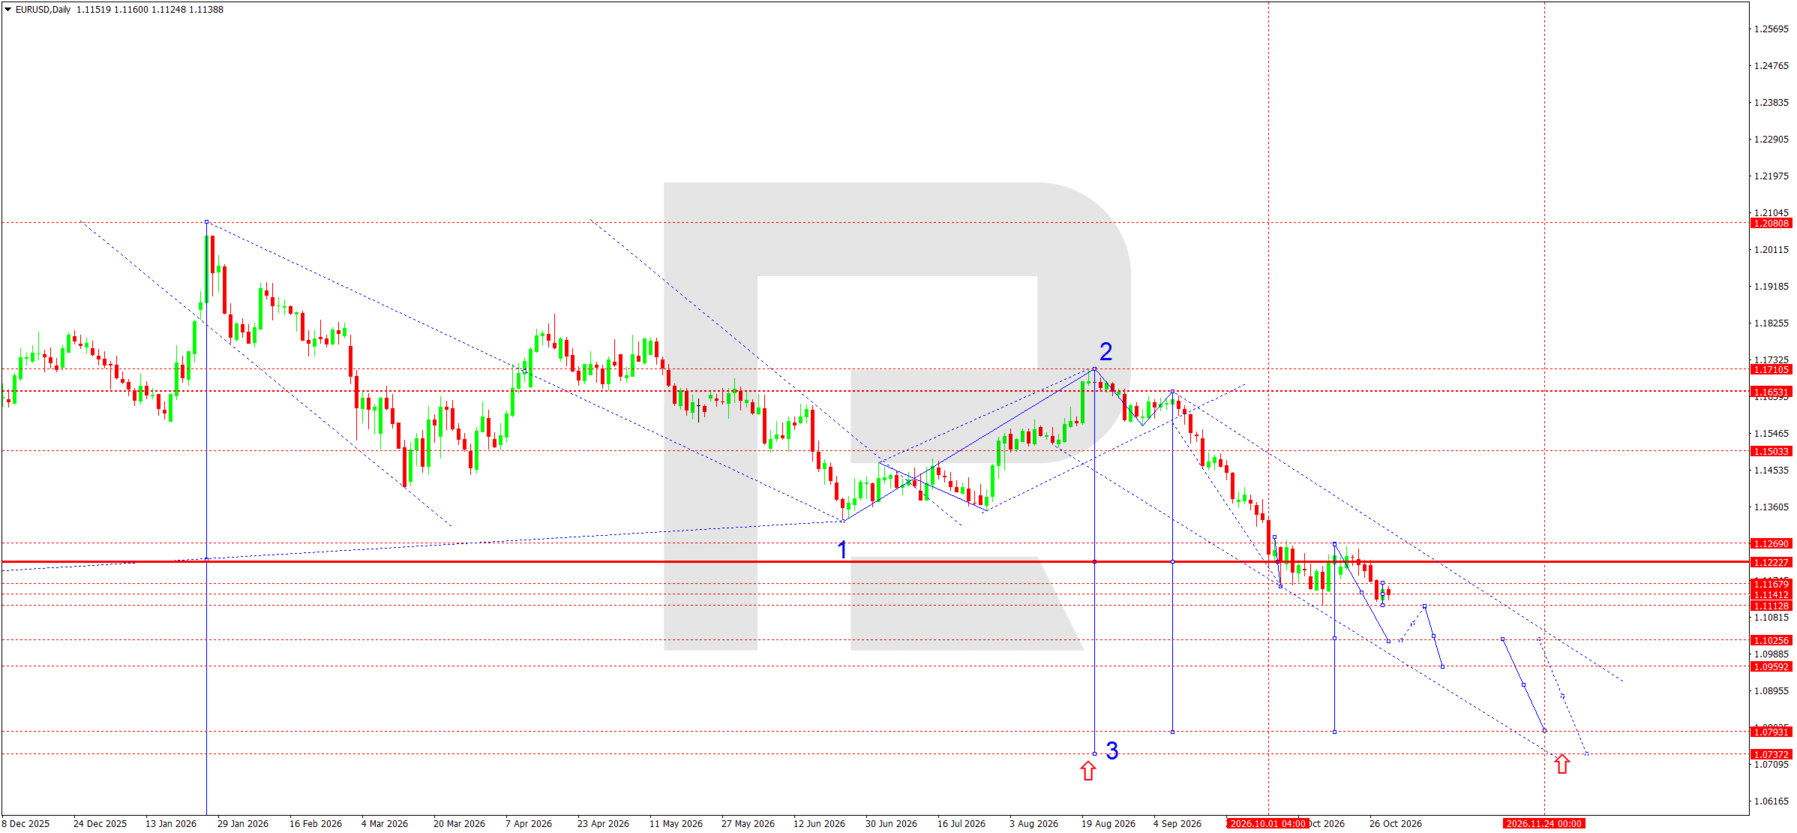
The daily EURUSD chart shows a sustained downtrend formed after the completion of the second corrective wave around 1.1710. The subsequent decline developed within a descending channel, with successive new local lows. The break below support at 1.1223 confirmed mounting selling pressure and the market's transition into the third downward wave.
The price is currently consolidating near 1.1139, forming a narrow range between 1.1113 and 1.1168. The nearest resistance is at 1.1168, with a more significant level at 1.1223. As long as prices remain below these levels, sellers retain the advantage.
The main scenario envisages the completion of the current consolidation and a further decline towards the intermediate level of 1.1026. A subsequent break below this level would open the way towards 1.0959. The calculated target for the third wave is the 1.0793–1.0737 area. Corrective rebounds are regarded as temporary movements within the prevailing downtrend.
EURUSD trade scenario
The main scenario suggests further declines with limited upward corrections. Consolidation above 1.1270 would temporarily ease selling pressure but would not change the overall bearish structure. If the third wave develops, the next potential target will be the 1.0370 area. Selling remains the priority once a breakout from the current range is confirmed.
USDJPY forecast
USDJPY fundamental analysis
Over the coming week, USDJPY movements will be determined by the divergence between US and Japanese monetary policies, changes in US Treasury yields, and the release of labour market statistics. On 28 October, the Federal Reserve kept its interest rate in the 3.75–4.00% range, citing economic resilience and elevated inflation. This stance limits the scope for US dollar weakness.
On 30 October, the Bank of Japan kept its interest rate at 1.25%, while raising its inflation forecast and reaffirming its readiness to continue tightening monetary policy. This strengthens fundamental support for the yen, although the substantial interest rate differential continues to make dollar-denominated assets attractive.
The week's main events will be the US ISM manufacturing and services indices, ADP employment data, and Friday's October Nonfarm Payrolls report. Weak data could accelerate a decline in USDJPY. Additional factors include geopolitical risks, demand for safe-haven assets, and the possibility of currency intervention by the Japanese authorities.
USDJPY technical analysis
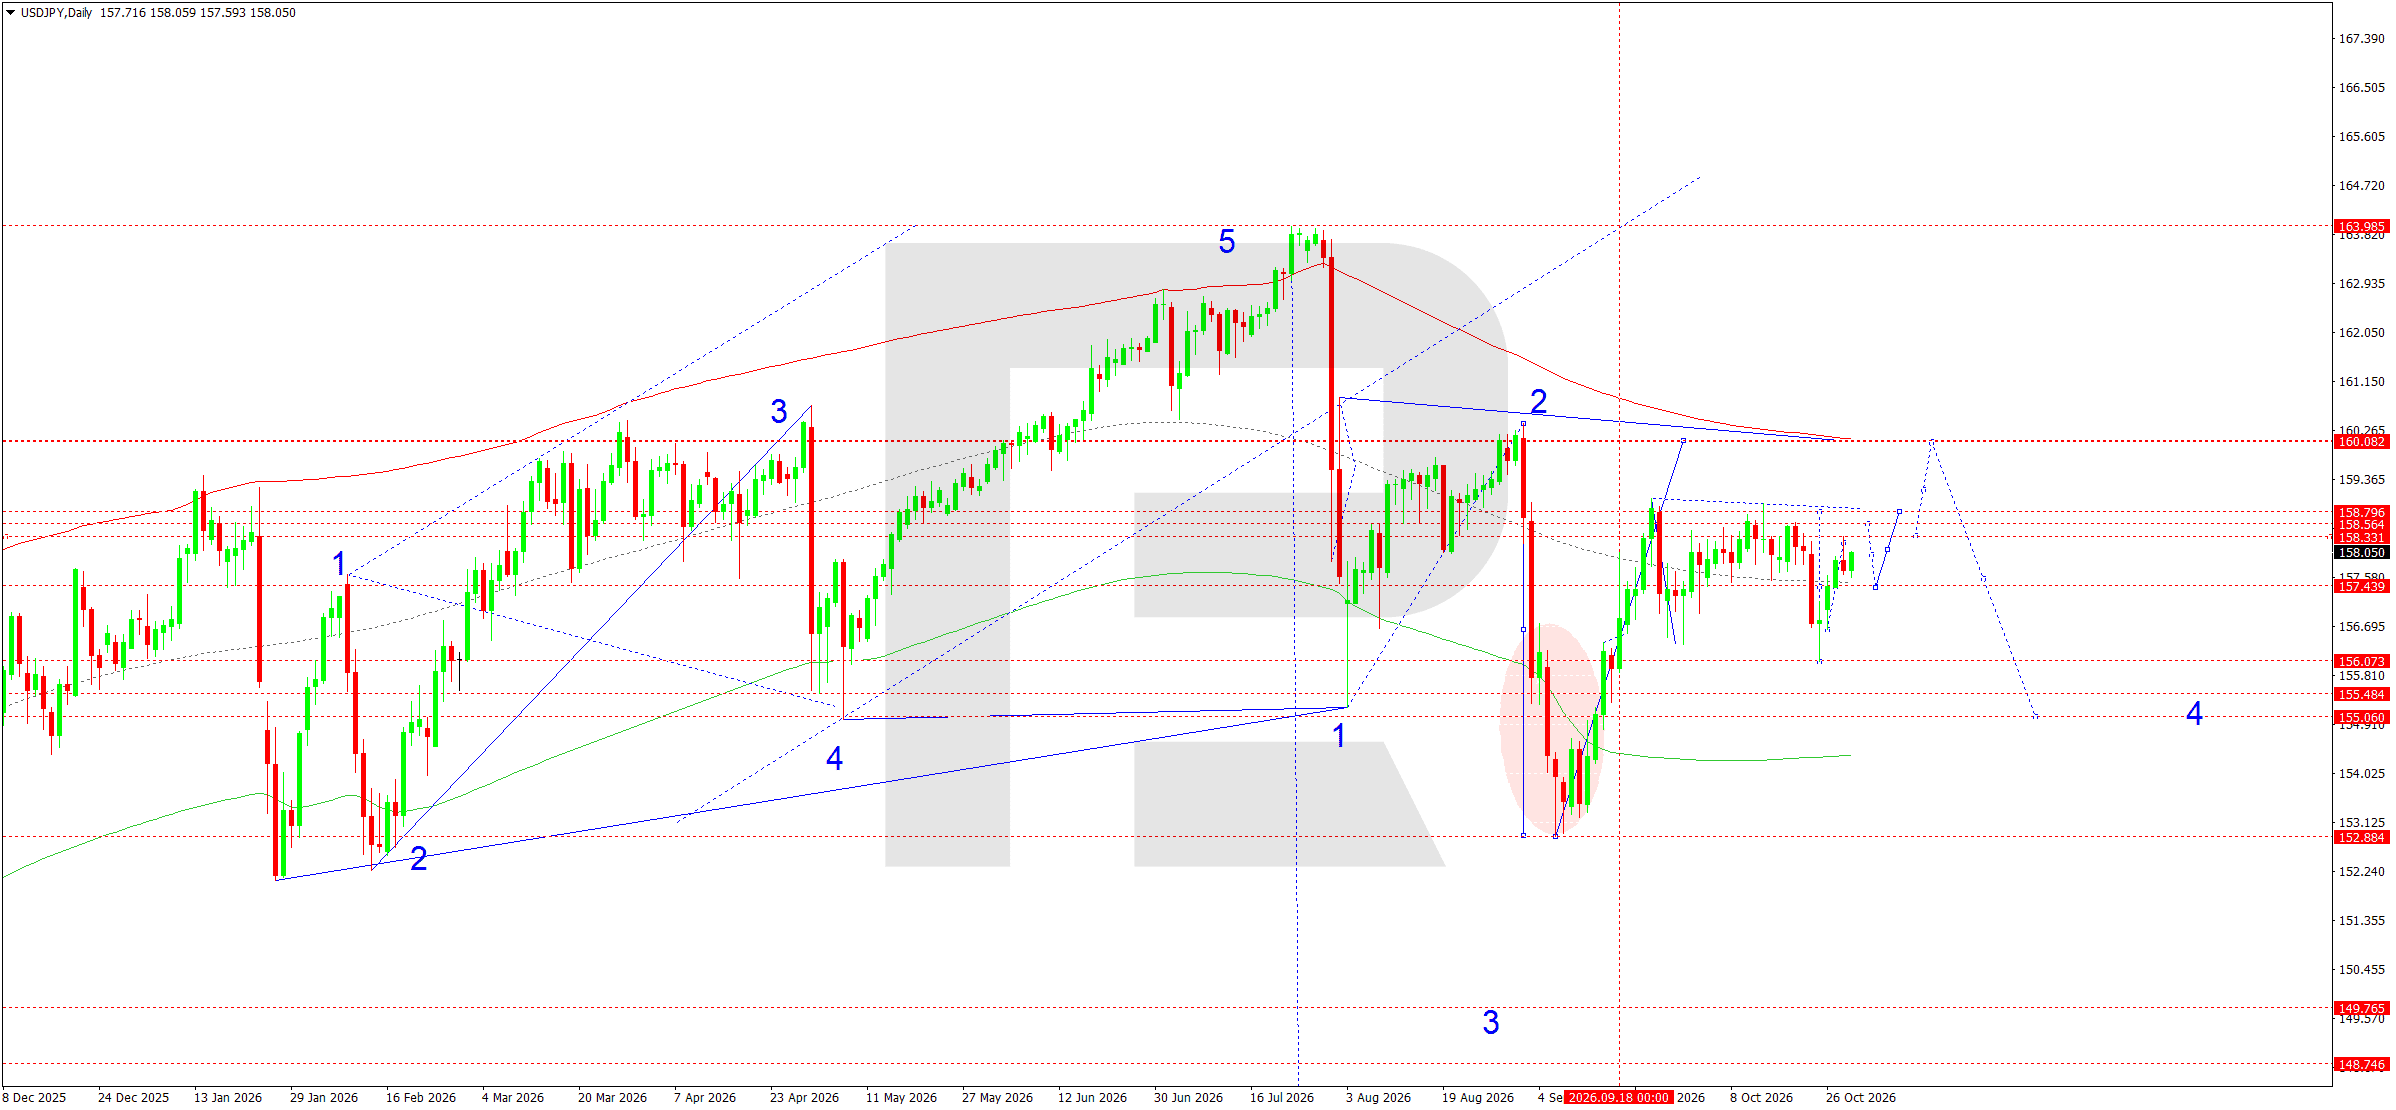
On the daily chart, a corrective structure is developing after the fifth wave of the upward impulse ended near 163.99. The decline towards 152.88 formed the third wave, after which a recovery began as part of the presumed fourth wave.
Current consolidation is taking place around 158.05. The nearest support is at 157.44, while resistance lies at 158.53. If support holds, local growth could continue towards 158.96, followed by a correction towards 158.03. The next recovery target is 160.08, where an important boundary of the descending channel lies.
The main medium-term trend remains corrective and downward relative to the 163.99 peak. Growth is therefore regarded primarily as an intermediate phase of the fourth wave. A rebound downwards from 160.08 would create conditions for a renewed decline towards 156.07 and 155.06. Consolidation above 160.08 would weaken this scenario and require a reassessment of the wave count.
USDJPY trade scenario
GBPUSD forecast
GBPUSD fundamental analysis
The British pound enters the new trading week amid expectations of central bank decisions and persistent inflation uncertainty. The main event will be the Bank of England meeting on 5 November. The regulator is keeping its rate at 3.75%, but September inflation of 3.5% strengthens the case for tighter policy. Market participants expect a 0.25 percentage point rate increase. UK government budget decisions, government bond movements, and energy prices will also have an impact.
On the dollar side, the outlook for Federal Reserve policy remains decisive. Following the decision to leave rates unchanged in October, investors are turning their attention to expectations for December. The resilience of the US economy and elevated core PCE inflation support the dollar. At the same time, potential BoE tightening could temporarily limit sterling's decline.
GBPUSD technical analysis
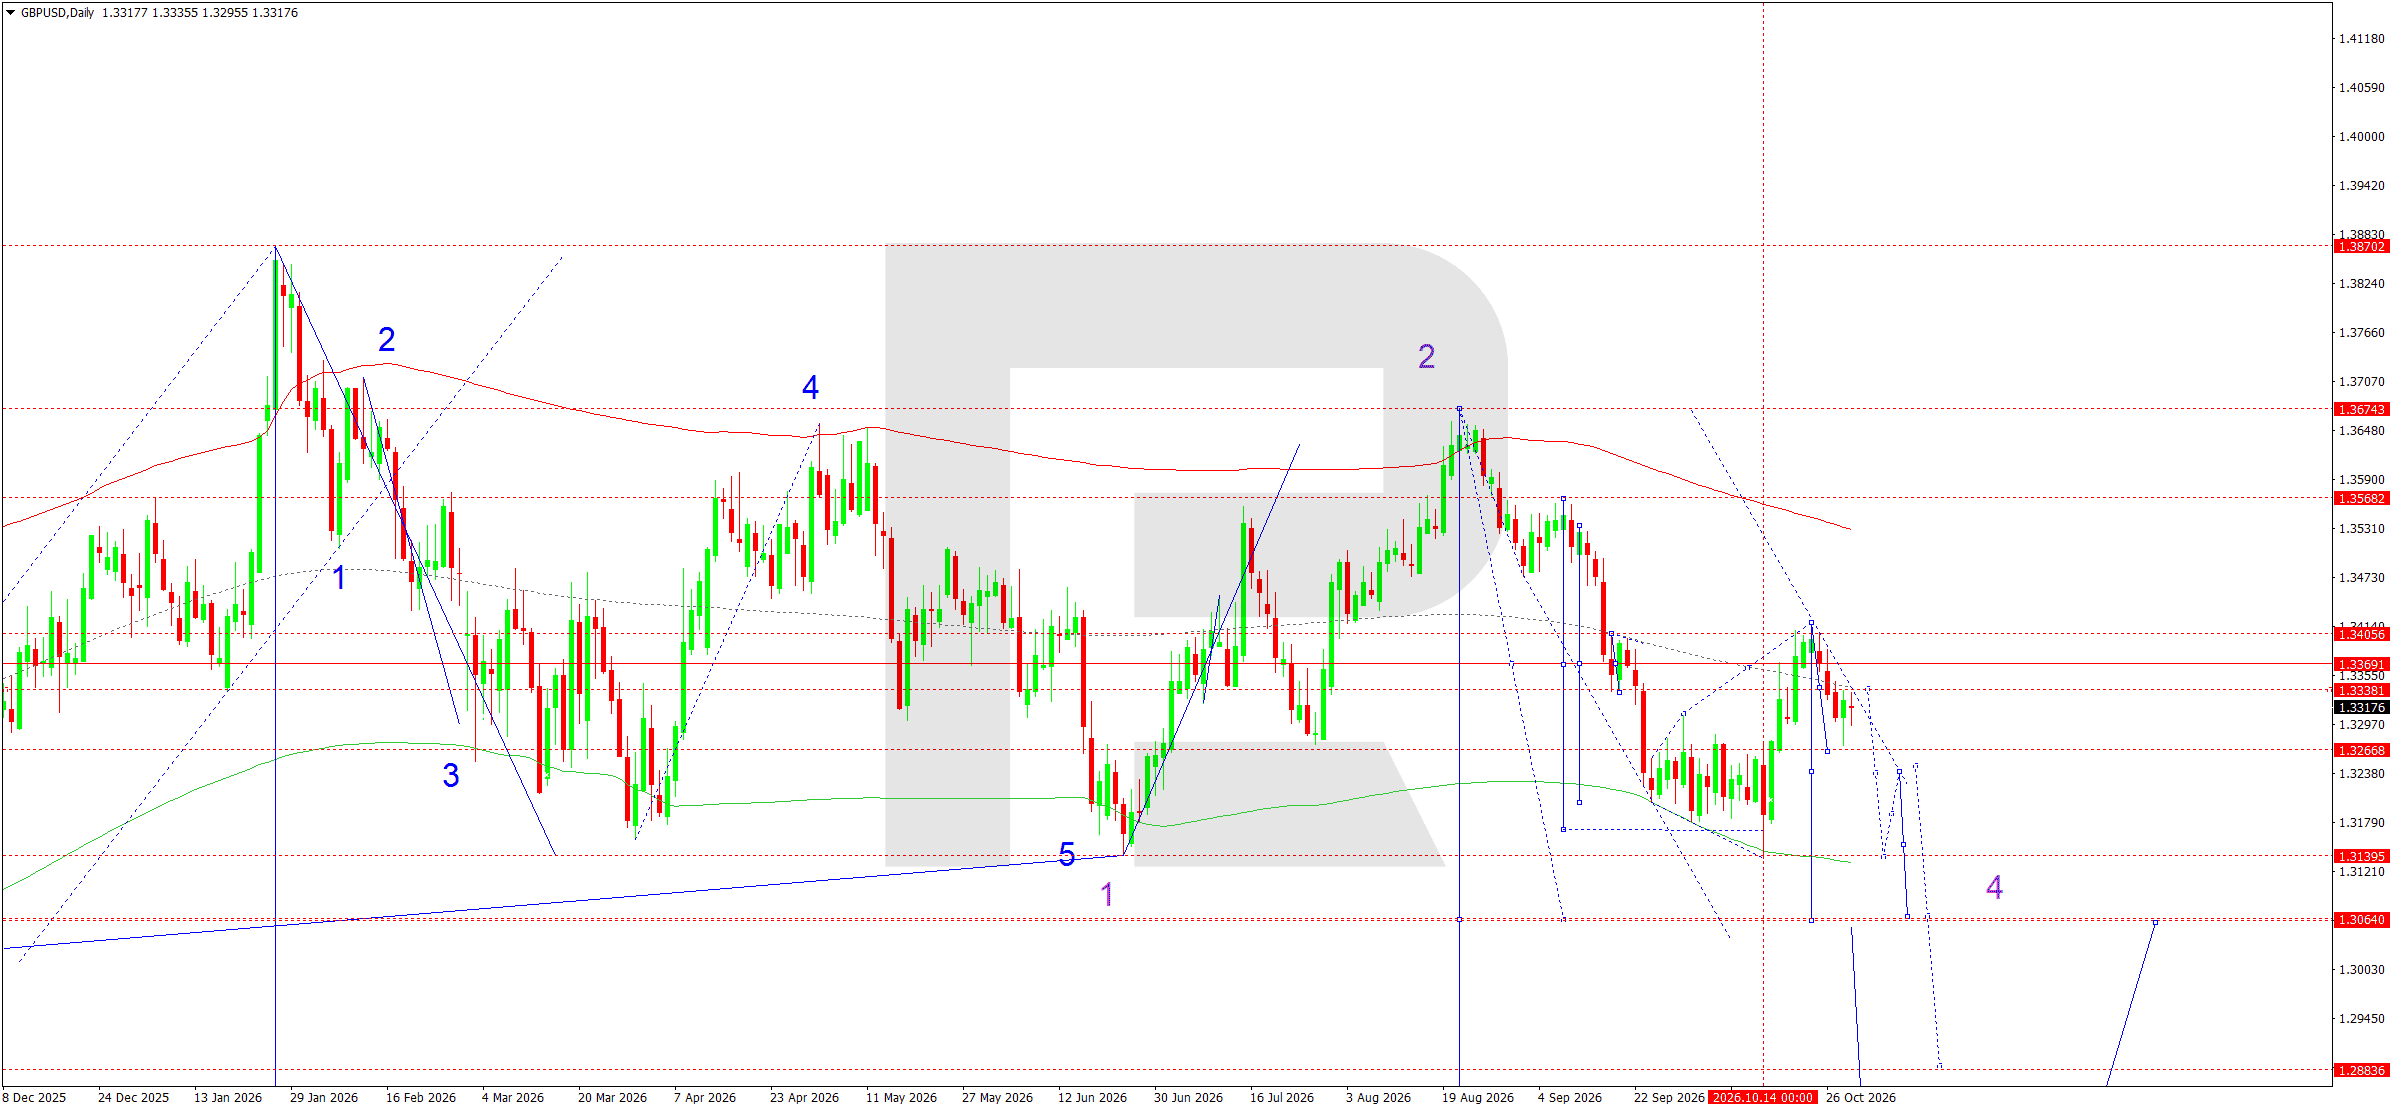
The daily chart remains predominantly bearish. After the second-wave peak formed at 1.3674, the pair has been developing a corrective structure with successively lower local highs. The price is below its long-term moving average and faces resistance around 1.3369–1.3406.
The current wave model allows for another rise towards 1.3406, followed by consolidation. This phase is viewed as the final stage of the correction before the downward movement resumes.
A break below 1.3267 would open the way towards a test of 1.3140, an important dynamic support level. Consolidation below this area would create conditions for a decline towards 1.3064, the calculated target of the fourth wave.
The main scenario anticipates a continuation of the downtrend towards 1.2884. A decisive break below this level would confirm growing selling pressure and the possibility of a further downward impulse.
Consolidation above 1.3406, however, would weaken the short-term bearish scenario and allow buyers to test 1.3568. Until such a signal emerges, selling after the local correction ends remains the priority.
GBPUSD trade scenario
AUDUSD forecast
AUDUSD fundamental analysis
The fundamental outlook for the coming week is shaped by changing expectations regarding Australian and US monetary policy. Published data showed that Australia's annual inflation accelerated to 4.3% in September from 4.0% a month earlier. This reinforced expectations of further tightening by the Reserve Bank of Australia and supported the Australian dollar.
The US Federal Reserve kept interest rates unchanged at 3.75–4.00% on 28 October, noting resilient economic activity and persistent inflationary pressures. The possibility of further rate increases limits the potential for US dollar weakness. In the coming week, investors will focus on the RBA's decisions, US macroeconomic data, and the outlook for the interest rate differential.
Chinese economic activity, commodity market movements, and global risk appetite will also have an impact. Slower Chinese demand could put additional pressure on the Australian currency.
AUDUSD technical analysis
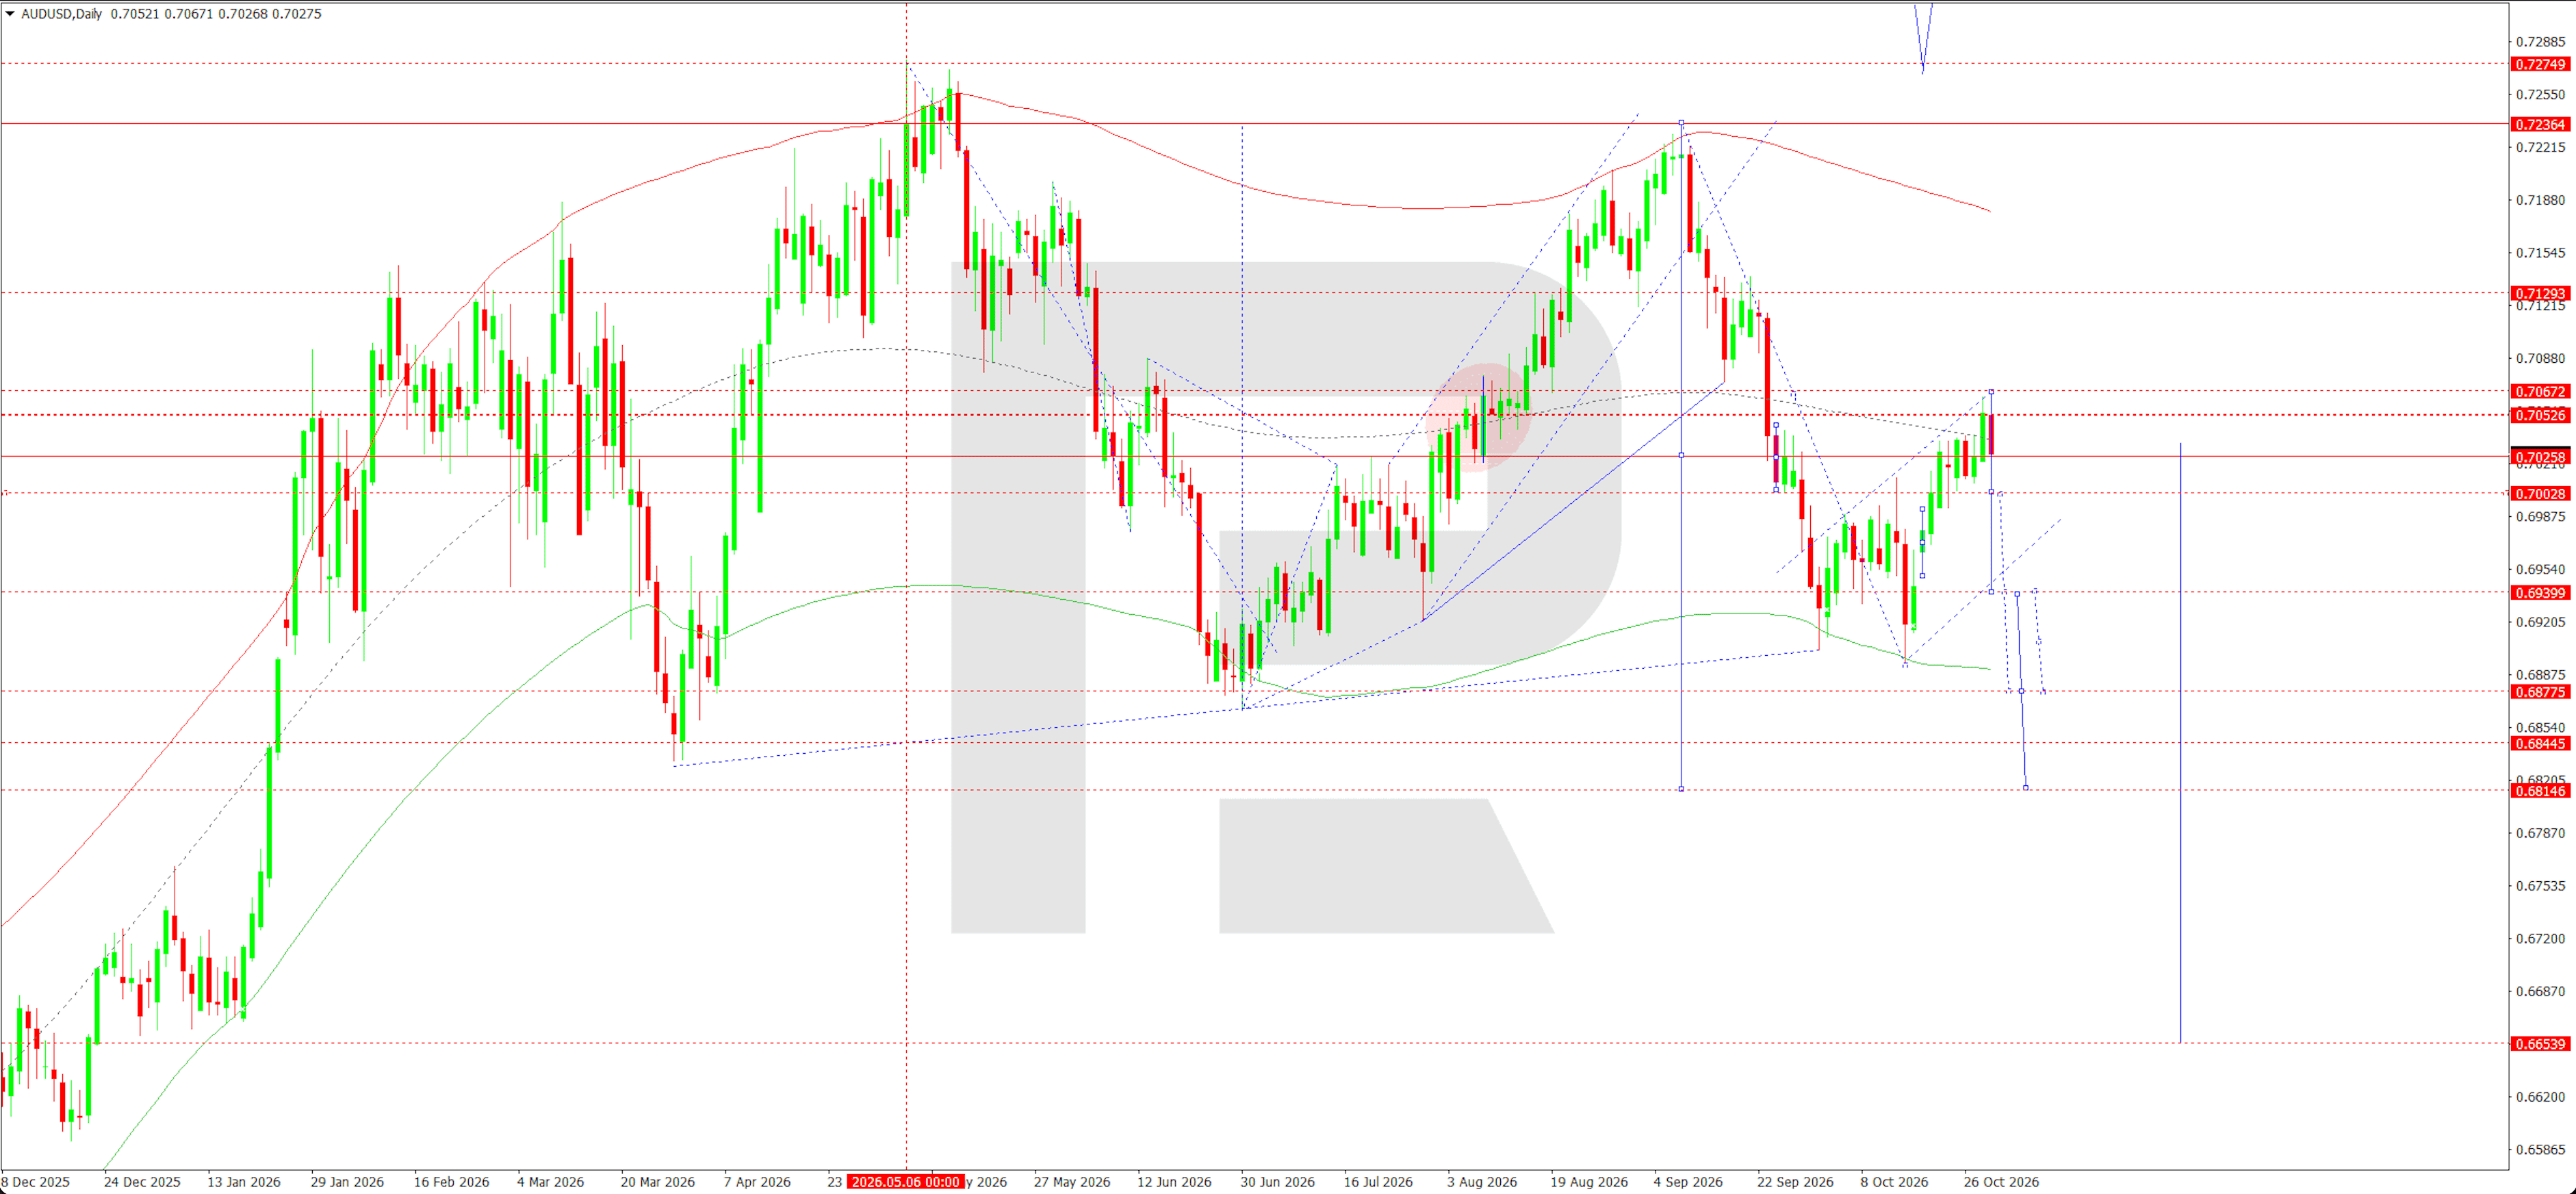
The daily chart indicates a corrective recovery following the decline from 0.7236. The current price is near 0.7028. Under the Elliott Wave structure, the upward corrective wave is expected to end in the 0.7053–0.7067 area, where the nearest resistance levels are located.
The main medium-term trend remains downward. The price is below the upper boundary of the dynamic channel, while the pattern of recent highs indicates limited upside potential.
After a test of 0.7067, a downward reversal wave is expected, initially targeting 0.7003. A break below this support would open the way towards 0.6939, an important area of previous lows.
Further development of the bearish impulse would imply a decline towards 0.6878 and the main target at 0.6845. Once this wave is complete, a corrective recovery towards 0.6939 is likely.
Consolidation above 0.7067 would weaken the bearish scenario and create conditions for further growth towards 0.7129. However, until a confirmed break above resistance occurs, selling as the corrective movement ends remains the priority.
AUDUSD trade scenario
USDCAD forecast
USDCAD fundamental analysis
In the coming week, USDCAD movements will be shaped by divergent expectations for monetary policy in the US and Canada, labour market conditions, and oil prices. On 28 October, the Bank of Canada raised its key rate by 0.2500 percentage points to 2.5000%, citing persistent inflationary pressure and improving economic activity. The regulator has left open the possibility of further tightening, supporting the Canadian dollar.
The US Federal Reserve kept interest rates unchanged. However, the absence of clear signals about its December decision is limiting US dollar strength. High oil prices remain another source of support for the Canadian dollar, although trade disputes between the US and Canada continue to pose economic risks.
The week's main events will be the ISM indices and US and Canadian employment figures on 6 November. The results could significantly alter market participants' short-term expectations.
USDCAD technical analysis
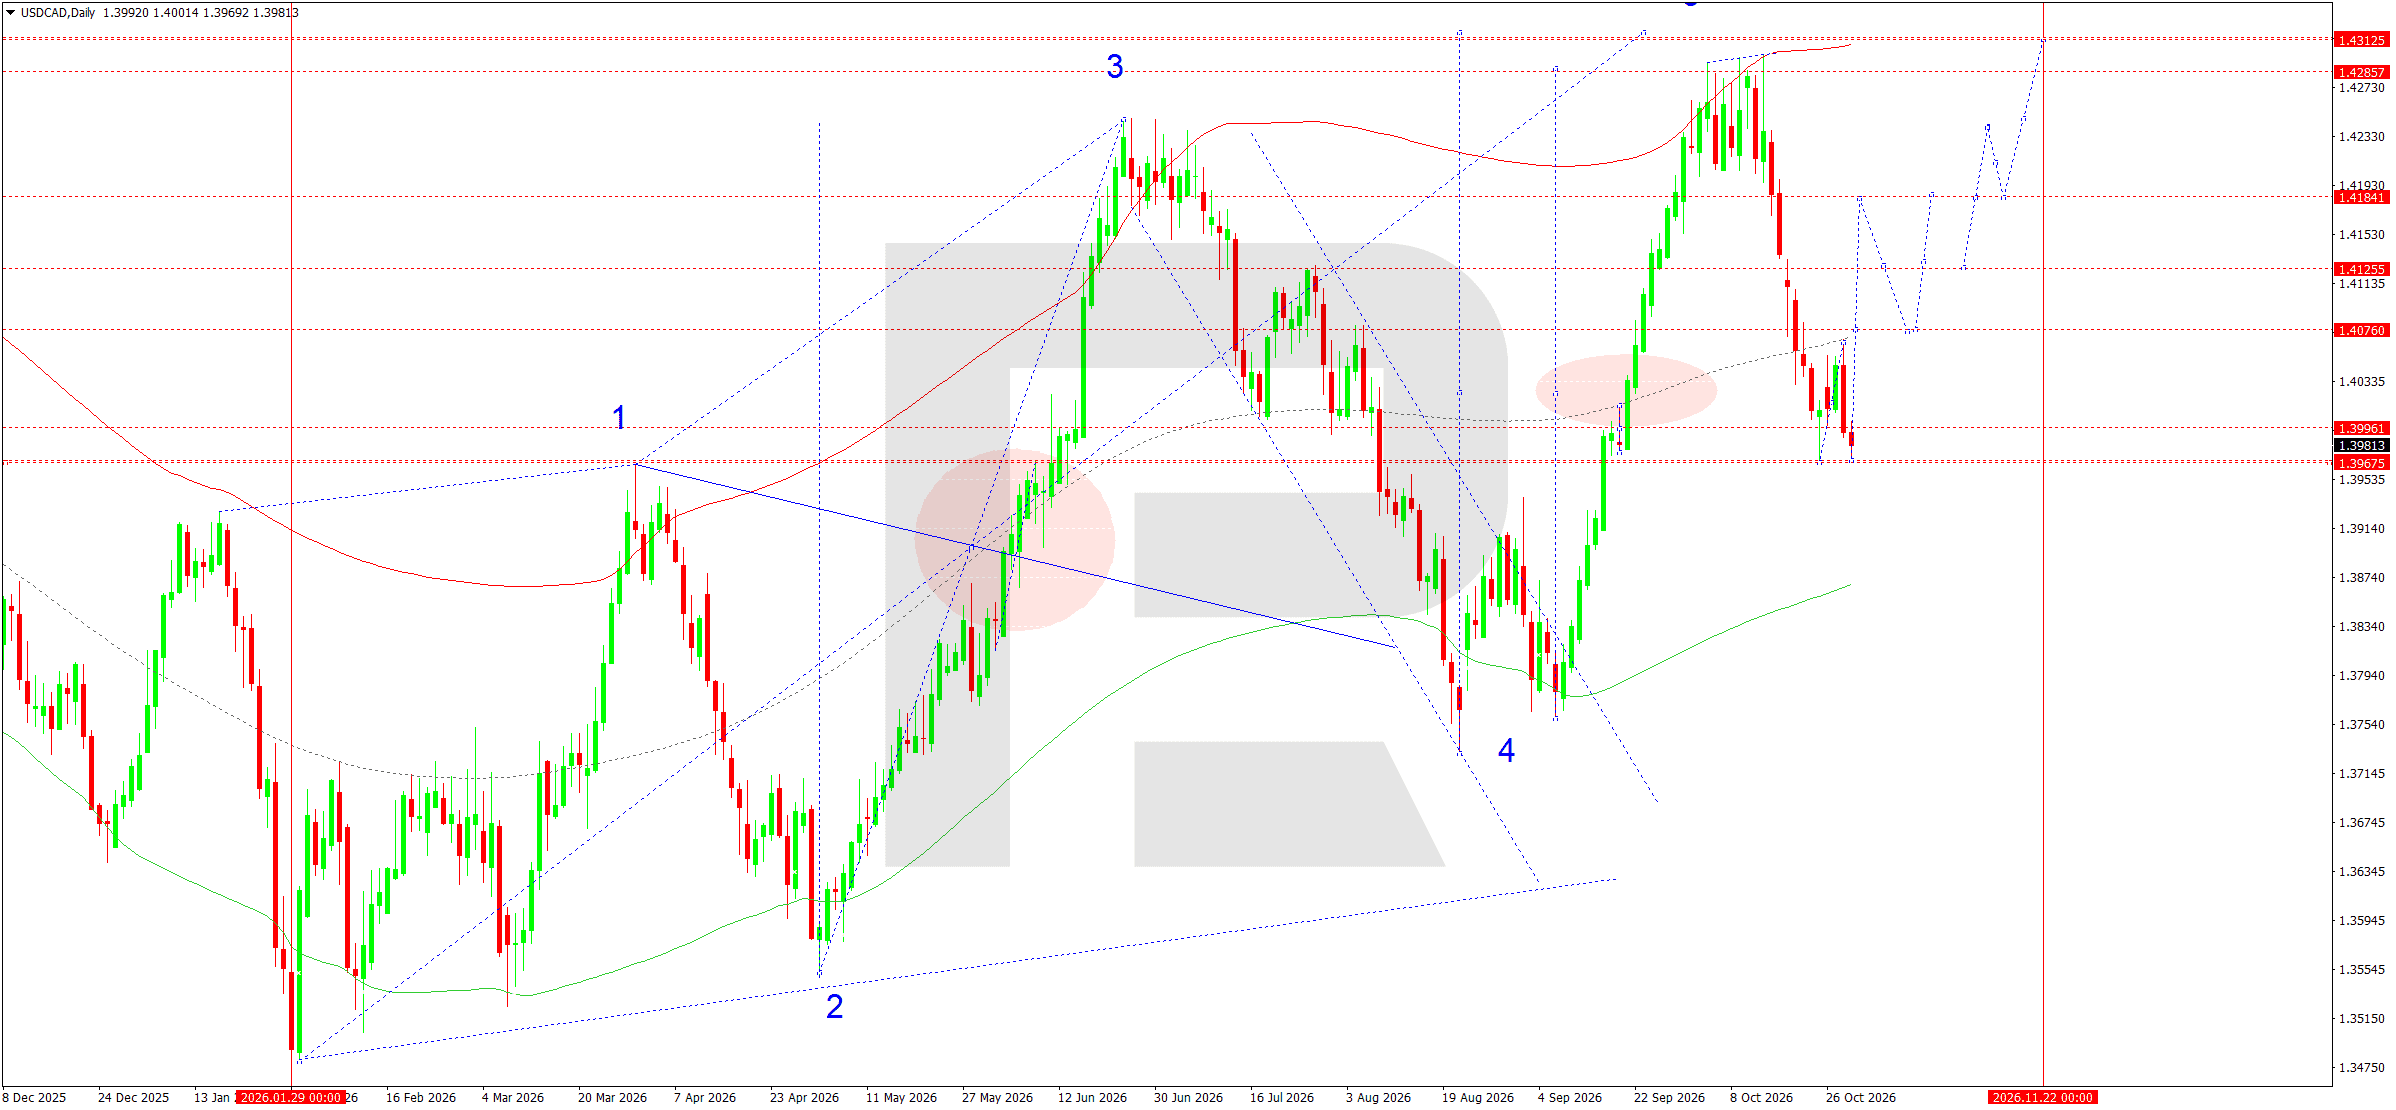
The daily USDCAD chart retains a medium-term upward Elliott Wave structure. Following the completion of corrective wave 4, an upward movement developed and reached resistance at 1.4286. The subsequent decline brought prices to 1.3960, a key technical support area.
The current configuration suggests consolidation above this level may form before the upward movement resumes. Initial targets are resistance at 1.4076 and 1.4184. Consolidation above the latter would open the way to a renewed test of 1.4286 and the main target at 1.4313.
The 1.3960 area is critical to the bullish scenario. Sustained consolidation below it would increase the likelihood of a further correction towards 1.3898 and the lower boundary of the medium-term ascending structure.
The main forecast envisages the completion of the local decline, the formation of a reversal pattern, and an upward move towards 1.4313. Reaching this area would increase the likelihood of a new downward correction, potentially targeting 1.3898. A return above 1.4076 while support at 1.3960 holds would confirm renewed buying activity. Until then, the market may remain range-bound.
USDCAD trade scenario
XAUUSD forecast
XAUUSD fundamental analysis
The fundamental backdrop for gold remains predominantly negative. Following its meeting on 28 October, the Federal Reserve kept interest rates within the 3.75–4.00% range, highlighting economic resilience and persistent inflation risks. Strong US GDP figures, accelerating inflation, and rising oil prices are reinforcing expectations of further monetary tightening. Higher US Treasury yields and a stronger dollar are limiting gold's appeal as an investment.
Geopolitical tensions in the Middle East remain another source of uncertainty. Although they support safe-haven assets, the inflationary effects of expensive oil could increase pressure on gold. In the coming week, investors will focus on the ISM indices, ADP employment data, and Friday's NFP report. Strong US labour market figures could support the dollar and accelerate a decline in XAUUSD.
XAUUSD technical analysis
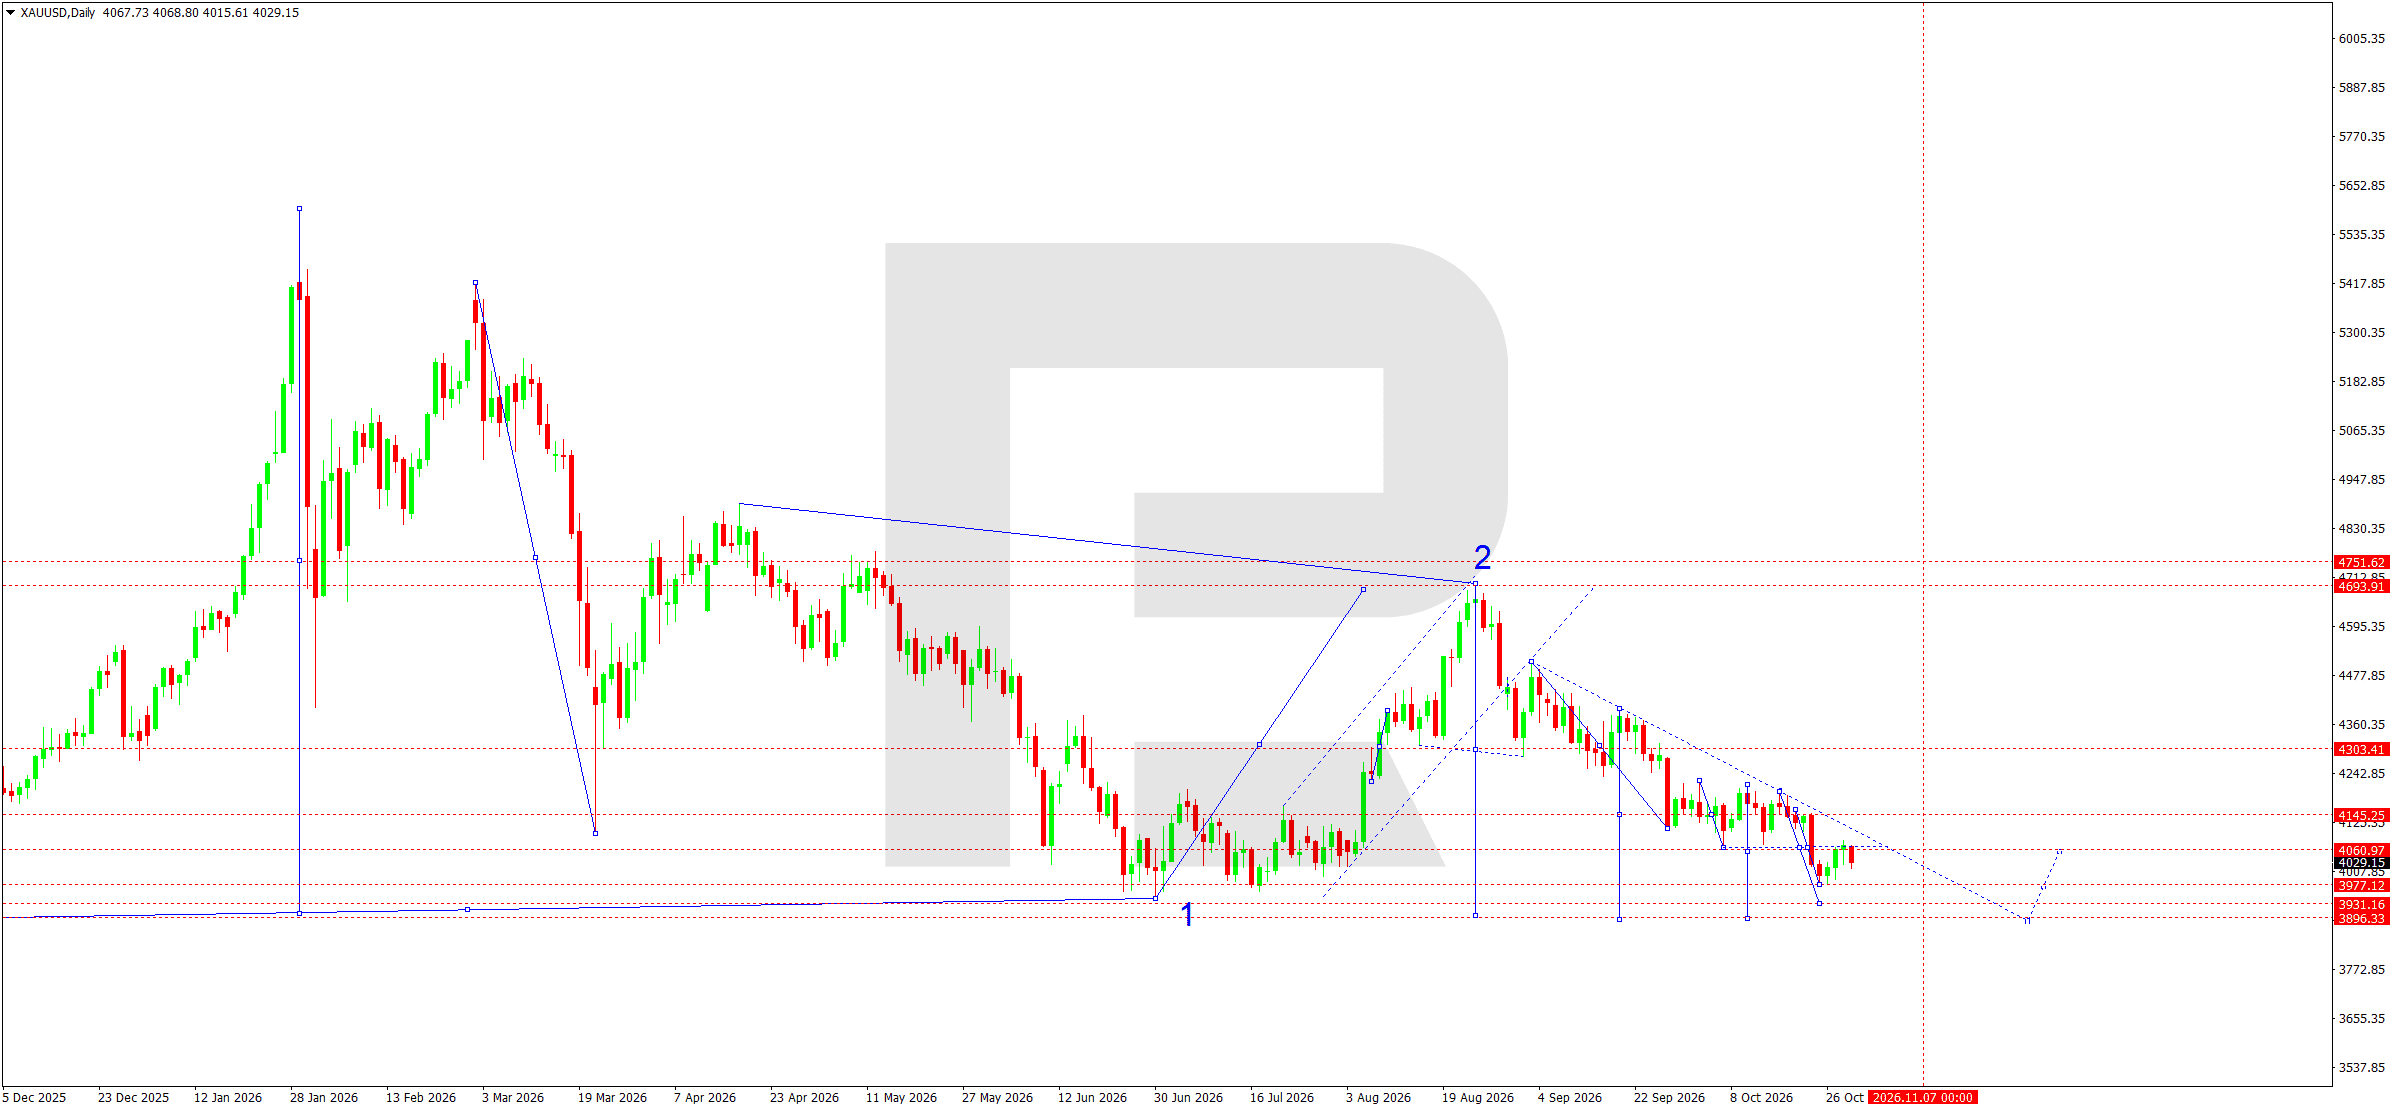
The daily chart remains bearish. After wave 2 peaked near 4,694, gold began a sequence of declines within a descending channel. The break of the upward structure confirmed that the corrective recovery had ended and the bearish movement had resumed.
During the past week, local consolidation formed below resistance at 4,145. Recovery attempts are being constrained by a descending trendline connecting successively lower highs. The current 4,029 area is an intermediate equilibrium zone between buyers and sellers.
The nearest downside target remains support at 3,977, followed by 3,931. The main target is at 3,896, where significant horizontal support lies. Reaching this level could complete another segment of the downward wave structure.
A change in the short-term direction would require consolidation above 4,145 and a break above the upper boundary of the descending channel. Until then, selling on local corrective rises remains the priority. The main weekly forecast envisages a further decline towards 3,896, possibly with an intermediate test of 3,977. Volatility could increase significantly following the release of US employment statistics on Friday.
XAUUSD trade scenario
US 500 forecast
US 500 fundamental analysis
The US stock market enters the first week of November amid continued uncertainty over the Federal Reserve's future monetary policy, the inflation outlook, and the resilience of US economic growth. Investors will focus on business activity data, labour market conditions, and government bond yields. Strong economic figures could support corporate earnings but may also curb expectations of monetary easing.
Quarterly reports from major US companies, particularly in the technology sector, will also influence the US 500 index. Investors will continue to assess returns on artificial intelligence investment, consumer demand trends, and corporate guidance. Elevated geopolitical tensions and changes in US trade policy remain risk factors. If bond yields stabilise and appetite for risky assets persists, the stock market could resume its upward movement.
At the close of trading on 29 October, the S&P 500 fell by 0.3% to 7,720, demonstrating its sensitivity to corporate earnings. ISM releases and Friday's employment report could generate additional volatility in the coming week.
US 500 technical analysis
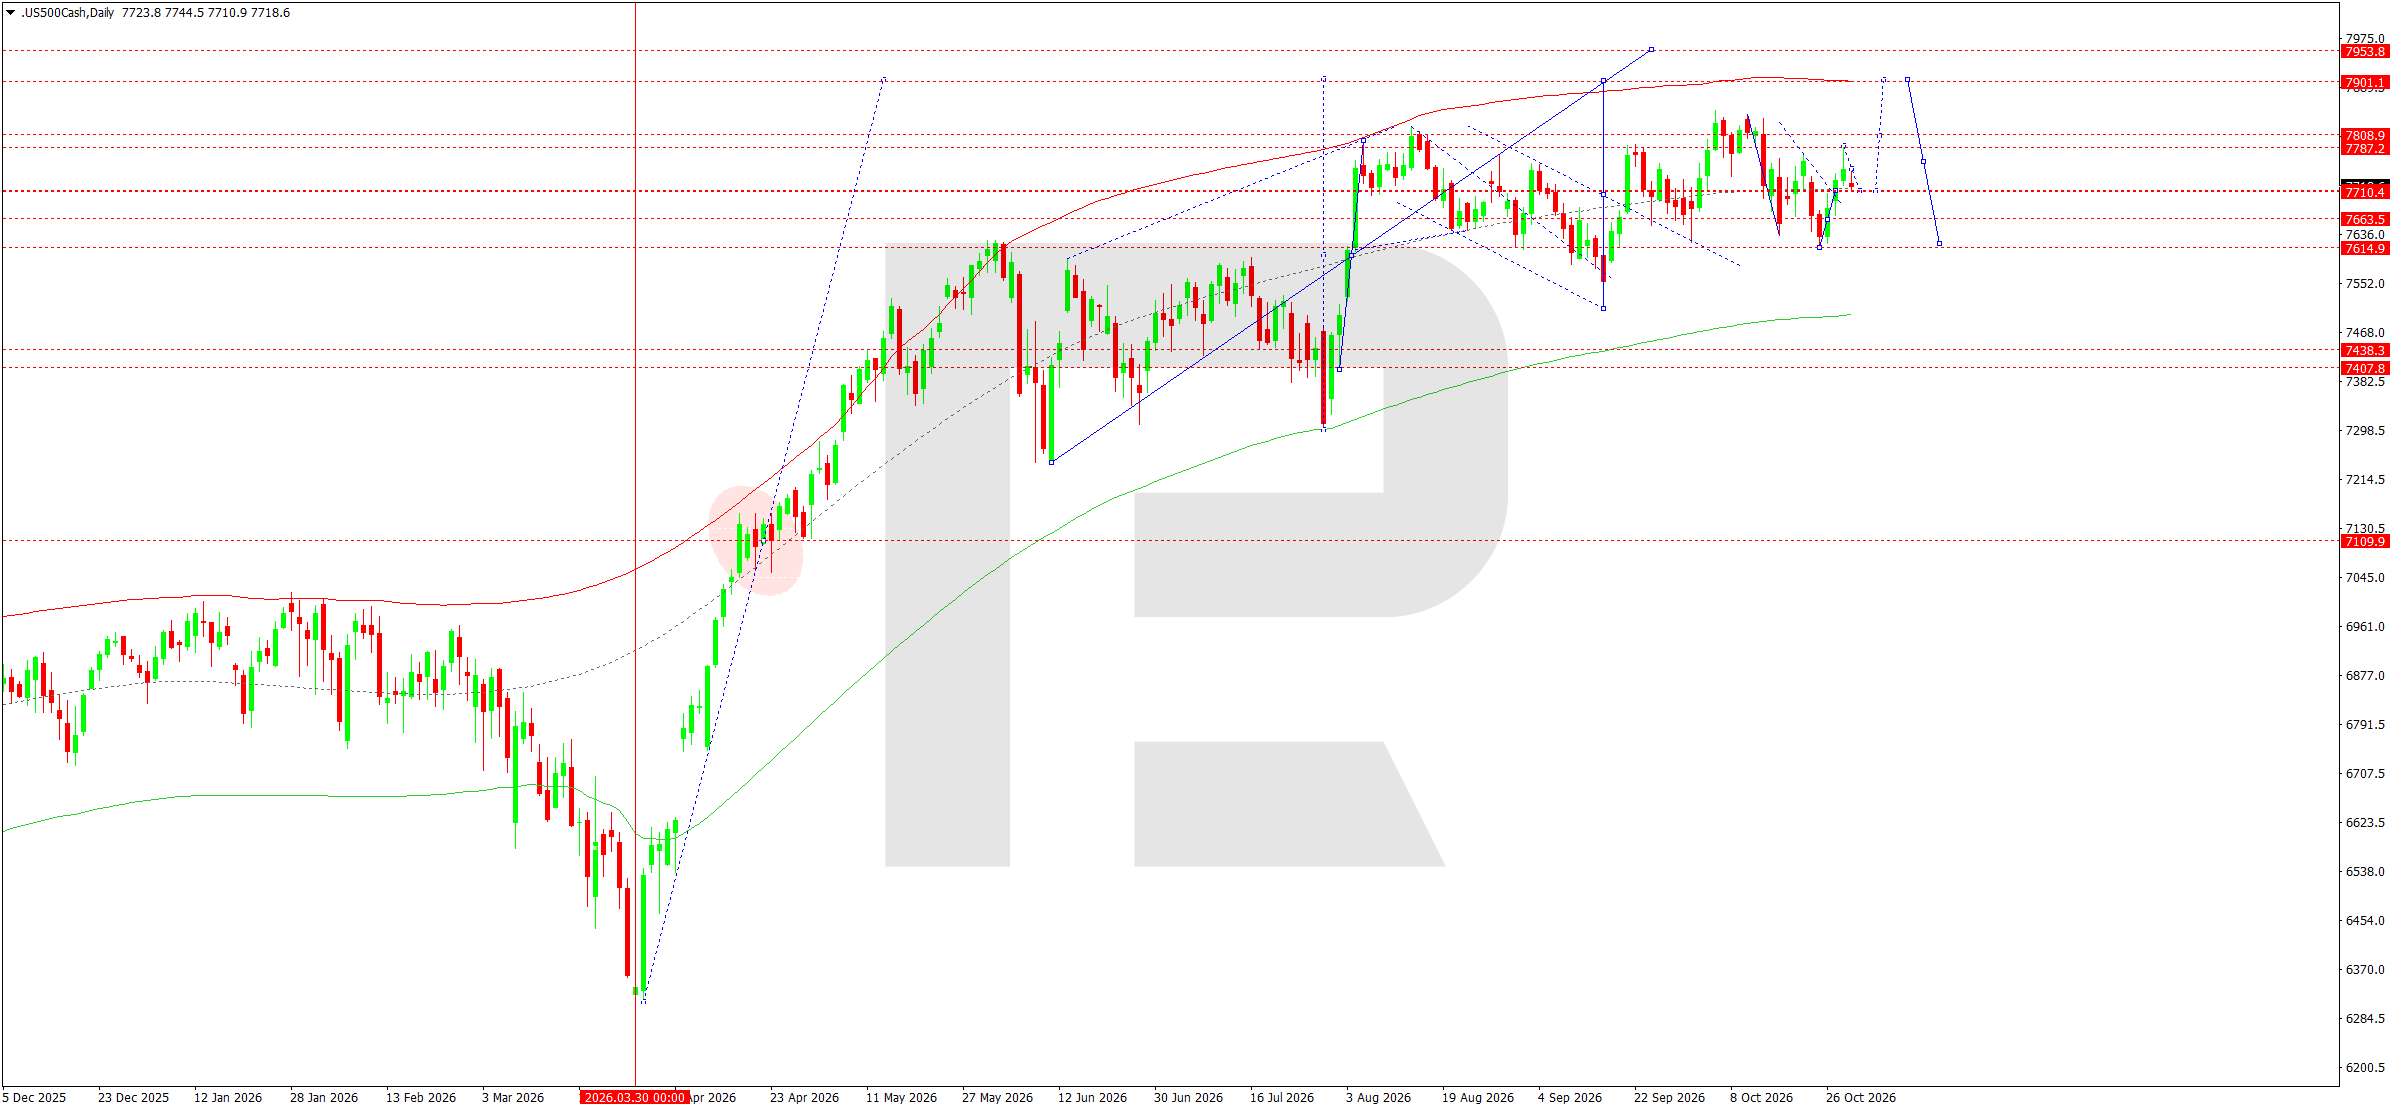
The daily chart retains a predominantly bullish structure despite a correction following the formation of a local high at 7,809. Under the Elliott Wave model, the decline is viewed as an intermediate correction within the main upward impulse. The nearest target is the 7,630–7,615 area, where consolidation and the formation of a reversal point are possible.
If this zone holds, conditions would emerge for a new upward wave initially targeting 7,787, followed by a move towards 7,901. A break above the upper boundary would extend the potential rise to 7,954. Conversely, a break below 7,615 would increase corrective risks and delay the bullish scenario.
The main weekly forecast suggests a decline, followed by stabilisation near the support level and a subsequent recovery in the index.
US 500 trade scenario
BTCUSD forecast
BTCUSD fundamental analysis
In the coming week, Bitcoin movements will depend on expectations for US monetary policy, changes in government bond yields, and investors' attitude towards risky assets. The outlook for Federal Reserve interest rates is particularly important because the cost of dollar liquidity directly affects investment demand for cryptocurrencies.
Persistently hawkish Fed rhetoric could support the US dollar and limit a recovery in BTCUSD. Conversely, stronger expectations of monetary easing would create conditions for buyers to return. Business activity indicators and US labour market data will also influence the market and could change forecasts for the regulator's future decisions.
Capital flows through spot Bitcoin ETFs, institutional investor activity, and the state of the US stock market remain important factors. A sustained recovery in equity indices could support the cryptocurrency sector, while heightened geopolitical tensions increase the likelihood of reductions in speculative positions.
BTCUSD technical analysis
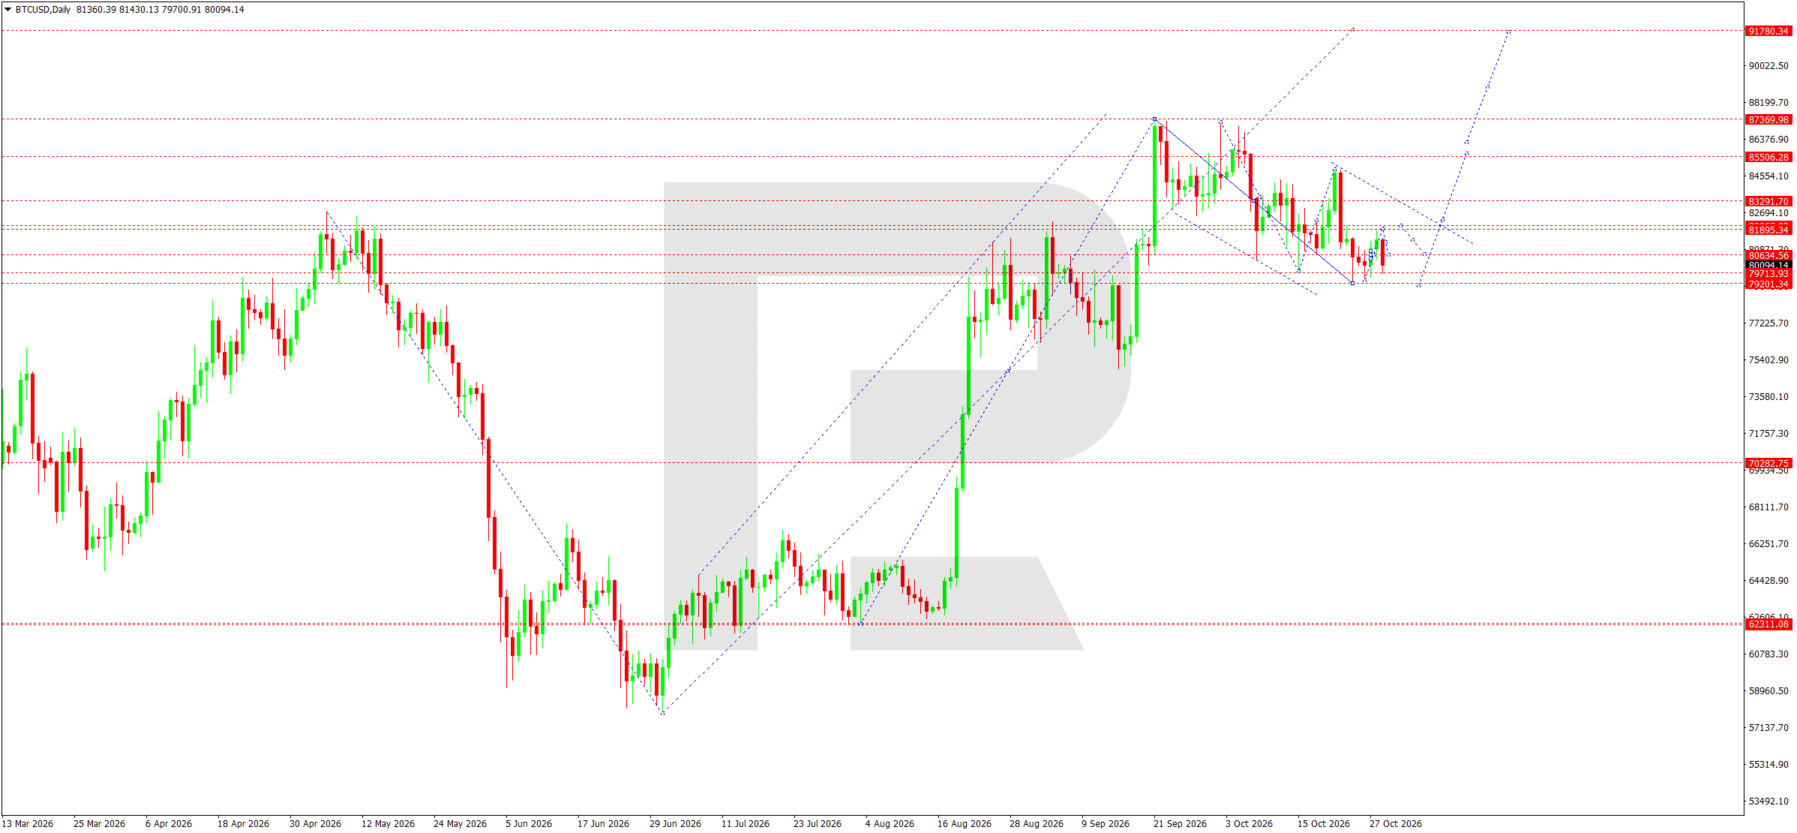
The BTCUSD daily chart retains a medium-term bullish structure, although short-term movements are characterised by a corrective decline. After forming a peak at 87,370, the market successively broke below support at 81,900, 80,635, and 79,607, completing a downward wave towards 76,475.
Under the Elliott Wave model, this decline is considered a correction relative to the previous upward impulse. The 76,475 area coincides with an important pivot point and a potential zone where the correction could end. Consolidation above this support is expected in the coming week, followed by a recovery in buying activity.
The initial upside target is resistance at 79,607, followed by 80,635. Consolidation above these levels would create conditions for a move towards 83,559. Medium-term targets lie around 86,287 and 87,370. Extended upside targets are at 88,065 and 91,780.
A break below support at 76,475 would invalidate the near-term recovery scenario and increase the likelihood of a decline towards 74,855. The main forecast envisages buyers holding this zone and a new upward move gradually developing.
BTCUSD trade scenario
Weekly summary
In the coming week, investors will focus on US economic data, the Reserve Bank of Australia's interest rate decision and an assessment of the outcomes of major central bank meetings held in late October. The main market drivers will remain US dollar movements, government bond yields, US labour market conditions, and changes in risk appetite. For the eight instruments under review, confirmation of current technical trends or the formation of a corrective recovery will be crucial. The strongest market reactions could follow US employment and business activity data, which will influence expectations for future Fed policy and determine the direction of EURUSD, USDJPY, GBPUSD, AUDUSD, USDCAD, XAUUSD, US 500, and BTCUSD.
Editors' picks


EURUSD forecast 2026–2027: technical analysis, price levels & predictions
The EURUSD outlook for 2026 and 2027: key levels on the daily chart, three trading scenarios, and the policy gap between the Fed and the ECB that drives the pair.

Gold (XAUUSD) forecast 2026: technical analysis, price levels & predictions
Where gold could trade in 2026: key levels, three trading scenarios with entry triggers, and the forecasts from J.P. Morgan, Deutsche Bank, and Goldman Sachs.
Forecasts presented in this section only reflect the author’s private opinion and should not be considered as guidance for trading. RoboForex bears no responsibility for trading results based on trading recommendations described in these analytical reviews.