
Weekly Forex forecast for 9–13 November 2026: key levels for currencies, gold, US 500, and Bitcoin
The weekly forecast for 9–13 November 2026 includes six sell scenarios and two buy scenarios for eight instruments.
Table of Contents (H2)
Key levels for the week
| Instrument | Week | Support | Resistance | Scenario |
|---|---|---|---|---|
| EURUSD | +0.8% | 1.1104 | 1.1269 | Sell from 1.1218 |
| USDJPY | +0.1% | 157.50 | 158.50 | Buy from 157.87 |
| GBPUSD | +0.8% | 1.3343 | 1.3505 | Sell from 1.3452 |
| AUDUSD | −1.2% | 0.6833 | 0.6970 | Sell from 0.6970 |
| USDCAD | +0.4% | 1.4045 | 1.4065 | Buy from 1.4065 |
| XAUUSD | +5.8% | 4,005 | 4,147 | Sell from 4,099 |
| US 500 | −2.8% | 7,300 | 7,375 | Sell from 7,375 |
| BTCUSD | −3.3% | 75,222 | 81,155 | Sell from 75,222 |
What moves markets this week
During 9–16 November 2026, investors will focus on US inflation: the Consumer Price Index is due on 10 November, followed by the Producer Price Index on 13 November. These figures could change expectations for Federal Reserve interest rates and set the direction for the dollar, gold, and equity indices. Additional reference points will be UK GDP on 12 November and Chinese economic activity data on 16 November, helping to assess the outlook for global demand. The response of US Treasury yields to inflation readings could amplify fluctuations in currencies and Bitcoin, while investors' risk appetite will depend on how closely the releases match expectations.
Events that can move markets this week
| Day | Event | Why it matters |
|---|---|---|
| Monday, 9 November 2026 | China: October CPI and PPI | These will show the state of consumer demand and factory-gate prices. Unexpectedly weak figures could reinforce expectations of economic stimulus and affect the yuan, Chinese equities, and commodities. |
| Tuesday, 10 November 2026 | US: October consumer inflation (CPI), including the core index | The week's main inflation release. Higher-than-expected readings could raise the expected path of Fed interest rates, support the dollar and bond yields, and put pressure on equities. |
| Wednesday, 11 November 2026 | Veterans Day in the US: SIFMA recommends a bond market closure | Holiday trading conditions could reduce liquidity and complicate assessments of the bond market's reaction to the previous day's CPI release. |
| Thursday, 12 November 2026 | US: EIA weekly oil inventories report, main tables. The release has been moved from Wednesday due to the holiday | Unexpected changes in crude oil and fuel inventories, refinery utilisation, and demand could move WTI, Brent, and oil company shares. |
| Friday, 13 November 2026 | Eurozone: updated preliminary estimate of third-quarter GDP. US: October Producer Price Index (PPI) | A substantial revision to growth could affect expectations for ECB policy, the euro, and European equities. Its impact is usually weaker than that of the initial estimate. This will add to the inflation picture following CPI. Some components help refine expectations for the PCE index monitored by the Fed; the dollar, bonds, and equities could react. |
EURUSD forecast
EURUSD fundamental analysis
The euro enters the new week under the influence of inflation risks, fluctuations in oil prices, and a reassessment of the outlook for US interest rates. At its October meeting, the US Federal Reserve left its monetary policy settings unchanged, although two voting members favoured a rate increase. Persistent inflation limits the scope for easing, supporting the dollar's appeal. The European Central Bank also kept rates unchanged, highlighting the risk of accelerating inflation due to higher energy prices.
The dollar came under pressure after the US elections, but expectations of further Fed tightening have not changed significantly. For the euro, expensive oil creates additional vulnerabilities through higher import costs and pressure on economic activity. The main focus in the coming week will be US inflation. A reading above expectations could support the dollar, while slower price growth would allow EURUSD to continue its recovery. At the time of writing, on the morning of 6 November, the US employment report had not yet been released: its results could change the assumptions underlying the weekly forecast.
EURUSD technical analysis
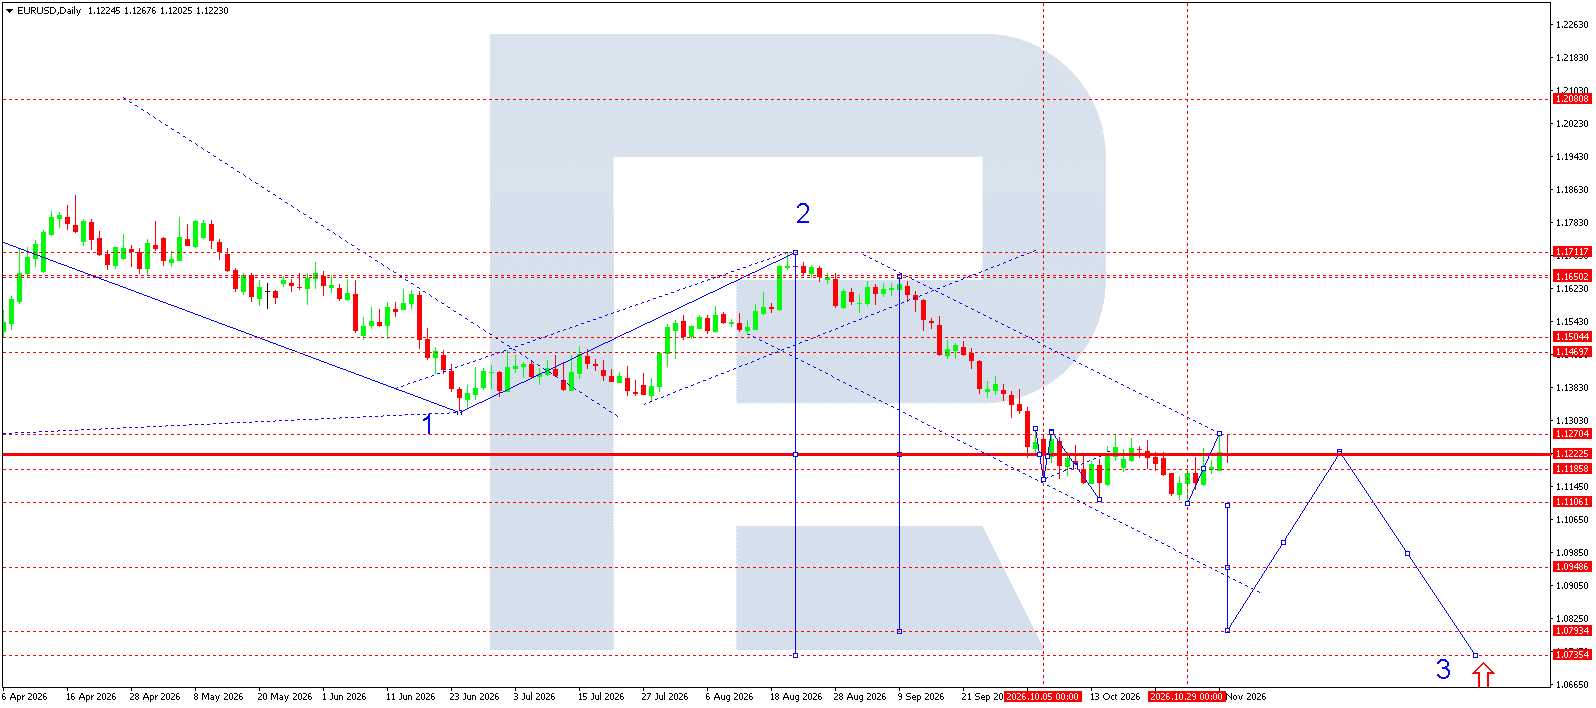
On the daily chart, the main trend remains downward. Following the completion of the marked second wave near 1.1712, a steady decline developed within a descending channel. The subsequent recovery from the 1.1106 area remains corrective and does not yet confirm a reversal of the main trend.
The price shown on the supplied chart is 1.1223. The nearest significant barrier is at 1.1270: failure to consolidate above it would preserve sellers' advantage. The main weekly scenario envisages a return below 1.1186, followed by a test of 1.1106. Selling is considered once the decline resumes, five points below the indicated price.
A decisive break below 1.1106 would open the way towards 1.0949. The calculated third-wave targets are at 1.0793 and 1.0735, although these relate to a longer time horizon. Consolidation above 1.1270 would weaken the immediate bearish scenario and increase the likelihood of a broader correction. The stop is placed slightly above this boundary.
EURUSD trade scenario
The main scenario envisages further declines with limited upward corrections. Consolidation above 1.1270 would temporarily ease selling pressure but would not alter the overall bearish structure. If the third wave develops, the next potential target would be the 1.0370 area. Selling remains the priority once a breakout from the current range is confirmed.
USDJPY forecast
USDJPY fundamental analysis
The fundamental backdrop for USDJPY reflects a conflict between the high yields on dollar-denominated assets and the prospect of further tightening of Japanese monetary policy. On 28 October, the US Federal Reserve (Fed) kept its interest rate in the 3.75–4.00% range. The regulator noted sustained economic growth and elevated inflation, while two meeting participants favoured a rate increase. This stance supports the dollar: there is still insufficient reason to expect imminent monetary easing. Fed decision
The Bank of Japan is keeping its interest rate at 1.25%. In its forecast published on 2 November, the regulator highlighted risks of accelerating inflation due to higher energy prices, wage growth, and the yen's previous depreciation. This supports expectations of another rate increase, limiting USDJPY's upside potential. At the same time, expensive oil worsens Japan's terms of trade, putting additional pressure on its currency. BoJ materials
In the coming week, attention will focus on US inflation: consumer prices are scheduled for release on 10 November and producer prices on 13 November. Strong readings could support US Treasury yields and the dollar; slower inflation would strengthen the yen's position. The sustainability of the pair's recovery will therefore depend on a reassessment of interest rate expectations. Release calendar
USDJPY technical analysis
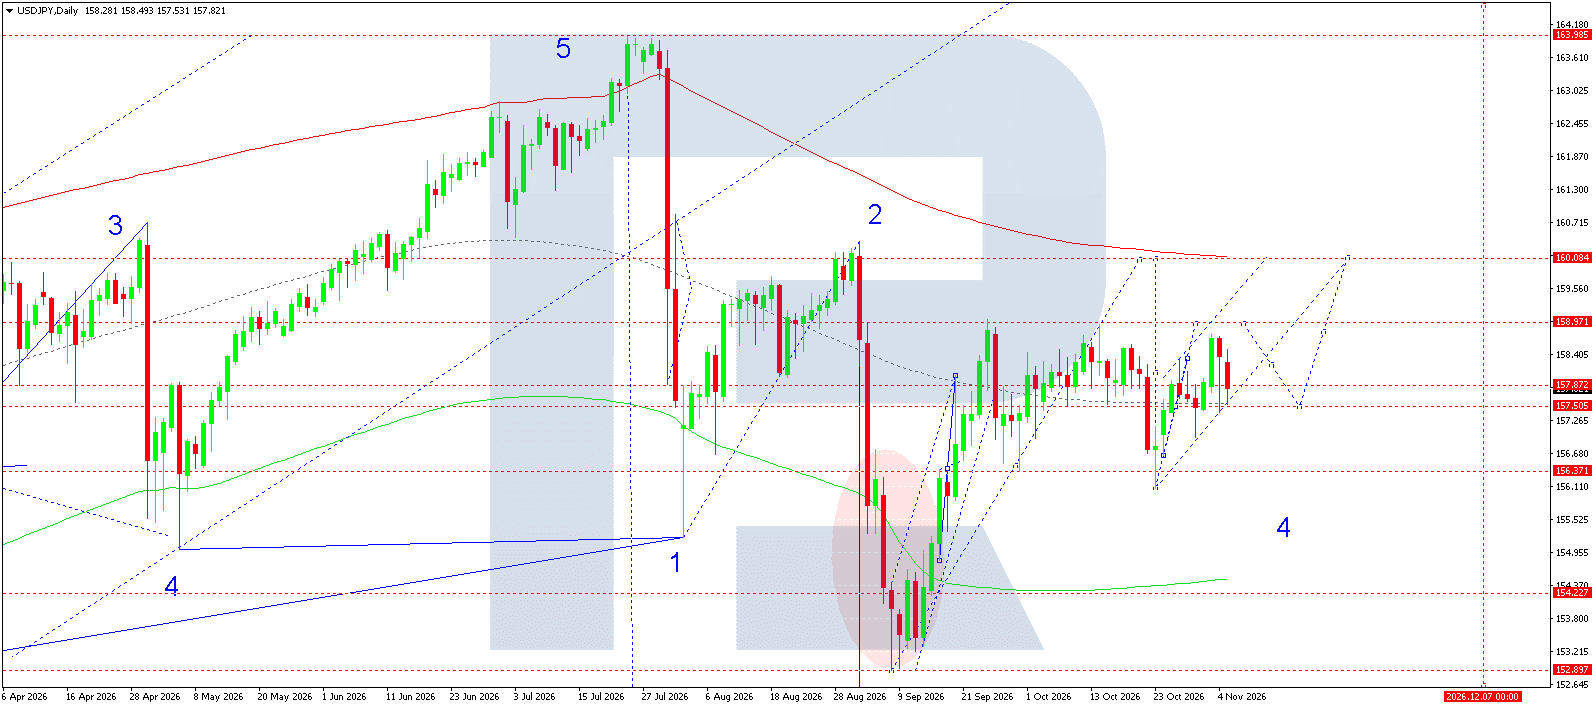
On the daily chart, USDJPY is trading near 157.82. Following the completion of the fifth wave around 163.99, the medium-term downward structure remains in place. Nevertheless, the recovery from September's low at 152.90 is developing within a local ascending channel and leaves room for the fourth corrective wave to continue.
The baseline scenario envisages support at 157.51 holding and growth resuming after a break above 157.87. The nearest target is at 158.97. Consolidation above this resistance would open the way towards 160.08, where the upper area of the marked forecast trajectories lies.
A loss of 157.51 would weaken buyers' position. A decisive break below the local channel would increase the likelihood of a decline towards 156.37. Buying is therefore considered conditionally, subject to confirmation of the recovery, while further targets would require a separate assessment of the price reaction.
USDJPY trade scenario
GBPUSD forecast
GBPUSD fundamental analysis
Sterling ends the week amid monetary tightening and uncertainty over energy prices. On 5 November, the Bank of England (BoE) raised its interest rate to 4%, responding to inflation risks linked to the conflict in the Middle East. The decision supports yields on UK assets, although the increase had already been anticipated by the market. Further GBPUSD movements will therefore depend on the outlook for the BoE's next steps and the resilience of the economy.
Rising energy costs both fuel inflation and restrict households' purchasing power. For sterling, this is a mixed combination: support from interest rates is accompanied by the risk of slowing domestic demand. In the coming week, attention will turn to US inflation and UK GDP. Strong US price figures could reinforce expectations of restrictive Federal Reserve (Fed) policy, supporting the dollar. Weaker inflation, by contrast, would create conditions for a recovery in the pair. Another factor is the US employment report expected on 6 November: its results could significantly alter market expectations ahead of the next trading week. Thus, the fundamental backdrop allows for a decline in GBPUSD but does not give that outcome an unequivocal advantage.
GBPUSD technical analysis
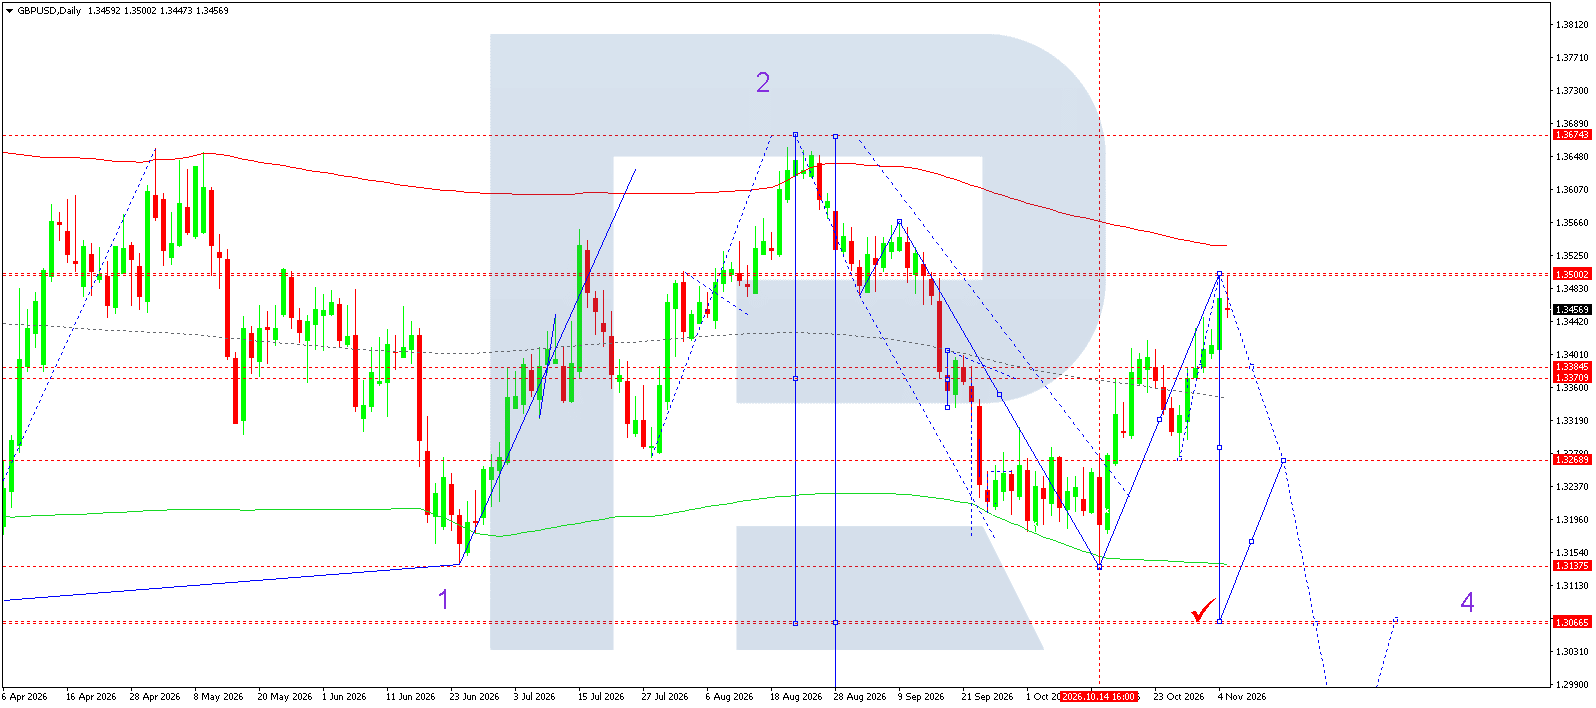
The daily chart retains the downward structure formed after the marked second wave ended near 1.3674. The subsequent decline reached 1.3138, from which a corrective recovery is developing. The return to 1.3500 has not yet invalidated the bearish scenario: the price remains below the August peak and the upper red boundary of the channel.
Provided resistance at 1.3500 holds, a resumption of the decline appears the preferred scenario. The nearest area in which sellers' strength will be tested lies between 1.3385 and 1.3371. A break below it would open the way towards 1.3269, the trade's first target. The wave count then allows for a return to 1.3138 and the development of a wave towards the main marked target at 1.3067. Reaching these more distant levels could take longer than a week. Consolidation above 1.3500 would weaken the selling scenario and require a reassessment of the wave count. Entry is planned five points below the current price after confirmation of a downward move.
GBPUSD trade scenario
AUDUSD forecast
AUDUSD fundamental analysis
The Australian dollar enters the new week amid conflicting factors. On 3 November, the Reserve Bank of Australia raised its interest rate by 25 basis points to 4.8500% in response to persistent inflation. However, the decision was passed by six votes to three, and the regulator also pointed to slowing economic growth, falling house prices, and rising unemployment. The rate increase therefore does not guarantee an appreciation of the AUD: further tightening could intensify pressure on domestic demand.
On 28 October, the US Federal Reserve kept its interest rate range at 3.7500–4.0000%, noting elevated inflation and resilient economic activity. This limits the case for expecting imminent easing and supports the dollar. The main events of the coming week will be the release of US consumer inflation on 10 November and producer prices on 13 November. Readings above expectations would strengthen the US currency, while slower inflation would create conditions for AUDUSD to recover. An additional risk stems from the conflict in the Middle East: expensive energy maintains inflationary pressure, while geopolitical uncertainty could undermine demand for the risk-sensitive Australian dollar.
AUDUSD technical analysis
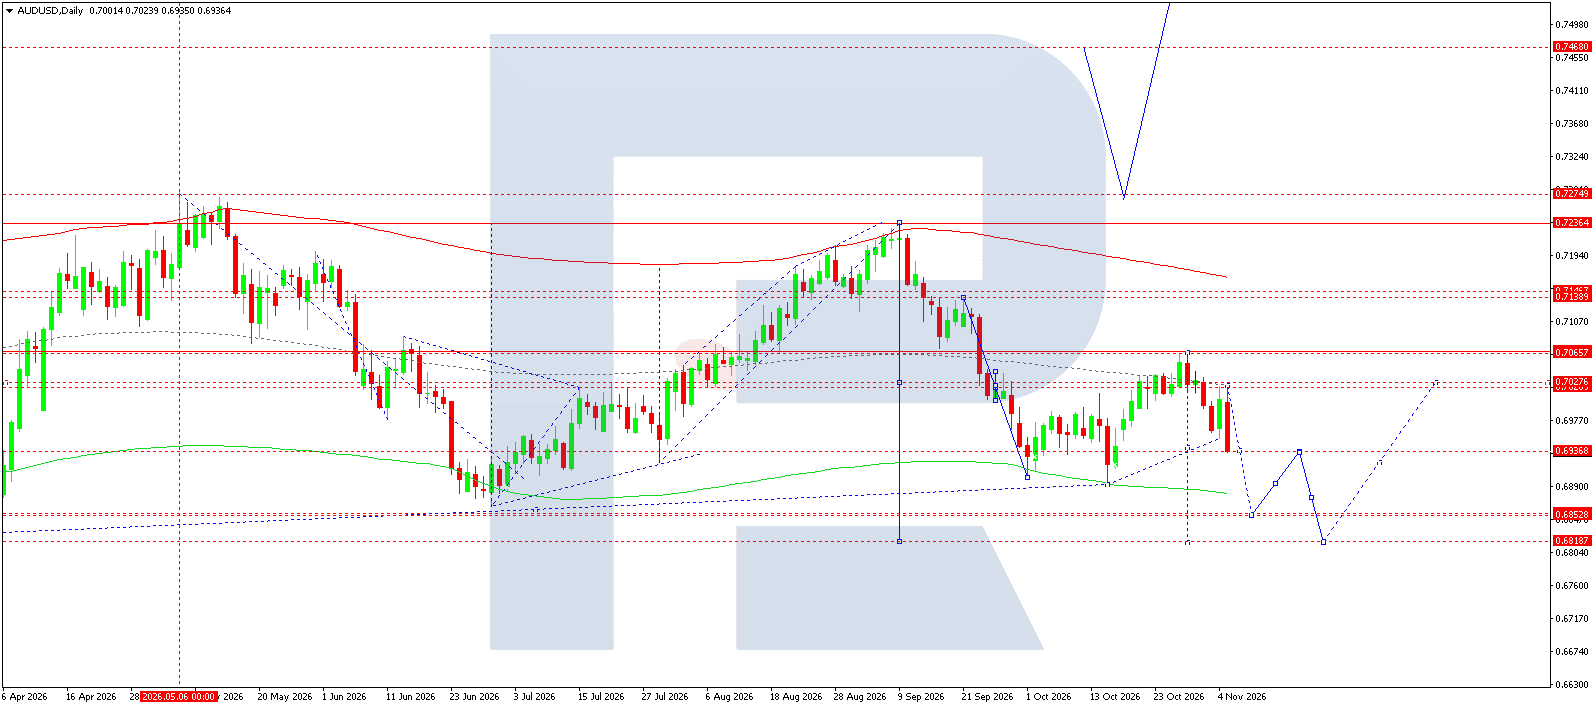
The daily chart is dominated by the downward structure formed after September's high. The October recovery ended below the previous peak, after which sellers pushed the price back to support at 0.6937. The latest quote in the supplied snapshot is 0.6936; the trading parameters are calculated relative to this level.
The baseline scenario envisages a further decline towards 0.6853, where the marked support area lies. The wave count then allows for a corrective rise towards 0.6937 and a renewed fall towards 0.6819. These are successive targets in the wave scenario, and reaching all of them within one week is not guaranteed. Once a base has formed, a broader correction towards 0.7021 is possible.
The nearest resistance area lies between 0.7021 and 0.7028. Consolidation above it would weaken the bearish scenario. Selling requires confirmation of pressure from sellers through a move below 0.6931. A tight protective stop limits the trade's risk but may be triggered before the broader downward structure develops.
AUDUSD trade scenario
USDCAD forecast
USDCAD fundamental analysis
USDCAD approaches the new week after declining from its October highs. The fundamental backdrop remains mixed: elevated interest rates support the US dollar, but monetary tightening in Canada limits the pair's recovery potential.
At its October meeting, the US Federal Reserve (Fed) kept interest rates unchanged, highlighting resilient economic activity and elevated inflation. This assessment calls for caution over easing policy. The key factor for the dollar next week will be the release of US consumer inflation on 10 November. A reading above expectations could support bond yields and demand for the USD, while weaker figures could increase pressure on the US currency. Producer price statistics on 13 November will provide an additional reference point.
The Bank of Canada (BoC) raised its interest rate in late October, citing the risk that higher energy prices could spill over into other goods and services. This supports the Canadian dollar. At the same time, US trade restrictions pose a threat of slowing the Canadian economy. The CAD's resilience will therefore depend on the interplay of inflation risks, economic activity, and oil prices. Fundamental conditions still allow for a corrective recovery in USDCAD but do not confirm a sustained upward reversal.
USDCAD technical analysis
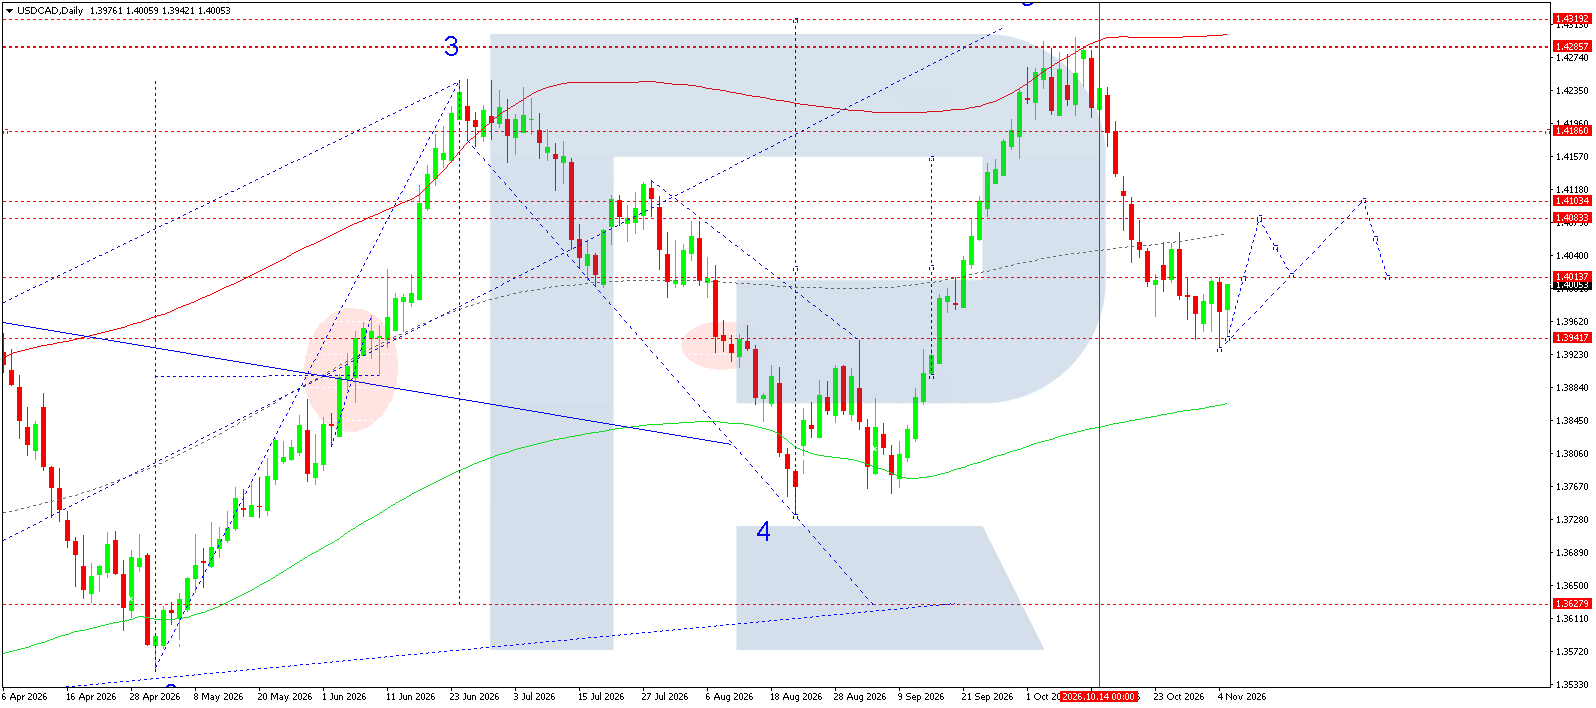
The daily chart is dominated by a local downtrend from the 1.4286 area. The latest decline reached support at 1.3942, where consolidation is forming. The current price on the supplied chart is 1.4005.
The wave count suggests the development of an upward corrective leg. The nearest obstacle is at 1.4014: consolidation above it would increase the likelihood of a move towards 1.4083. After an intermediate pullback, another rise towards 1.4103 is possible. These levels correspond to the forecast trajectory shown on the chart.
The main scenario envisages buying when growth resumes. A move below 1.3942 would invalidate expectations of a rebound and increase the likelihood of a continued decline. The deeper marked horizontal support lies at 1.3628. Buying is considered a trade on a correction within the prevailing local downward move.
USDCAD trade scenario
XAUUSD forecast
XAUUSD fundamental analysis
Gold enters the new week amid persistent inflationary pressure and uncertainty over US monetary policy. On 28 October, the US Federal Reserve (Fed) left interest rates unchanged, noting resilient economic activity and elevated inflation. Two voting members favoured an interest rate increase. For XAUUSD, this signal limits the recovery potential: the prospect of monetary tightening could support the dollar and bond yields, raising the opportunity cost of holding gold.
The main events of the week will be the release of US consumer inflation on 10 November and the Producer Price Index on 13 November. Readings above expectations would strengthen the case for a restrictive Fed policy and create conditions for pressure on the metal. Weaker figures, by contrast, could cause yields to fall and support buyers. Geopolitical uncertainty sustains demand for safe-haven assets, leaving the fundamental backdrop mixed. At the time of writing, the October US employment report had not yet been published; its results could also change the initial assessment of the dollar's outlook before the week begins.
XAUUSD technical analysis
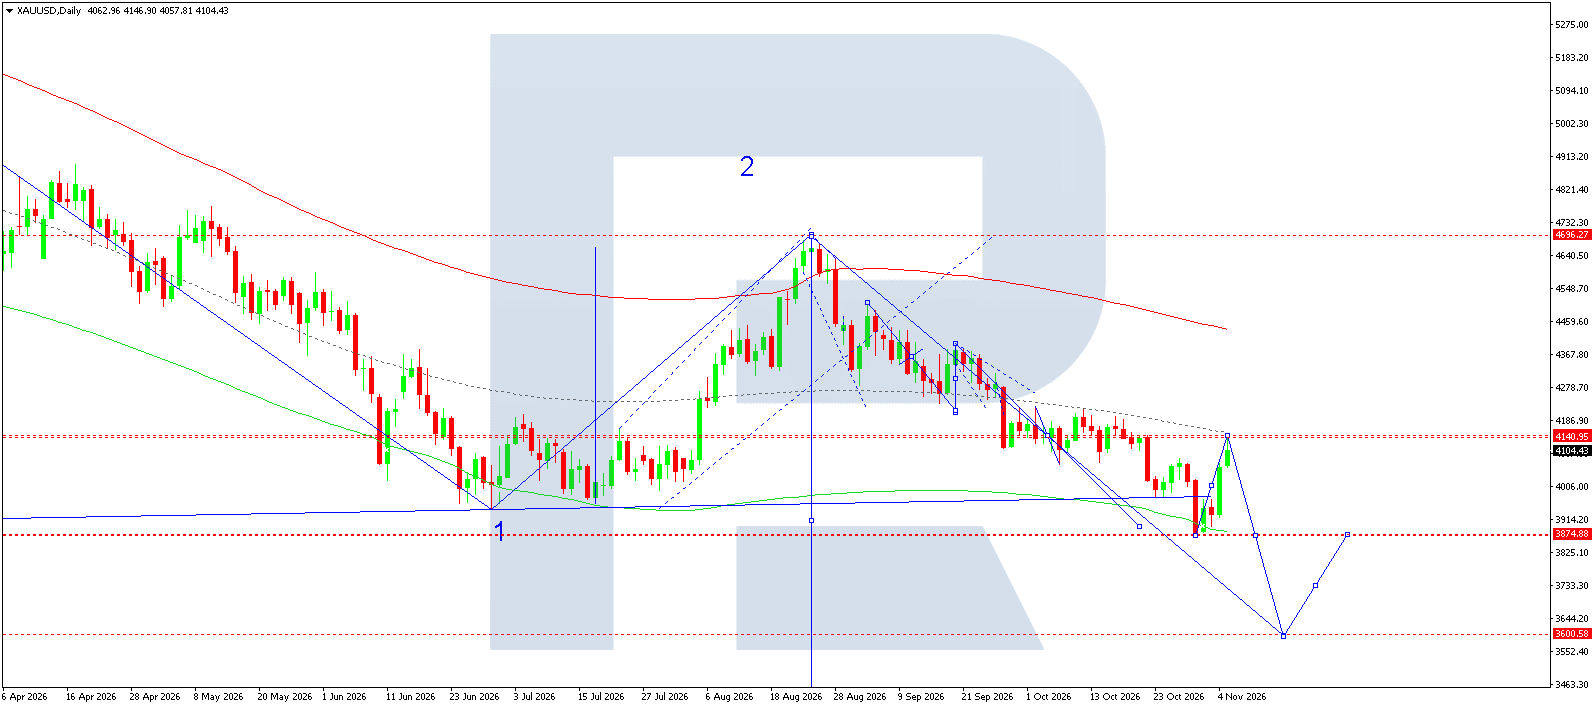
On the daily chart, a sequence of lower highs and lows remains in place following the completion of the marked second wave near 4,696. The decline reached support at 3,875, after which a rebound developed towards the 4,141 area. The chart's wave count suggests that the recovery is corrective, to be followed by a further decline. The latest price shown in the image is 4,104; this is a reference point from the supplied chart, not a confirmed current quote.
The baseline scenario envisages selling resuming below 4,141, with another test of 3,875. A decisive consolidation below this support would open the way towards 3,600, the next target within the structure, which may take longer than a week to reach. Consolidation above 4,141 would weaken the bearish scenario and require a reassessment of near-term expectations. Selling is considered only while pressure below resistance persists; until a break below support is confirmed, movement towards the more distant target remains a conditional forecast.
XAUUSD trade scenario
US 500 forecast
US 500 fundamental analysis
The US stock market enters the new week after a sharp sell-off in technology shares. On 5 November, the S&P 500 lost more than four per cent, with pressure concentrated in companies linked to artificial intelligence and the construction of data centres. Following the midterm elections, investors are reassessing the outlook for industry regulation and further infrastructure expansion. The heavy weighting of technology giants amplifies the impact of these concerns on the index.
At its October meeting, the US Federal Reserve kept interest rates unchanged, emphasising the resilience of the economy and elevated inflation. For equities, this means continued sensitivity to financing costs. Strong economic data could reinforce expectations of Fed tightening and constrain a recovery in share prices.
In the coming week, attention will turn to consumer inflation on 10 November and producer prices on 13 November. Accelerating readings would pose an additional risk to growth stocks. Slower inflation, by contrast, could support a recovery rebound. The employment report scheduled for 6 November had not yet been released at the time of writing. The assessment of the weekly outlook therefore remains preliminary and will need to be refined after the data are published.
US 500 technical analysis
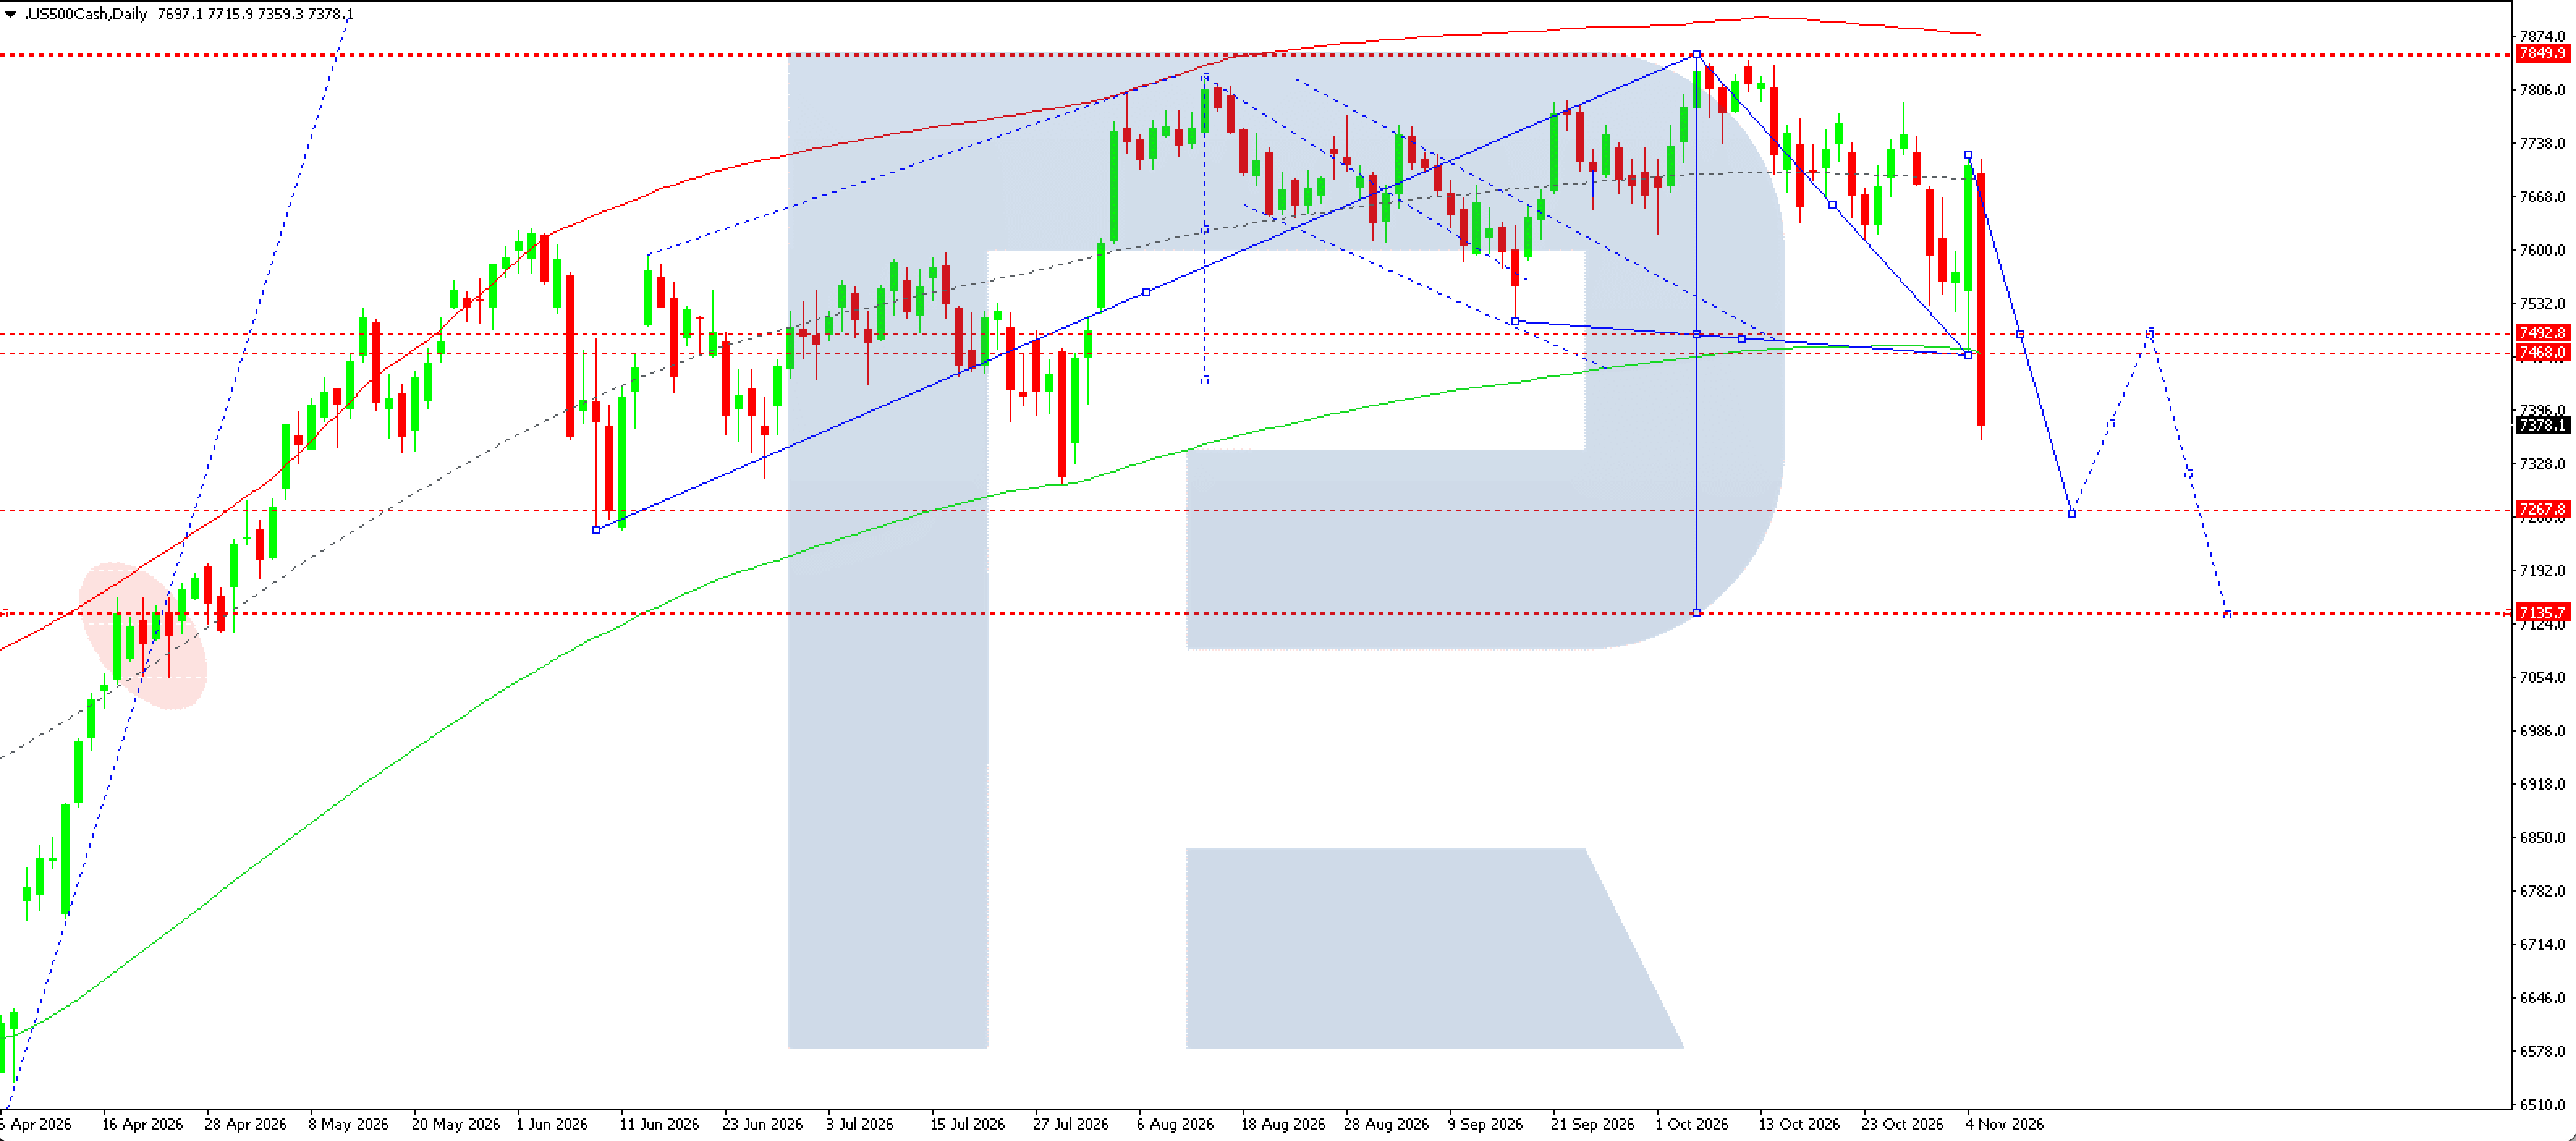
On the daily chart, US 500 is developing a downward correction following the completion of the upward move near 7,850. The latest strong bearish candlestick broke below the 7,468–7,493 area and the lower boundary of the ascending structure. This strengthens sellers' near-term advantage, although the preceding multi-month rally still allows the decline to be viewed as a correction within the larger trend.
According to the marked wave trajectory, the nearest target is around 7,268. Once it is reached, consolidation and a recovery towards 7,493 are possible. A subsequent resumption of the decline would open the way towards 7,136. This path remains a forecast hypothesis: consolidation above 7,493 would weaken the bearish scenario. Selling below the current price requires confirmation that the impulse is continuing; upon reaching the first support, it would be advisable to reassess sellers' strength.
US 500 trade scenario
BTCUSD forecast
BTCUSD fundamental analysis
Bitcoin enters the new week under pressure from deteriorating risk appetite. The sell-off in US technology shares on 5 November interrupted the recovery in cryptocurrencies after the US midterm elections. Concerns about returns on investment in artificial intelligence and the prospects for data-centre construction have made market participants more cautious. Liquidations of leveraged cryptocurrency positions exceeded one billion dollars, accelerating the decline in BTCUSD. This highlights Bitcoin's continued sensitivity to stock market sentiment.
Renewed institutional capital outflows are adding further pressure. According to data for 5 November, US spot Bitcoin ETFs recorded outflows of around 430 million dollars after a positive result in the previous session. It is therefore premature to speak of a sustained recovery in demand. In the coming week, key factors will be technology-sector performance and the direction of flows into cryptocurrency funds. Stabilisation in these indicators could support a rebound, whereas continued outflows would increase the likelihood of fresh local lows. The baseline fundamental assessment remains cautiously negative.
BTCUSD technical analysis
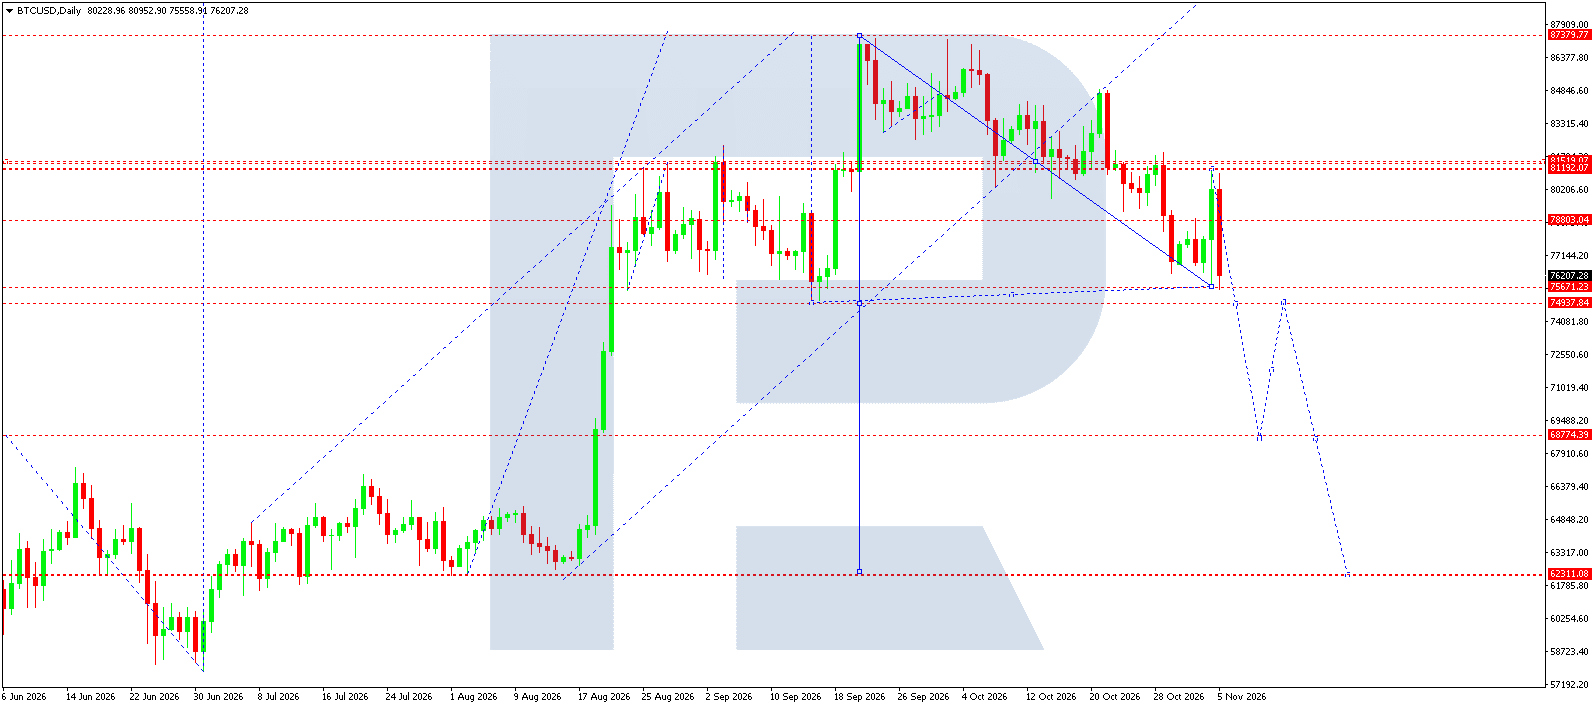
On the daily chart, a downward move from September's high near 87,400 predominates. A sequence of lower highs and the break out of the previous ascending channel confirm sellers' advantage. The latest rebound ended in a renewed decline, keeping the bearish scenario relevant.
The nearest support area lies between 75,671 and 74,938. Consolidation may form here early in the week. Consolidation below 74,938 would confirm the development of the next downward leg, with a local target at 68,774. According to the marked trajectory, a return towards the 75,000 area is possible after that target is reached, followed by a further decline towards 62,311. The latter is considered a subsequent target that could take longer than one week to reach.
A return above 78,803 would weaken the immediate bearish scenario. Consolidation above 81,102 would require a reassessment of the bearish outlook.
BTCUSD trade scenario
Weekly summary
During the week of 9–13 November, attention will focus on US inflation data: the Consumer Price Index is due on Tuesday, 10 November, and the Producer Price Index on Friday, 13 November. On Thursday, 12 November, the UK will release its first estimate of third-quarter GDP, an important reference point for GBPUSD. The week's main event will be the US CPI: a deviation from forecasts could change expectations for the Fed's interest rate and set the direction for the dollar, gold, US 500, and Bitcoin. Slower inflation could support expectations of monetary easing, while an acceleration would increase pressure on assets sensitive to high interest rates.
Editors' picks


EURUSD forecast 2026–2027: technical analysis, price levels & predictions
The EURUSD outlook for 2026 and 2027: key levels on the daily chart, three trading scenarios, and the policy gap between the Fed and the ECB that drives the pair.

Gold (XAUUSD) forecast 2026: technical analysis, price levels & predictions
Where gold could trade in 2026: key levels, three trading scenarios with entry triggers, and the forecasts from J.P. Morgan, Deutsche Bank, and Goldman Sachs.
Forecasts presented in this section only reflect the author’s private opinion and should not be considered as guidance for trading. RoboForex bears no responsibility for trading results based on trading recommendations described in these analytical reviews.