
Weekly Forex forecast for 16–20 November 2026: key levels for currencies, gold, US 500, and Bitcoin
The weekly forecast for 16–20 November 2026 includes six sell scenarios and two buy scenarios for eight instruments.
Table of Contents (H2)
Key levels for the week
| Instrument | Week | Support | Resistance | Scenario |
|---|---|---|---|---|
| EURUSD | −1.10% | 1.1004 | 1.1104 | Sell from 1.1104 |
| USDJPY | +1.02% | 159.29 | 160.40 | Buy from 159.29 |
| GBPUSD | −1.21% | 1.3200 | 1.3273 | Sell from 1.3300 |
| AUDUSD | −1.25% | 0.6757 | 0.6816 | Sell from 0.6803 |
| USDCAD | +1.45% | 1.4194 | 1.4582 | Buy from 1.4264 |
| XAUUSD | −4.41% | 3,824 | 3,907 | Sell from 3,862 |
| US 500 | +3.20% | 7,450 | 7,650 | Sell from 7,624 |
| BTCUSD | −8.99% | 68,263 | 70,000 | Sell from 71,606 |
What moves markets this week
During 16–20 November 2026, investors will focus on the state of the US economy and the outlook for Federal Reserve interest rates. Retail sales and industrial production figures are due on 17 November and will help assess the resilience of consumer demand and business activity.
The minutes of the Fed meeting on 18 November will provide another reference point. Signals about future policy could affect the dollar, gold, and stock indices.
In the UK, attention will turn to inflation on 18 November and retail sales on 20 November, which could change expectations for Bank of England interest rates and sterling's performance. The reaction of US bond yields to these releases could amplify Bitcoin's fluctuations, while investors' appetite for risk will depend on how closely the data match forecasts.
Events that can move markets this week
| Day | Event | Why it matters |
|---|---|---|
| Monday, 16 November | Japan: first estimate of Q3 GDP. China: October industrial production, retail sales, and investment. | This will indicate the resilience of economic growth. Strong figures could reinforce expectations of a Bank of Japan rate increase and support the yen; weak figures could have the opposite effect. An important test of domestic demand and industrial activity. Weak readings could weigh on Chinese equities, copper, and oil while strengthening expectations of economic stimulus. |
| Tuesday, 17 November | UK: labour market report, including unemployment and wages. US: October retail sales. NVIDIA: results for Q3 of fiscal year 2027 | Wage trends will help assess the persistence of inflationary pressure. Higher-than-expected growth could raise the expected path of Bank of England interest rates, support sterling, and lift bond yields. One of the week's main macroeconomic releases, indicating the strength of consumer demand. A strong result could support the dollar and bond yields; the impact on equities will depend on the balance between growth expectations and higher interest rates. The revenue outlook, margins, and comments on demand for AI infrastructure will be key. Deviations from expectations could provoke a strong reaction in NVIDIA, chipmakers, and the Nasdaq. |
| Wednesday, 18 November | UK: October consumer inflation (CPI). US: weekly EIA oil inventories report | Particular attention will be paid to core inflation and services prices. A reading above expectations could strengthen expectations of Bank of England tightening, support sterling, and put pressure on bonds. Unexpected changes in crude oil and fuel inventories, refinery utilisation, and implied demand could move WTI, Brent, and oil company shares. |
| Thursday, 19 November | US: weekly initial jobless claims | A sharp rise in claims could intensify concerns about the labour market and lower the expected path of Fed interest rates. The dollar, bonds, and equity indices could react. |
| Friday, 20 November | Japan: October consumer inflation (CPI). UK: October retail sales | The figures matter for expectations about the Bank of Japan's interest rate. Persistent core inflation could support the yen and raise Japanese bond yields; the reaction in equities will also depend on the outlook for corporate earnings. These figures will round off a busy week of UK data. Weak sales could heighten concerns about consumer demand and weigh on sterling and retailers' shares; strong figures could support assessments of economic resilience. |
EURUSD forecast
EURUSD fundamental analysis
The main theme in the currency market remains the reassessment of expectations for US interest rates. October inflation in the US exceeded forecasts, increasing the likelihood of a Federal Reserve (Fed) rate rise in December. Rising yields on short-term US bonds support the dollar and limit EURUSD's recovery. Statements from Fed officials suggesting more decisive measures against persistent price pressures are also putting additional pressure on the pair.
The European Central Bank (ECB) also remains prepared to combat inflation, but the prospects for prolonged monetary tightening appear less convincing. The caution shown by some ECB officials contrasts with the rhetoric in the US. This combination of factors could allow the dollar to retain its advantage in the coming week.
Lower oil prices amid expectations of easing tensions in the Middle East have somewhat reduced inflation risks. However, strains in the European gas market ahead of winter limit the positive effect on the eurozone economy. The main risk for EURUSD sellers is a weakening of expectations for a Fed rate increase: this could trigger profit-taking on the dollar and a corrective rise in the pair.
EURUSD technical analysis
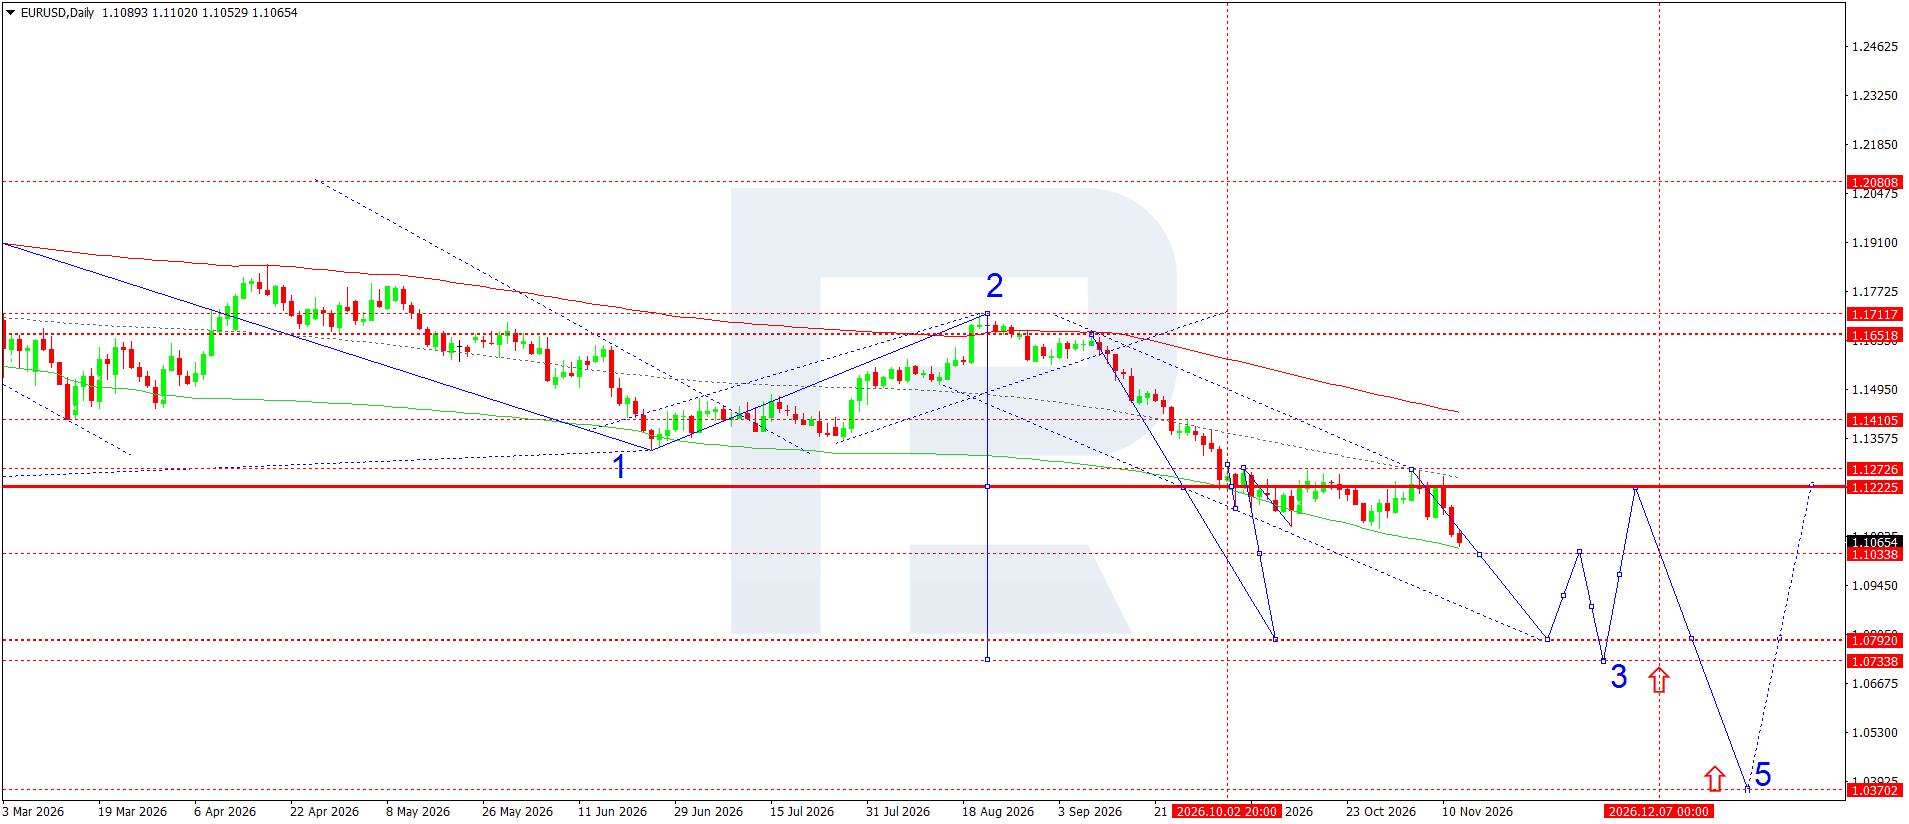
The downtrend remains intact on the daily chart. After the completion of the second wave near 1.1712, a decline is developing within the third wave. The price is below the sloping trendlines and the broken horizontal level at 1.1223, confirming sellers' advantage. The latest quote shown on the supplied chart is 1.1065, which is used as the reference price for the scenario.
The nearest support is at 1.1034. A decisive break below it would open the way towards 1.0792 and then the calculated third-wave target at 1.0734. Reaching the more distant target within one week is not essential: the wave count allows for interim rebounds. A more distant fifth-wave target lies near 1.0370.
The baseline scenario envisages a further decline as long as the price remains below 1.1223. A return above this resistance would weaken the bearish structure and require the forecast to be revised. A sell order is planned after an additional five-point decline from the reference quote.
EURUSD trade scenario
The main scenario still envisages further declines with limited upward corrections. If the third wave develops, the next potential target will be the 1.0370 area. Selling remains the priority.
USDJPY forecast
USDJPY fundamental analysis
As the week draws to a close, the dollar is set to retain its advantage over the yen thanks to a reassessment of expectations for US monetary policy. The US Federal Reserve (Fed) has again moved into focus: strong inflation data and hawkish comments from officials have strengthened expectations of further rate increases. Rising US bond yields underpin the appeal of dollar-denominated assets, creating fundamental conditions for USDJPY to continue rising.
The Bank of Japan (BoJ), by contrast, faces the need to balance policy normalisation with a cautious assessment of the economy. Accelerating wholesale inflation strengthens the case for another rate increase, but expectations of BoJ action currently carry less weight than the US interest rate advantage.
At the same time, prices approaching 160.00 make the market more sensitive to statements from Japanese authorities. Warnings of possible intervention limit the scope for an uninterrupted rise. In the coming week, the main drivers will remain yield movements, Fed commentary, and signals from Tokyo. Continued hawkish US rhetoric would support buyers, while growing intervention risks could trigger sharp profit-taking.
USDJPY technical analysis
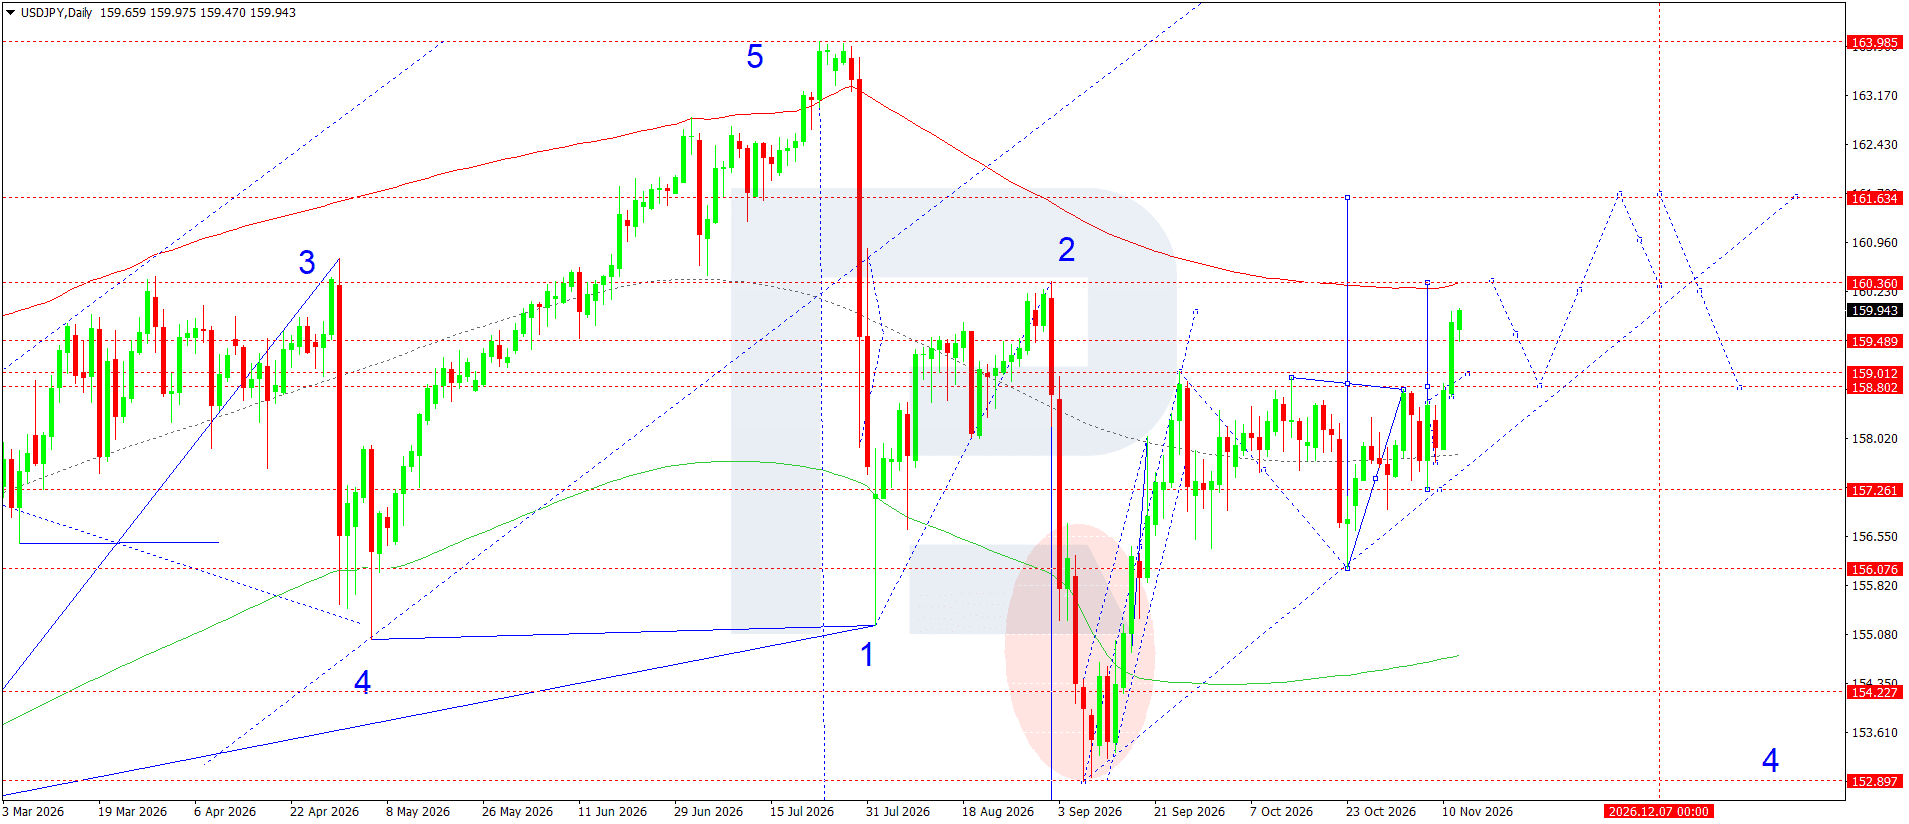
An upward recovery from September's low is developing on the daily chart. A succession of higher local lows and a move above the 158.80–159.01 area confirm buyers' advantage. However, within the broader wave structure, the rise should still be viewed as a recovery phase following the completion of the fifth wave near the summer highs.
The price has approached resistance at 160.36, which coincides with the area of the previous high and the descending red line. The main scenario envisages a test of this barrier. Sustained consolidation above it would open the way towards 161.63. An interim pullback is possible, but a return below 159.49 would weaken the upward momentum and increase the likelihood of a test of 159.01.
Buying remains the priority, subject to confirmation that the move is continuing. Entry above the current level allows traders to await additional momentum, but resistance at 160.36 will require particular attention. The 161.63 target is relevant if that resistance is overcome; reaching it during the week is not guaranteed.
USDJPY trade scenario
GBPUSD forecast
GBPUSD fundamental analysis
Sterling enters the new week under pressure from a strengthening dollar. The main theme in the market remains the reassessment of expectations for US Federal Reserve (Fed) policy. Accelerating US inflation and hawkish statements from officials have strengthened expectations of rate increases. Rising US bond yields support the dollar's appeal and limit sterling's recovery even after favourable UK economic data.
At its November meeting, the Bank of England raised its interest rate to 4.0000%, with eight members supporting a quarter-percentage-point increase. The regulator points to the risk that high energy costs will feed through into consumer prices and wages. This leaves scope for further monetary tightening and provides fundamental support for sterling.
UK GDP grew by 0.7000% quarter-on-quarter in the third quarter. However, the release failed to deliver sustained sterling strength as market participants focused on the outlook for US interest rates. In the coming week, inflation expectations, central bank officials' comments, and energy price movements will remain decisive. Weaker expectations of Fed tightening could trigger a corrective rebound in the pair; the prevailing sentiment favours sellers. Geopolitical uncertainty heightens the currency market's sensitivity to unexpected news.
GBPUSD technical analysis
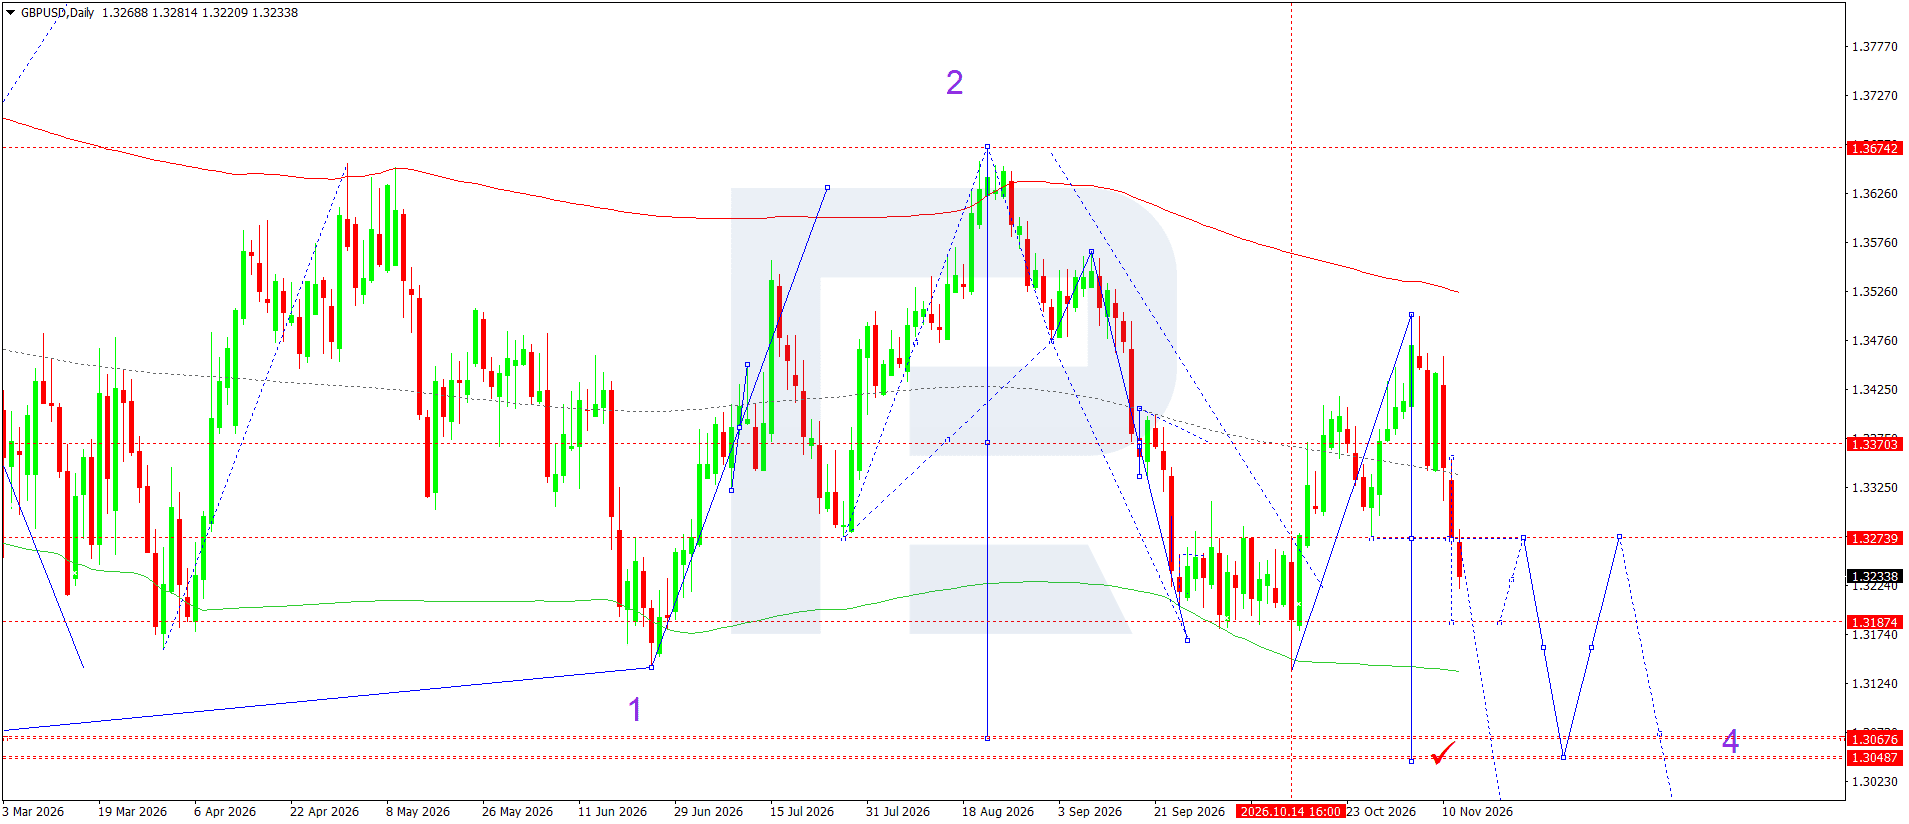
The downward structure remains in place on the daily chart following the reversal from the August high. The latest rise towards 1.3500 ended in a decline: the price returned below 1.3370 and broke through 1.3274. These levels now serve as the nearest resistance levels.
The main scenario envisages a further decline towards 1.3187. Consolidation below this support would open the way towards the 1.3068–1.3049 area, marked by the wave count as a potential zone for the completion of the downward leg. Reaching the more distant target could take longer than a week.
A return towards 1.3274 is possible before the decline continues. As long as daily closes remain below this level, rebounds are corrective. Consolidation above 1.3370 would invalidate the current sell scenario. The nearest support has been chosen for the weekly trade because consolidation could delay progress towards the deeper targets.
GBPUSD trade scenario
AUDUSD forecast
AUDUSD fundamental analysis
The Australian dollar ends the week under pressure from a stronger US currency and a reassessment of interest rate expectations. Higher-than-expected US inflation in October and hawkish statements from Federal Reserve (Fed) officials have increased the likelihood of further monetary tightening. Rising US bond yields support the dollar while reducing the appeal of riskier assets. Declining stock indices further undermine the conditions for an AUDUSD recovery.
The Reserve Bank of Australia (RBA) raised its interest rate in November, although the domestic economic backdrop remains mixed. Persistent inflation requires restrictive financial conditions, while a weaker housing market and rising unemployment limit the scope for further increases. For the Australian currency, this means continued interest rate support without a guarantee of sustained appreciation. In the coming week, attention should turn to signals from the RBA about future policy. More hawkish rhetoric could trigger a corrective strengthening in AUDUSD, although sustained demand for the dollar would hinder a reversal. The main risk to the bearish scenario would be easing expectations for Fed policy and a recovery in global risk appetite.
AUDUSD technical analysis
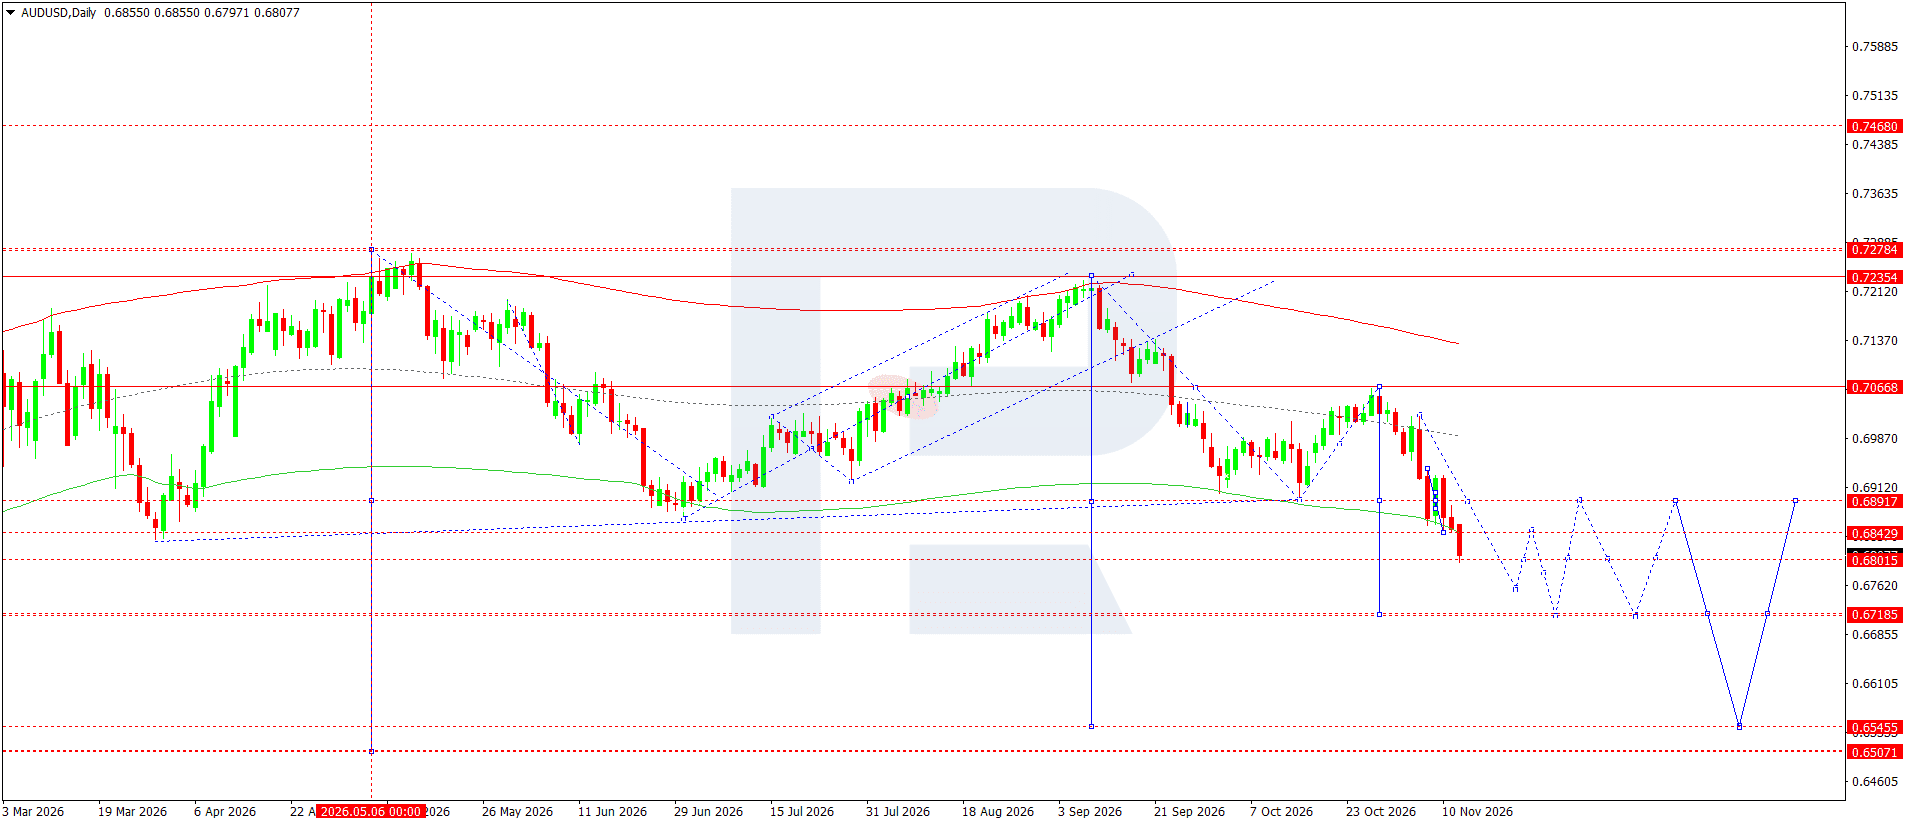
The downtrend dominates the daily chart: a series of lower highs has formed since September's peak, and the October recovery ended in a fresh selling impulse. The price fell below the 0.6892–0.6843 area and approached support at 0.6802. Its position below the moving averages confirms sellers' advantage.
The main scenario envisages a further decline following a break below 0.6802, with the nearest target at 0.6719. This area corresponds to the local target of the marked wave projection. Once it is reached, a corrective return towards 0.6892 is possible.
The deeper target at 0.6546 belongs to a subsequent stage of the move and is not regarded as a required outcome for the week. A return above 0.6843 would weaken the immediate bearish impulse. Entry is best considered after a confirmed consolidation below support.
AUDUSD trade scenario
USDCAD forecast
USDCAD fundamental analysis
The US dollar retains fundamental support amid persistent inflationary pressure. October's rise in US consumer prices confirms that returning inflation to target remains challenging. For the US Federal Reserve (Fed), this argues for maintaining restrictive monetary conditions. Expectations of further tightening could support US bond yields and demand for the dollar, although they do not in themselves guarantee that USDCAD will continue to rise.
The Bank of Canada raised its interest rate in late October in response to a deteriorating inflation outlook. However, the employment report published on 6 November showed virtually unchanged employment and rising unemployment. This combination limits the BoC's ability to act aggressively and makes the Canadian currency sensitive to upcoming releases. Canadian inflation will be a key focus in the coming week: stronger price pressures would support expectations of a rate rise and the CAD, while weaker figures would favour USDCAD buyers.
Oil is another factor. High energy prices support Canada's export revenues while also heightening inflation risks. The oil market's influence must therefore be assessed alongside interest rate expectations and overall demand for safe-haven assets.
USDCAD technical analysis
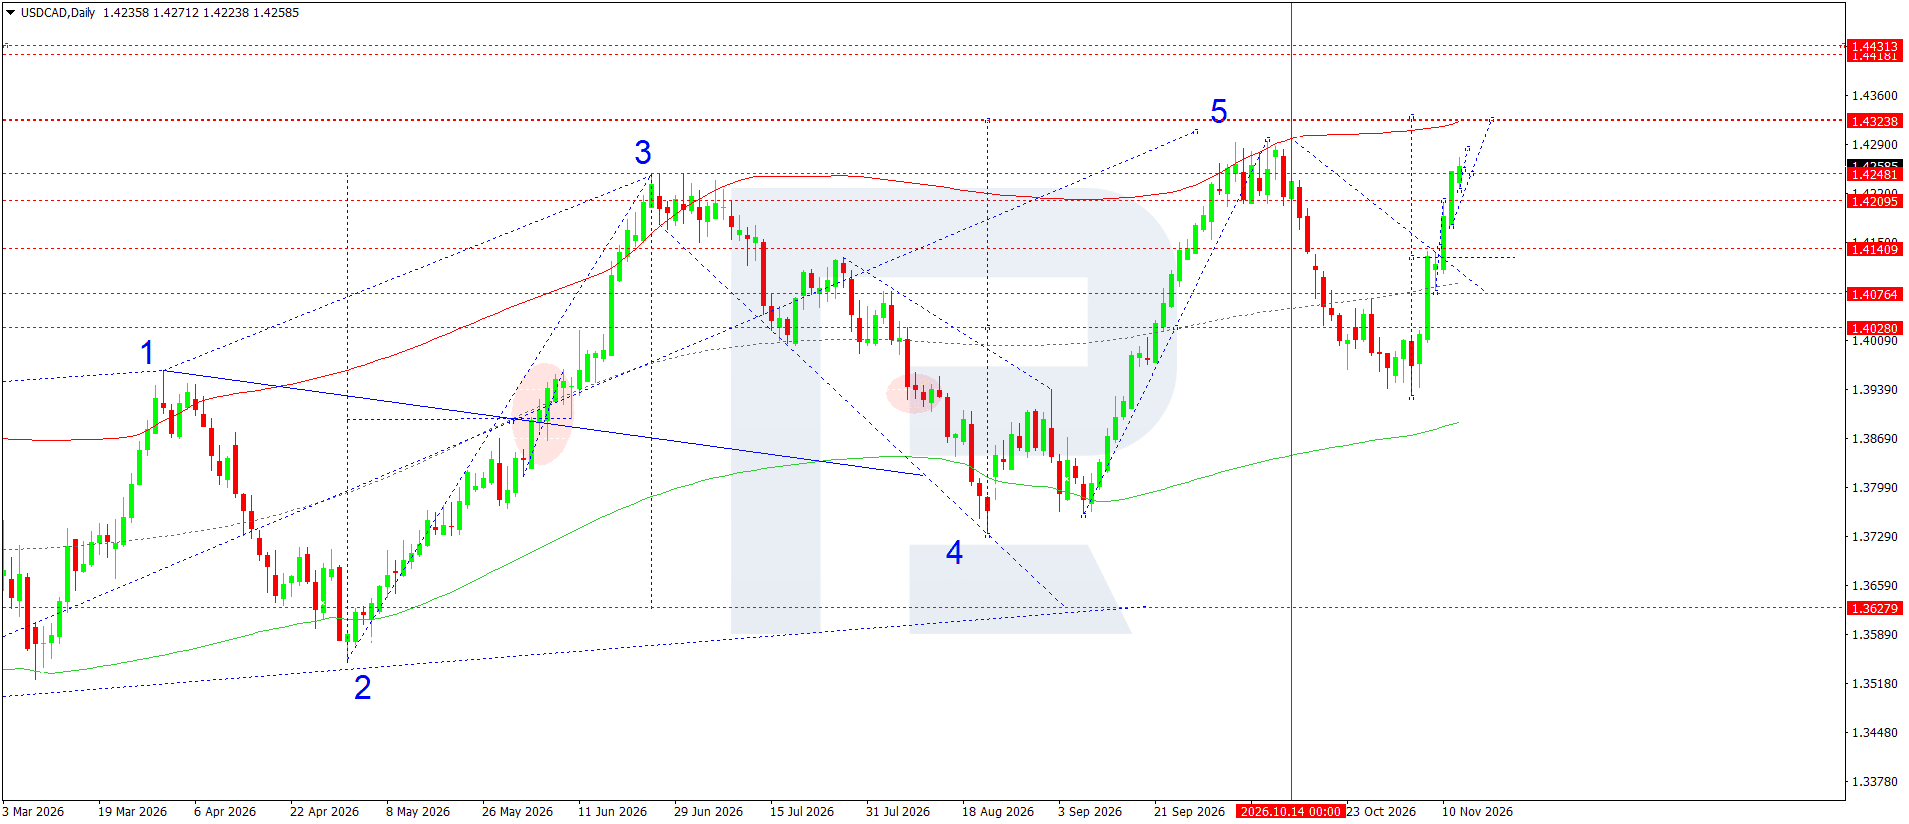
The pair has recovered from a correction on the daily chart and risen above 1.4209 and 1.4248. The latest candle's quote is 1.4259 after rounding. The current move is predominantly upward: the price is above the long-term moving average, and the latest candles show accelerating buying activity.
The wave count identifies a five-wave structure, with the fifth wave around the October high. The current recovery could retest that high, although an extension of the fifth wave would require confirmation through a breakout above the peak. The nearest calculated target is at 1.4324; consolidation above it would open the way towards 1.4418. Reaching the more distant target within the week is not guaranteed.
The baseline scenario envisages buying if the rise continues. A return below 1.4209 would weaken the upward momentum and increase the likelihood of a decline towards 1.4141. The stop is placed below the first support; entry above the current price requires confirmation that the move is continuing.
USDCAD trade scenario
XAUUSD forecast
XAUUSD fundamental analysis
Gold enters the new week under pressure from inflation risks and expectations of further US monetary tightening. Higher-than-forecast inflation has heightened concerns that the US Federal Reserve (Fed) will continue raising interest rates. This is an unfavourable backdrop for XAUUSD: a stronger dollar makes the metal less affordable for buyers using other currencies, while high bond yields increase the appeal of interest-bearing instruments.
Another factor is rising oil prices amid fading hopes of a resolution to the situation in the Middle East. Geopolitical tensions could sustain safe-haven demand for gold, but their inflationary consequences also strengthen expectations of a prolonged period of high interest rates. Under current conditions, this transmission channel limits a recovery in prices. Reports published on 13 November point to an attempted rebound following the decline, but continued pressure from monetary policy expectations does not yet justify confidence in a reversal. In the coming week, market participants will focus on US economic data and comments from Fed officials.
XAUUSD technical analysis
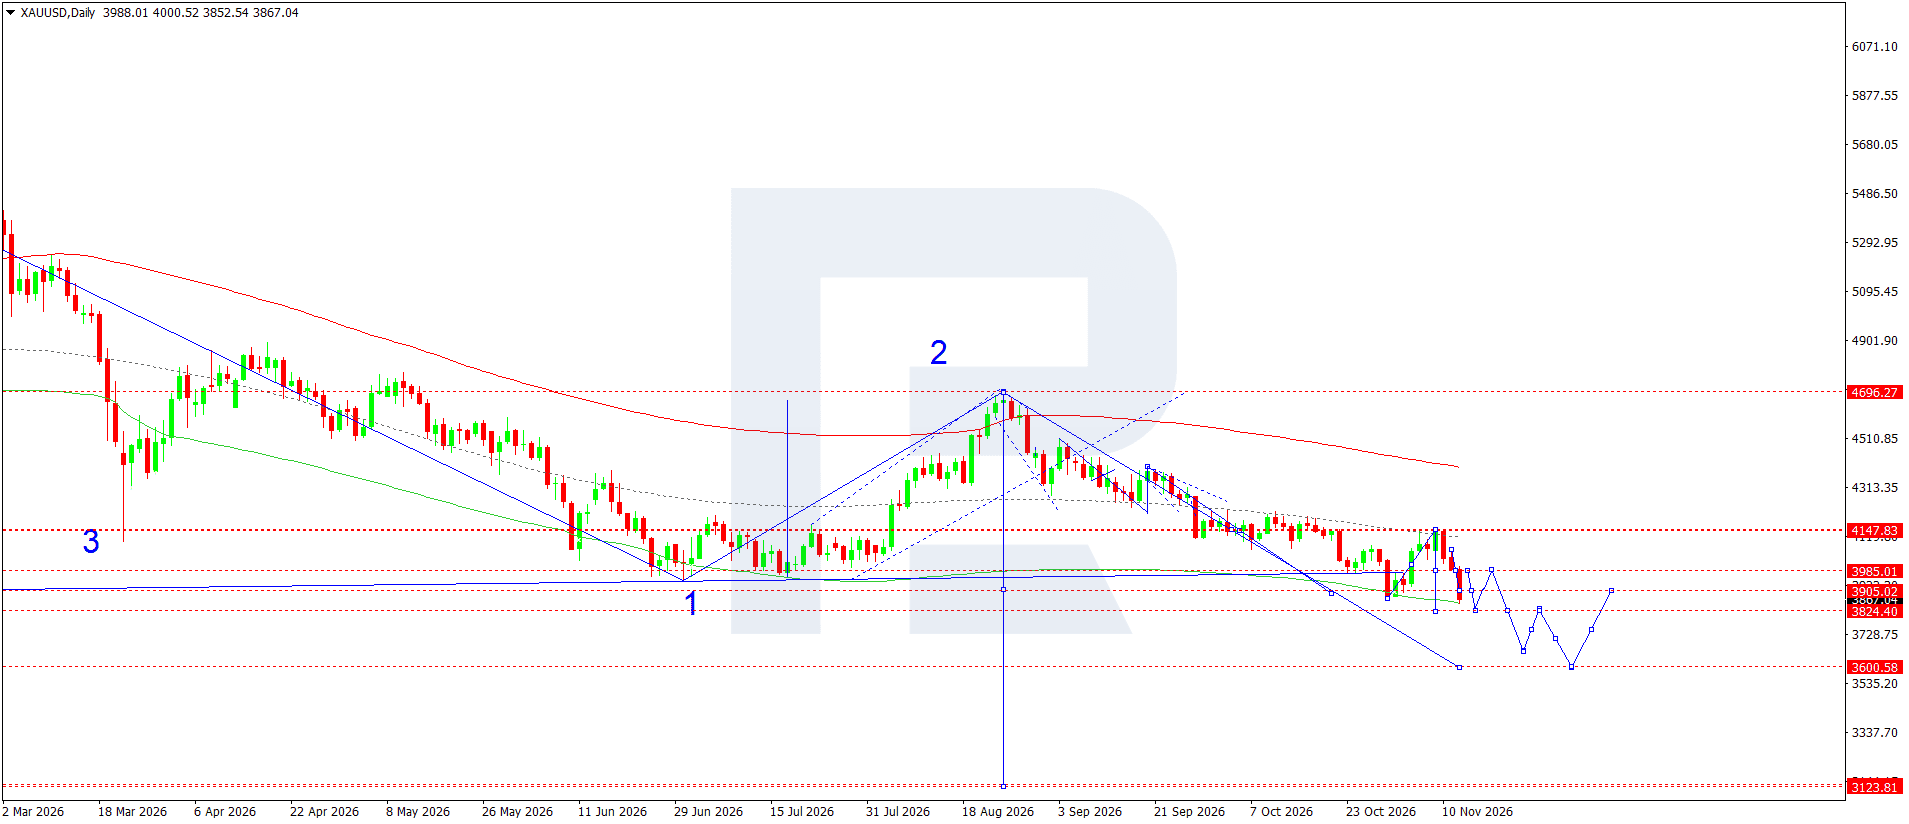
The downward structure remains intact on the supplied XAUUSD daily chart. After the completion of corrective wave 2 near 4,696, a sequence of lower highs followed. The latest rise towards 4,148 ended with renewed selling, and the price returned below 3,985 and 3,905. The slope of the main moving averages confirms sellers' advantage.
The nearest resistance is at 3,905, with the next barrier at 3,985. As long as prices remain below these levels, any recovery is viewed as a correction within the main decline. A break below support at 3,824 would open the way towards 3,601. The wave count allows for interim rebounds, so reaching the lower target does not imply an uninterrupted move. The 3,124 level remains a more distant structural target beyond the baseline weekly scenario.
Selling is preferable if the decline continues towards 3,862. A return above 3,985 would weaken the bearish scenario.
XAUUSD trade scenario
US 500 forecast
US 500 fundamental analysis
The US stock market enters the new week amid persistent inflation risks and heightened sensitivity to the monetary policy outlook. October's consumer price figures exceeded expectations, increasing the likelihood of a further rate rise by the US Federal Reserve (Fed). For equities, this means higher financing costs and pressure on company valuations, particularly in the technology sector.
In the coming days, market participants will focus on corporate earnings, especially Nvidia's results, as well as US industrial production figures. Investors will need to assess the resilience of demand for artificial intelligence infrastructure and companies' ability to maintain profitability amid high interest rates. Strong results could support an index recovery, while cautious corporate forecasts could trigger renewed selling.
Bond yield movements will remain another important reference point. Rising government bond yields reduce the appeal of equities relative to debt instruments. At the same time, resilient consumer demand and sustained investment activity could partly offset the adverse effects of expensive borrowing. Thus, the fundamental backdrop points to increased volatility, while a sustained recovery will require confirmation from corporate results.
US 500 technical analysis
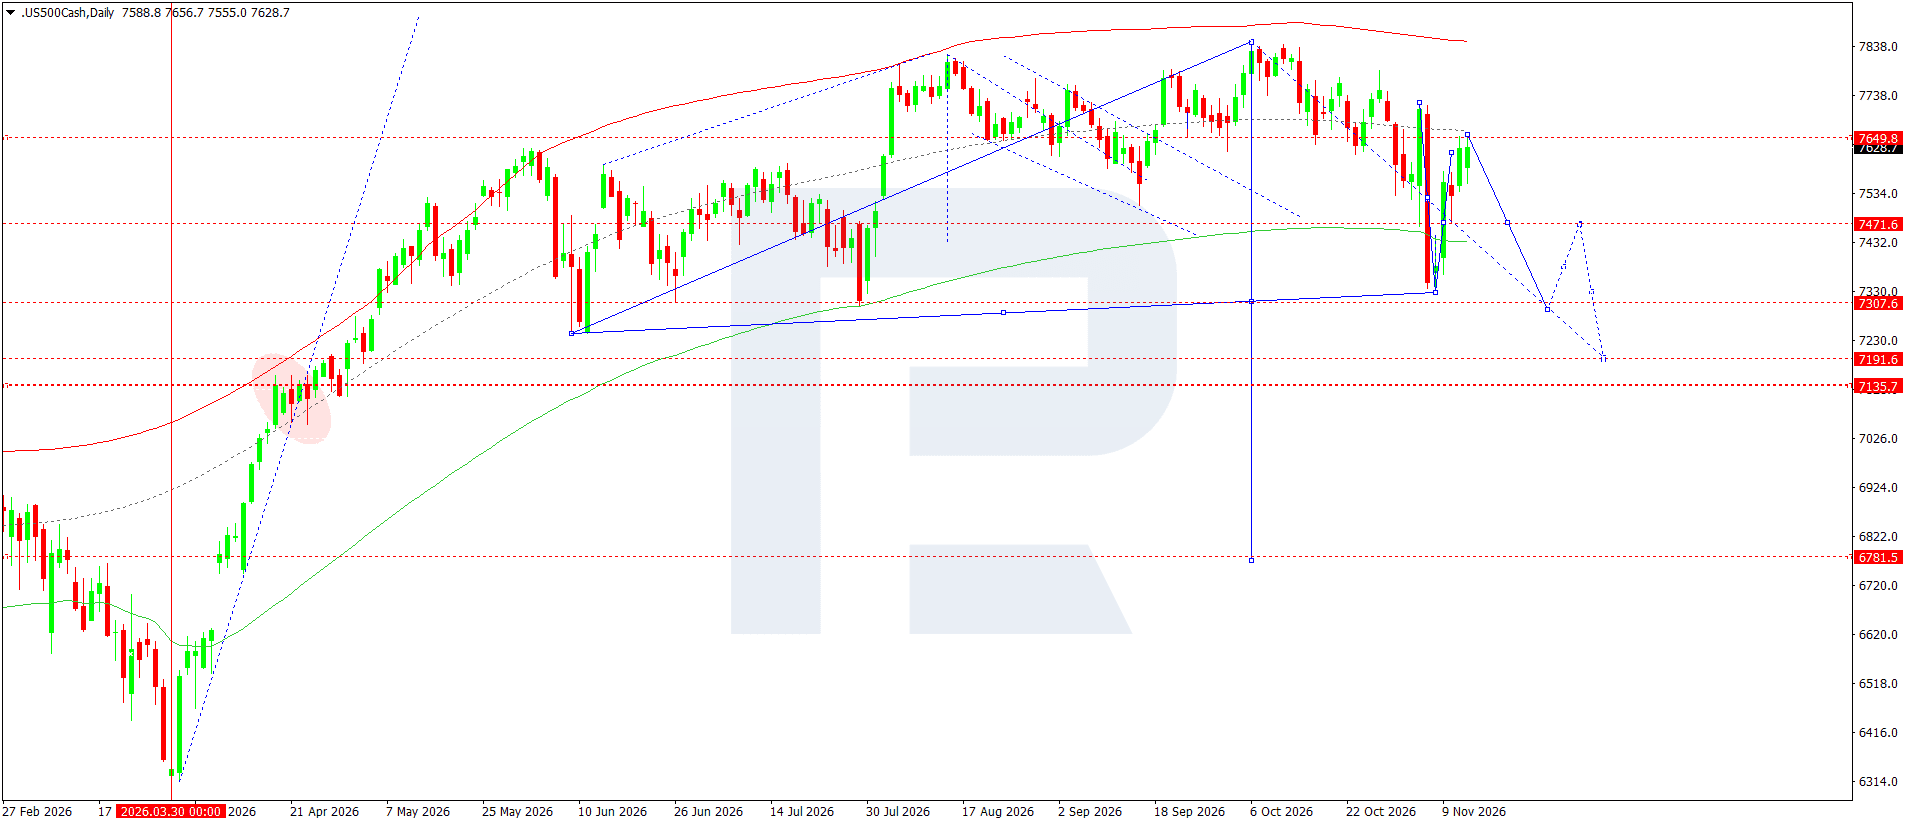
On the daily chart, the long-term rise has given way to a corrective decline. Since October's high, a sequence of lower highs has formed, and the latest rebound took prices back towards resistance at 7,650. The price shown on the supplied chart is around 7,629; the recovery is still viewed as a correction within the local downward structure.
The main scenario envisages the rebound ending below resistance, followed by a move towards 7,472. Consolidation below this level would open the way towards 7,308, where the lower boundary of the marked structure lies. If it breaks, the next target will be 7,192. The wave trajectory shown allows for an interim recovery before the decline continues.
A sustained move above 7,650 would weaken the bearish scenario and increase the likelihood of a return towards 7,738. Selling is therefore best considered once a downward reversal is confirmed; the protective stop order is placed above the nearest resistance.
US 500 trade scenario
BTCUSD forecast
BTCUSD fundamental analysis
Bitcoin ends the week under pressure from expectations of tighter US monetary policy. The Federal Reserve (Fed) remains focused on persistent inflation. In a speech on 10 November, Christopher Waller indicated that he was prepared to support a rate rise in December and allowed for more decisive action if the data deteriorated. For BTCUSD, this implies a risk of persistently expensive financing and constrained demand for speculative assets.
The published US consumer price figures have heightened concerns about how long inflationary pressure could persist. Rising borrowing costs increase the appeal of interest-bearing instruments and complicate a cryptocurrency recovery. Meanwhile, outflows from Bitcoin exchange-traded funds weaken institutional support for the market. Under these conditions, recovery attempts could be met with selling from participants reducing risk exposure.
Reports on 13 November of Bitcoin falling below 69,000 show that the market has already moved beyond the levels depicted in the supplied chart. The trading parameters below therefore refer to the technical structure shown in that image: entry should only be considered if prices return to the specified area and sellers' reaction is confirmed. Elevated volatility calls for allowance for sharp corrective moves.
BTCUSD technical analysis
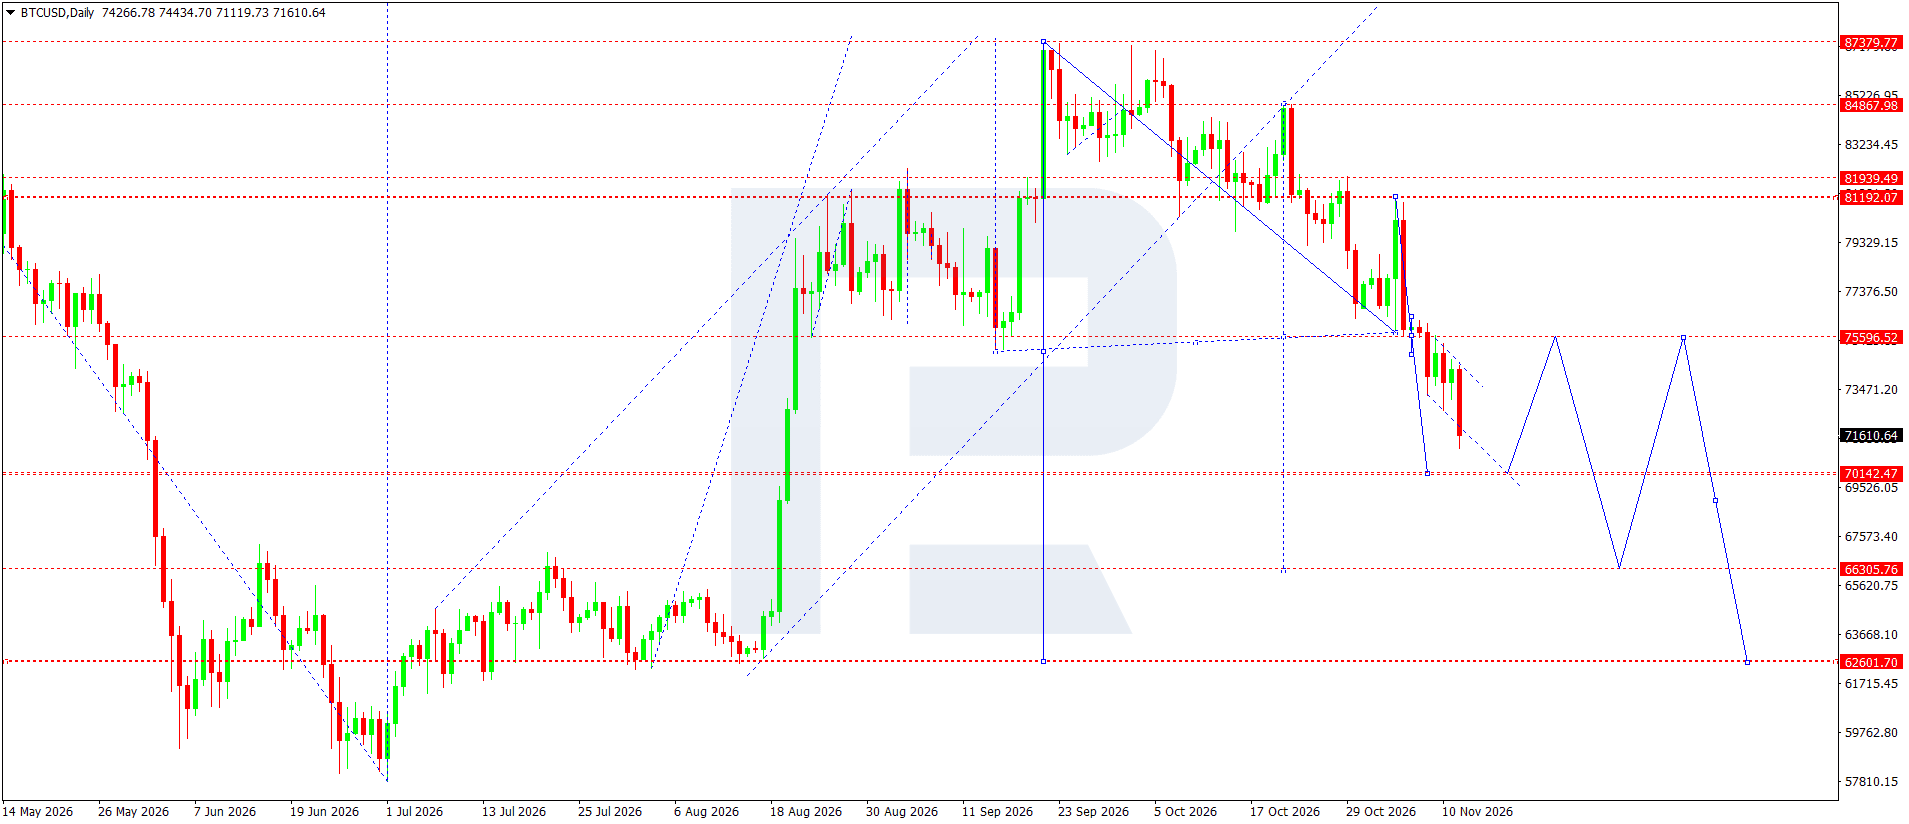
The downtrend dominates the daily chart. A sequence of lower highs has formed since September's peak, and the break below the 75,597 area confirmed sellers' advantage. The latest displayed price is 71,611.
The nearest support is at 70,142. According to the marked trajectory, a test of this level could be followed by a corrective rise towards 75,597. Such a rebound would nevertheless remain part of the bearish structure as long as the market stays below that boundary. The next local downside target is 66,306, with an extended target at 62,602.
The main scenario envisages selling after a return to the entry area and the formation of a reversal signal. Consolidation above 75,597 would weaken the bearish forecast and increase the likelihood of a recovery towards 81,192. The stated trajectory is a scenario, not a confirmed sequence of future waves. Reaching the more distant target could take longer than one week.
BTCUSD trade scenario
Weekly summary
During the week of 16–20 November, attention will focus on US economic data: October retail sales and industrial production are due on Tuesday, 17 November, providing important indicators of consumer demand and business activity. Census Bureau calendar, Fed calendar. On Wednesday, 18 November, the UK will release October inflation data, which could influence expectations for Bank of England interest rates and GBPUSD movements.
One of the week's key events will be the US retail sales report. A possible market scenario is that strong figures could support the dollar and reduce expectations of Fed easing, putting pressure on gold and interest rate-sensitive assets. Weak readings could increase expectations of a rate cut, although the reaction of US 500 and Bitcoin would also depend on the severity of concerns about slowing economic growth.
Editors' picks


EURUSD forecast 2026–2027: technical analysis, price levels & predictions
The EURUSD outlook for 2026 and 2027: key levels on the daily chart, three trading scenarios, and the policy gap between the Fed and the ECB that drives the pair.

Gold (XAUUSD) forecast 2026: technical analysis, price levels & predictions
Where gold could trade in 2026: key levels, three trading scenarios with entry triggers, and the forecasts from J.P. Morgan, Deutsche Bank, and Goldman Sachs.
Forecasts presented in this section only reflect the author’s private opinion and should not be considered as guidance for trading. RoboForex bears no responsibility for trading results based on trading recommendations described in these analytical reviews.