
Weekly Forex forecast for 23–27 November 2026: key levels for currencies, gold, US 500, and Bitcoin
The weekly forecast for 23–27 November 2026 includes five sell scenarios and three buy scenarios for eight instruments.
Table of Contents (H2)
Key levels for the week
| Instrument | Week | Support | Resistance | Scenario |
|---|---|---|---|---|
| EURUSD | −0.5% | 1.0953 | 1.1011 | Sell from 1.0981 |
| USDJPY | +0.01% | 158.87 | 159.98 | Buy from 159.25 |
| GBPUSD | −1.01% | 1.3079 | 1.3177 | Sell from 1.3111 |
| AUDUSD | −1.7% | 0.6646 | 0.6722 | Sell from 0.6674 |
| USDCAD | +0.5% | 1.4287 | 1.4358 | Buy from 1.4327 |
| XAUUSD | −6.6% | 3,515 | 3,627 | Sell from 3,547 |
| US 500 | −5.1% | 7,174 | 7,416 | Sell from 7,302 |
| BTCUSD | −9.3% | 61,250 | 64,020 | Buy from 62,975 |
What moves markets this week
During 23–27 November 2026, investors will focus on October US PCE inflation and its implications for Federal Reserve interest rate expectations. On Monday, 23 November, preliminary Purchasing Managers' Indices (PMIs) for the US, eurozone, and UK will show whether manufacturing and services activity is still growing. Diverging regional readings could affect the euro and sterling against the dollar.
On Wednesday, 25 November, the second estimate of US Q3 GDP and October durable goods orders will be published alongside the PCE figures. If core inflation exceeds forecasts, expectations of a rate hike could strengthen, supporting the dollar and US Treasury yields. This could put pressure on gold, equity indices, and Bitcoin.
On Thursday, 26 November, the NYSE will be closed for Thanksgiving, while on Friday, 27 November, its regular trading session will end at 8:00 PM (UTC +2). The shortened session could amplify equity market reactions to news amid low trading volumes.
Events that can move markets this week
| Day | Event | Why it matters |
|---|---|---|
| Monday, 23 November | Preliminary November manufacturing and services PMIs | These will provide an early assessment of business activity in November. If US PMIs exceed expectations while European readings are weak, the dollar could strengthen against the euro and sterling. |
| Tuesday, 24 November | Germany: November Ifo Business Climate Index US: November Conference Board Consumer Confidence Index | These will provide an early assessment of business activity in November. If US PMIs exceed expectations while European readings are weak, the dollar could strengthen against the euro and sterling. The Ifo index will show how German companies assess the coming months. Weak US consumer confidence could undermine expectations for holiday sales and put pressure on retailers' shares. |
| Wednesday, 25 November | US: EIA report on crude oil and petroleum product inventories. Federal Reserve Beige Book | Unexpected changes in inventories could move WTI and Brent prices. In the Fed report, markets will look for signs of cooling hiring and changes in price pressures ahead of the December meeting. |
| Thursday, 26 November | US: Thanksgiving. The NYSE is closed. SIFMA recommends that the bond market close. | Liquidity could be lower than usual in markets that remain open, making reactions to news sharper. |
| Friday, 27 November | France and Spain: preliminary November CPI. The US NYSE will close at 8:00 PM. SIFMA recommends that bond trading end at 9:00 PM. | The national data will provide an early indication of eurozone inflation. A surprise in the same direction in both countries could move the euro and European bond yields through expectations for ECB interest rates. |
EURUSD forecast
EURUSD fundamental analysis
The dollar retains its advantage ahead of the new week. The minutes of the US Federal Reserve's meeting, published on 18 November, showed that policymakers discussed further tightening amid persistent inflation. In October, the Fed kept its interest rate in the 3.75–4.00% range, with two participants voting for a hike. The possibility of another rise supports the dollar through US bond yields.
In the eurozone, annual inflation accelerated from 3.8% to 4.0% in October, while energy prices rose by 21% year-on-year. This limits the scope for the European Central Bank to ease policy. At the same time, rising energy costs weigh on consumption and European companies' profitability, limiting the support that interest rate expectations provide to the euro.
The week's main events are scheduled for 25 November, when the US will release its second estimate of Q3 GDP and October Personal Consumption Expenditures (PCE) price index. Resilient growth and strong inflation figures could increase demand for the dollar. Weaker readings could trigger a rebound in EURUSD. Liquidity could decline towards the end of the week because of Thanksgiving, increasing the risk of sharp moves.
EURUSD technical analysis
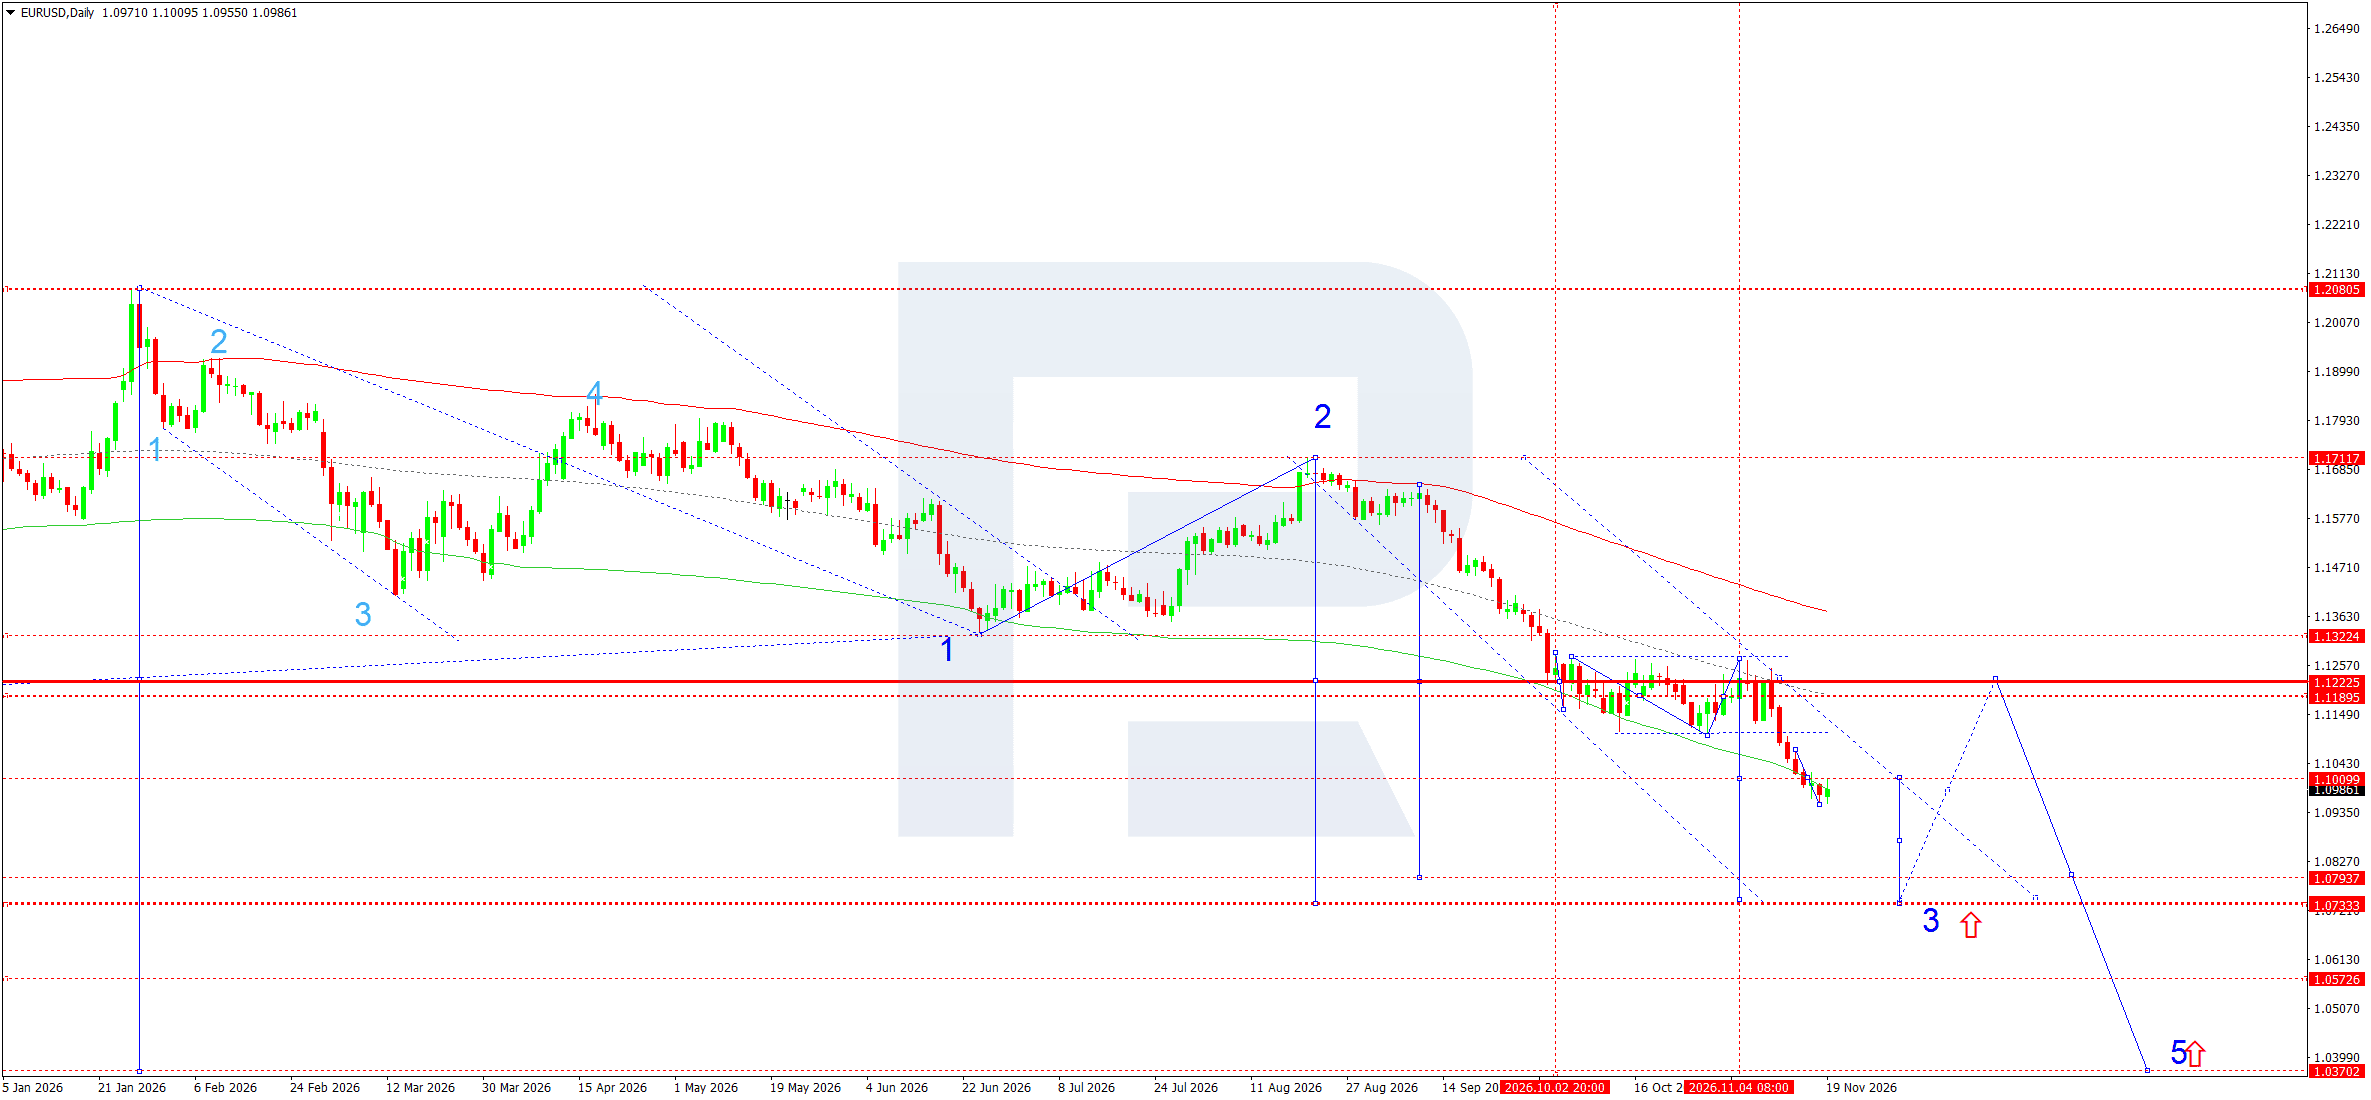
EURUSD remains in a downtrend on the daily chart. According to the Elliott wave count, the third downward wave is developing following the completion of the second wave near 1.1712. The break out of November's consolidation and below the 1.1000–1.1010 zone confirmed continued momentum within the descending channel. As long as daily closes remain below 1.1010, the potential for a corrective rise appears limited.
A break below the local low at 1.0955 would increase the likelihood of a move towards 1.0794, the nearest marked support and the weekly scenario's target. The main calculated target of the third wave is at 1.0733. Reaching it could provide the starting point for a fourth-wave correction. Consolidation above 1.1010 would weaken the immediate bearish scenario and open the way for a recovery towards 1.1190.
EURUSD trade scenario
The main scenario still envisages further declines with limited upward corrections. If the third wave develops, the next potential target will be the 1.0370 area. Selling remains the priority.
USDJPY forecast
USDJPY fundamental analysis
USDJPY enters the new week near 159.20. The minutes of the US Federal Reserve meeting, published on 18 November, showed that two participants voted to raise rates at the October meeting. The majority maintained the 3.75–4.00% range. Persistent inflation leaves scope for further Fed tightening and supports the dollar through US bond yields.
In Japan, October inflation stood at 2.30% year-on-year, while inflation excluding fresh food was 2.20%. The core measure remains above the Bank of Japan's target, increasing the likelihood of a further rate rise and limiting USDJPY's upside potential. The pair is sensitive to the reaction of bond yields to differences in monetary policy expectations between the two central banks.
On Wednesday, 25 November, the US will publish its second estimate of Q3 GDP and October personal income and spending data, including the PCE price index. Stronger inflation figures could support the dollar. Slower price growth could increase demand for the yen. Liquidity during the US session could decline on Thursday because of Thanksgiving.
USDJPY technical analysis
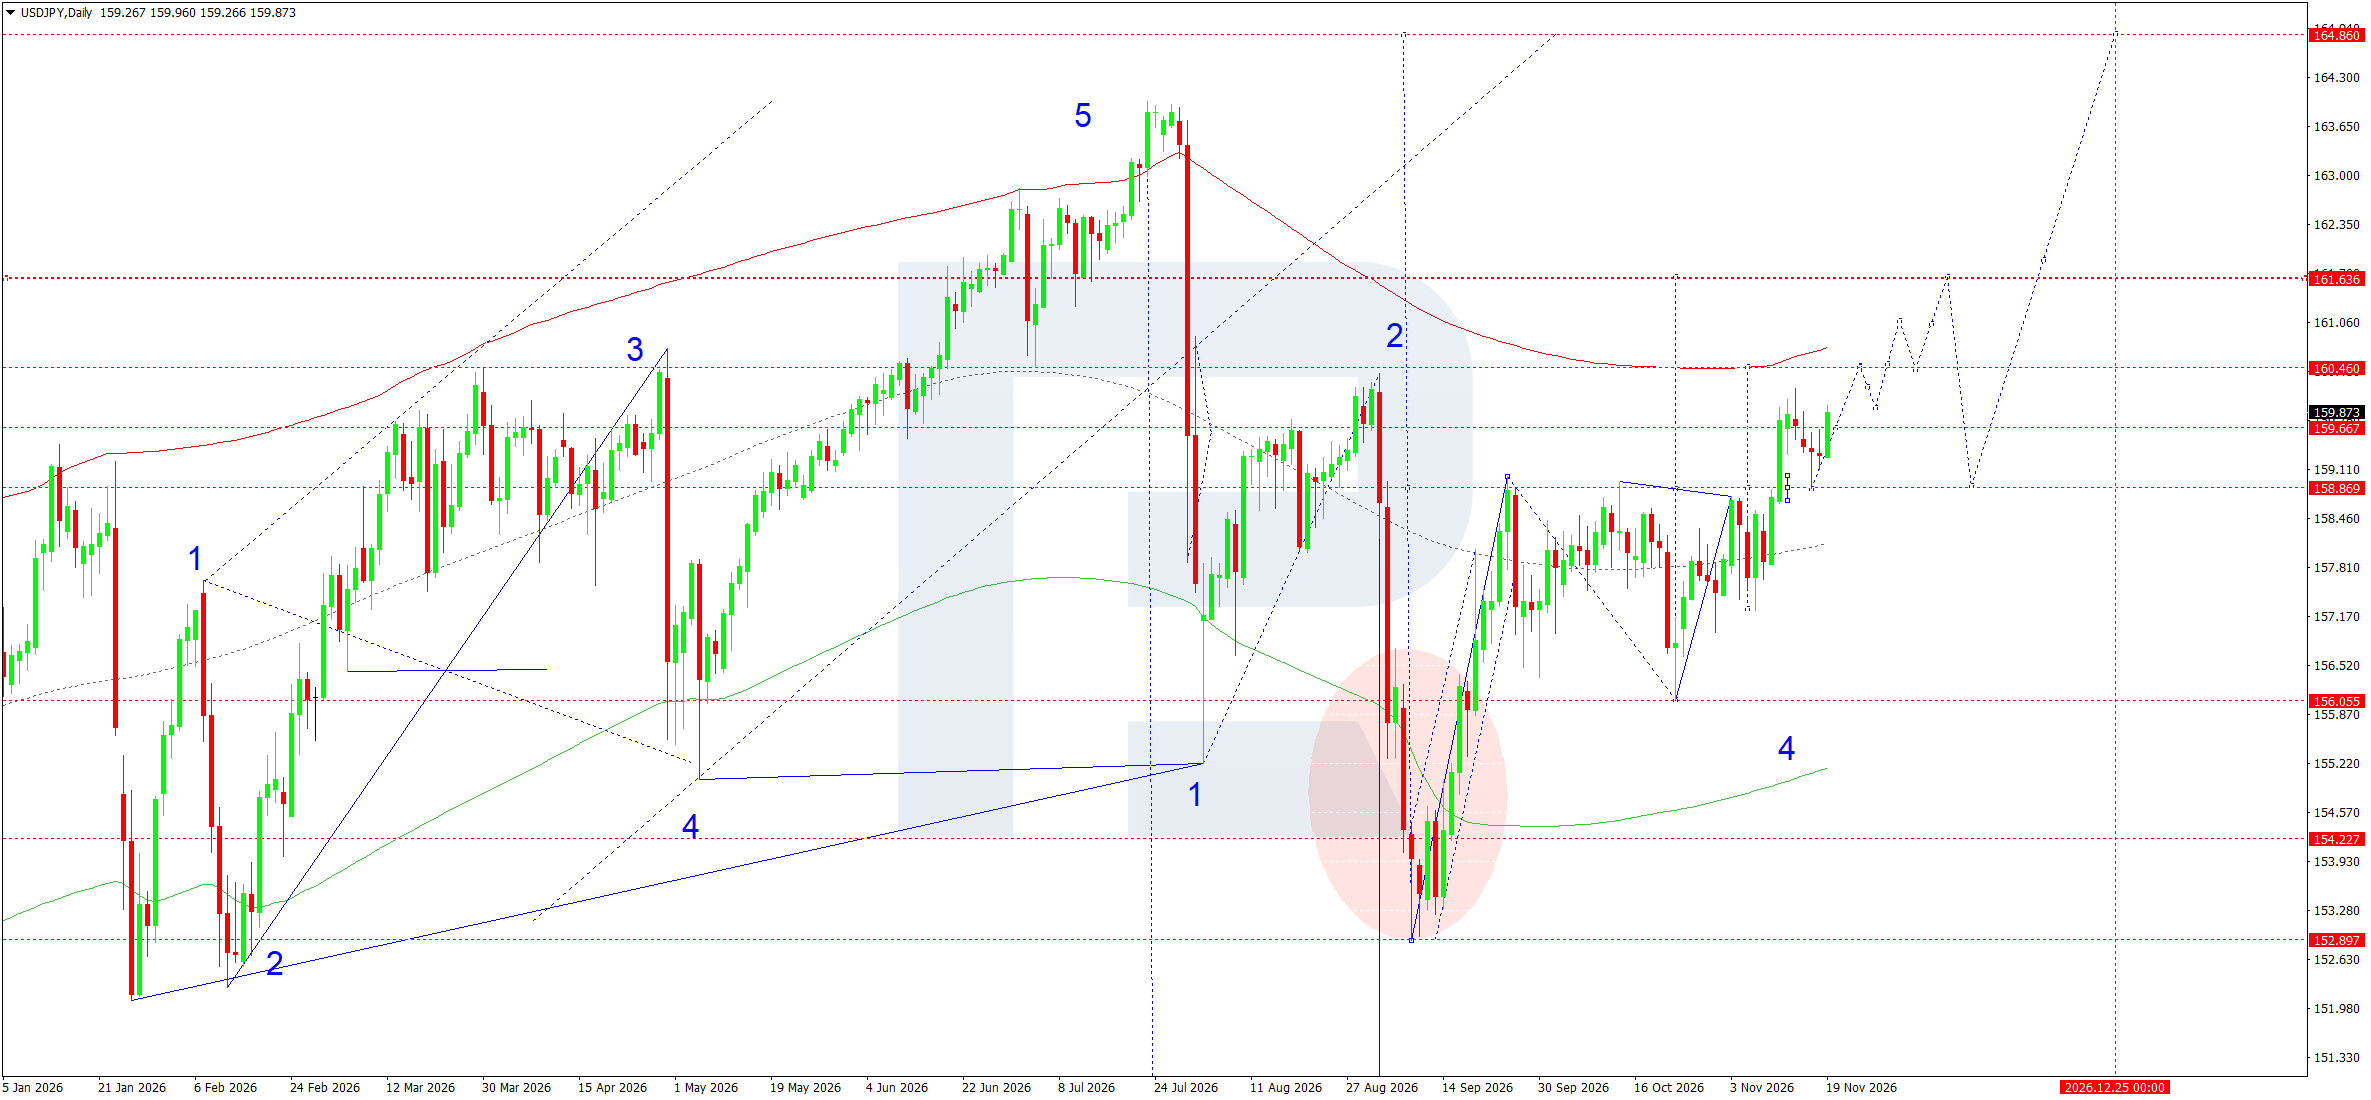
The daily chart shows a breakout from consolidation around 158.87 and a recovery towards 159.87. A more recent reference level for 20 November is 159.20. The pullback has taken the pair back below intermediate resistance at 159.67. As long as support at 158.87 holds, the local trend remains upward. Under the Elliott wave count shown, holding this area could mark the completion of the fourth wave and the development of a fifth.
A return above 159.67 would open the way towards 160.46. A correction towards 158.87 is possible from that level. If buyers defend support and the pair then consolidates above 160.46 again, the next target will be 161.64. A breakout above it would open the prospect of a move towards 164.86 beyond the weekly horizon. A daily close below 158.87 would weaken the bullish scenario and shift attention towards 156.06.
USDJPY trade scenario
GBPUSD forecast
GBPUSD fundamental analysis
Annual inflation in the UK accelerated from 3.5% to 3.6% in October amid higher motor fuel prices. Core inflation, meanwhile, was virtually unchanged at 2.8%, while services prices rose by 3.7% year-on-year. The Bank of England raised its interest rate to 4% in November. The October figures leave room for further tightening, although persistent core inflation limits the case for an imminent rate increase. Retail sales rose by 0.7% in October following a 0.6% decline in September. Some of the increase reflected purchases of long-life food products, so the monthly rebound offers only moderate support to sterling.
The US Federal Reserve kept its interest rate in the 3.75–4% range in October. Minutes published on 18 November showed that almost all meeting participants considered a further rate increase likely to be appropriate under their baseline outlook. This stance supports the dollar. The market will focus on the Fed's Beige Book on 25 November. Lower liquidity around Thanksgiving on 26 November could amplify fluctuations in GBPUSD.
GBPUSD technical analysis
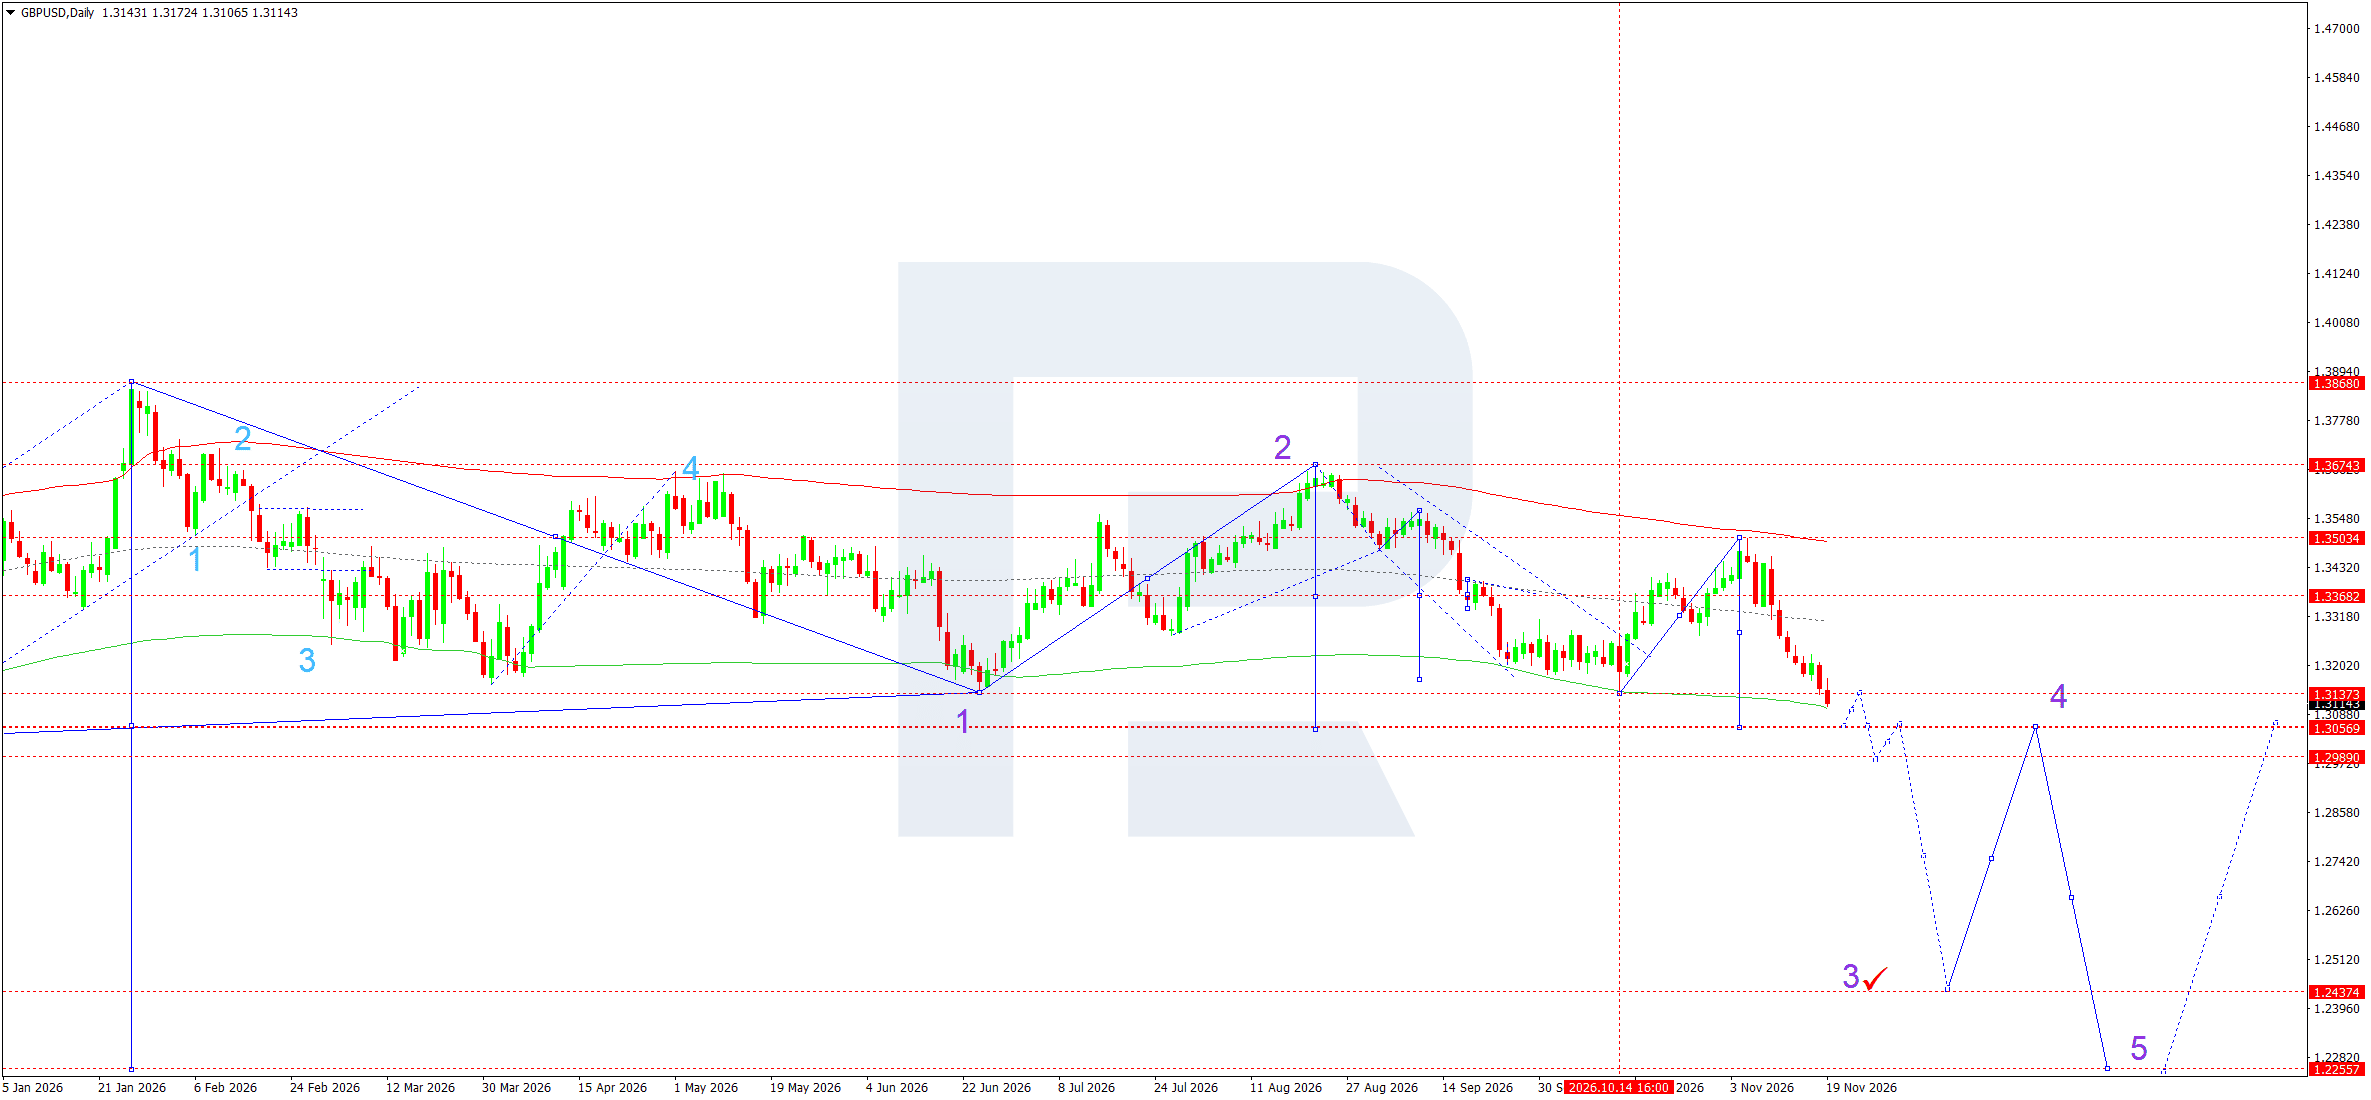
The downtrend remains intact on the daily chart. After reversing from 1.3503 in early November, the pair broke below 1.3368 and fell beneath 1.3137. In the event of a rebound, former support at 1.3137 will become the first resistance. If sellers defend this level, the nearest target will be 1.3057, where a brief consolidation is possible. A daily close below 1.3057 would open the way towards 1.2989.
According to the Elliott wave count, a break below 1.2989 would strengthen the scenario of a developing third downward wave. An intermediate reference level lies near 1.2760, with the calculated third-wave target at 1.2437. The count then allows for a corrective rise in a fourth wave, followed by a fifth-wave decline towards 1.2256.
A return above 1.3137 would weaken sellers' momentum and increase the likelihood of a recovery towards 1.3368.
GBPUSD trade scenario
AUDUSD forecast
AUDUSD fundamental analysis
The Australian dollar enters the new week under pressure following a weak labour market report. Employment fell by 43,500 in October, while unemployment rose to 4.9%. These figures give the Reserve Bank of Australia reason to approach further monetary tightening more cautiously. The RBA raised its interest rate to 4.85% in early November, while minutes published on 17 November showed that three of the nine board members favoured leaving it unchanged.
The US dollar is supported by expectations of further tightening by the Federal Reserve. Minutes published on 18 November confirmed that two participants had voted for a rate increase at the October meeting. The week's main events will fall on 25 November, when Australia publishes its October consumer price index and the US releases its October PCE price index. Persistent US price pressures could increase demand for the dollar. Accelerating inflation in Australia could support the AUD if markets raise their assessment of the likelihood of another RBA move.
AUDUSD technical analysis
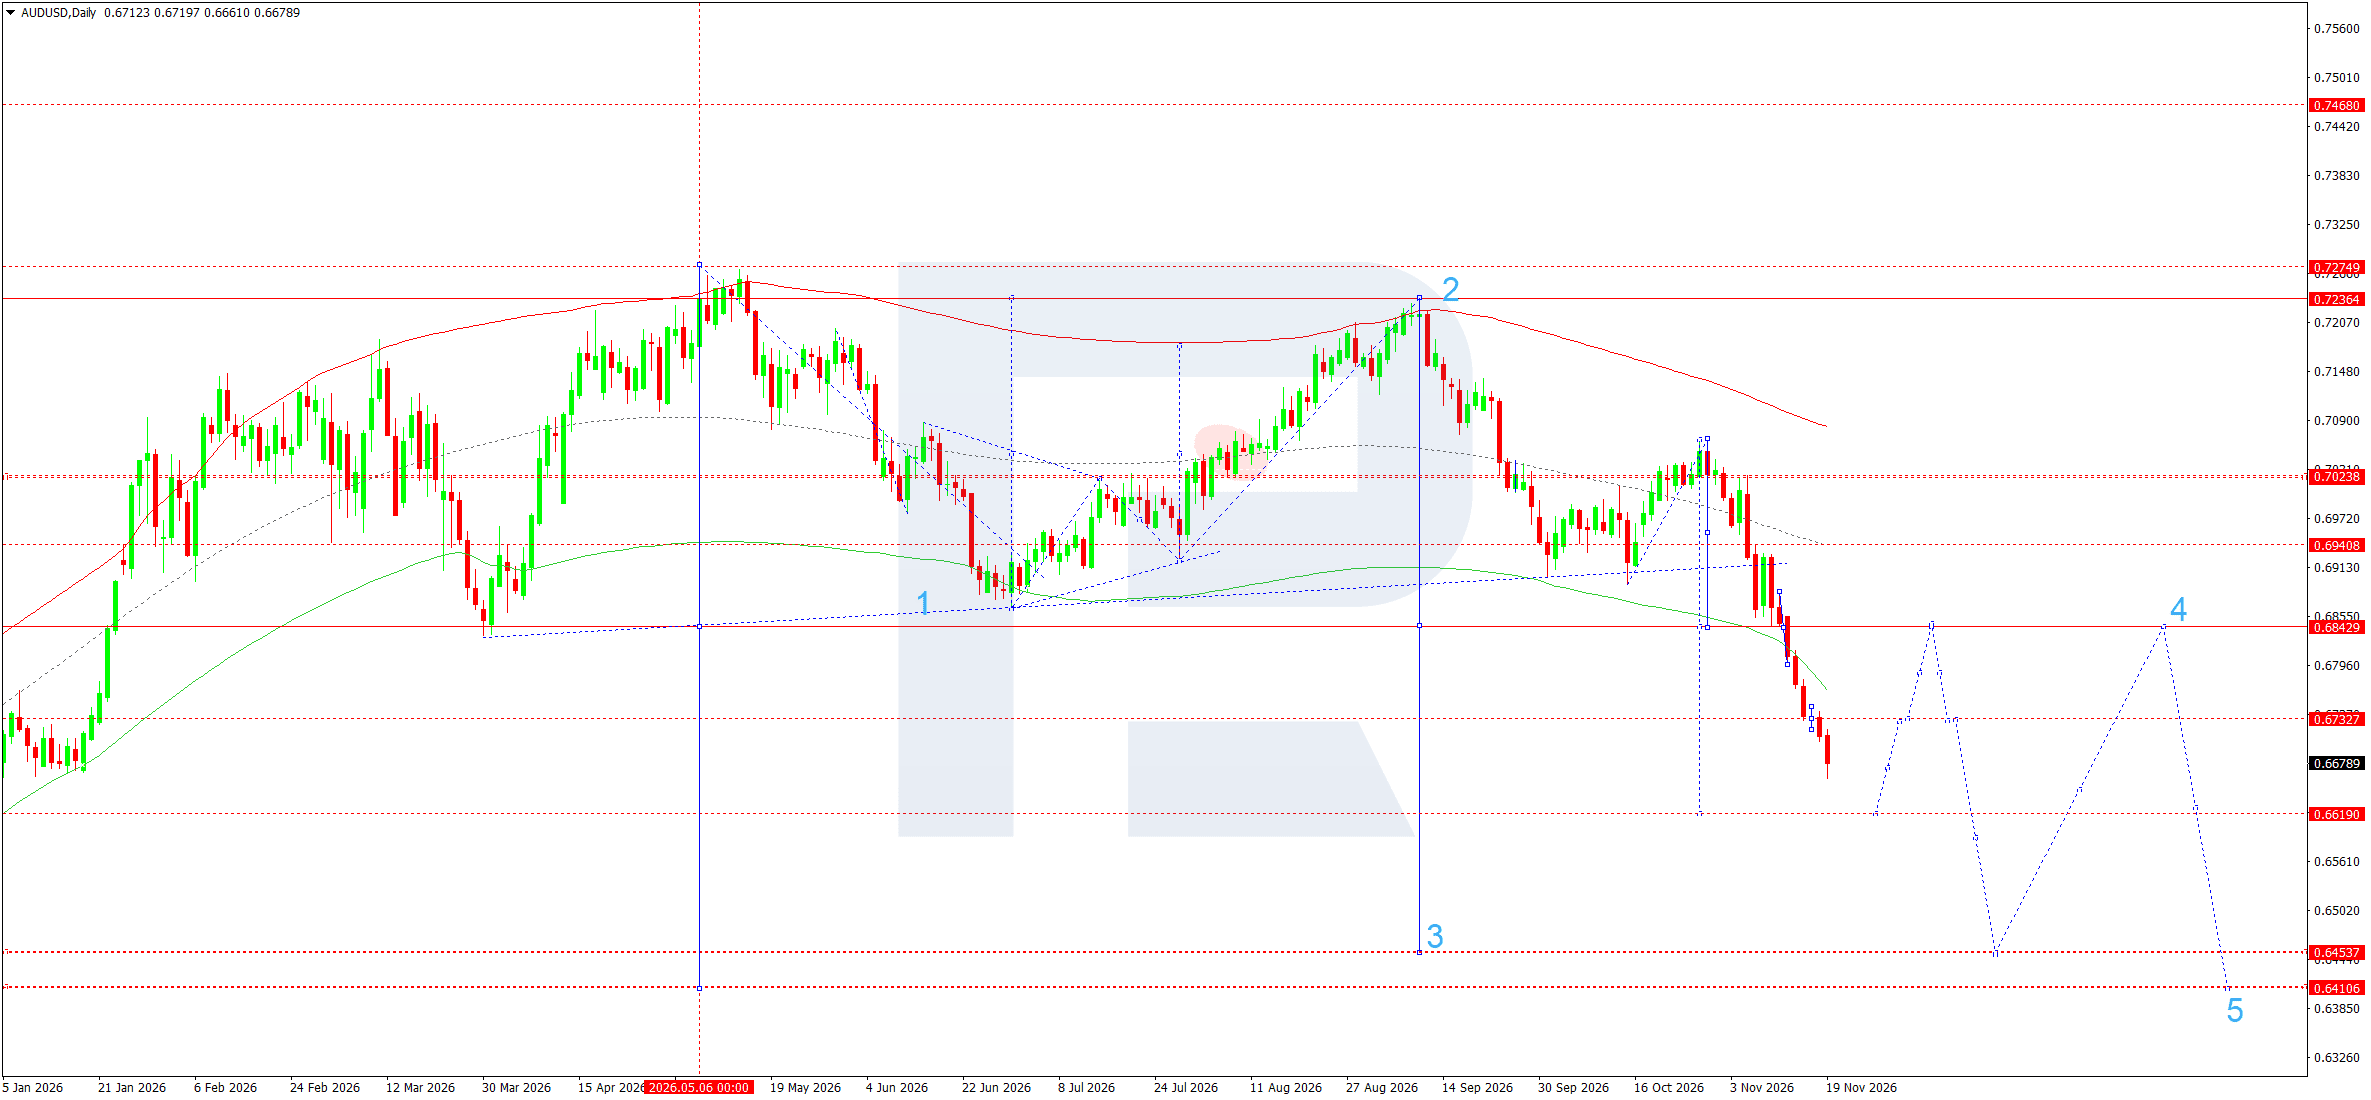
AUDUSD remains in a downtrend on the daily chart. After breaking below 0.6843, the pair fell through 0.6733, which now acts as the nearest resistance. The Elliott wave count suggests the current impulse could extend towards 0.6619.
A corrective rebound towards 0.6733 is possible from this support, while consolidation above it would open the way towards 0.6843 and weaken the scenario of an immediate further decline. If selling resumes and the price consolidates below 0.6619, the next target will be 0.6454. A more distant fifth-wave target is at 0.6411.
The baseline weekly scenario is to sell after a five-point decline from the quote shown on the provided chart. The stop is placed just above the high of the last daily candlestick shown. Take profit is set at the first support, where a rebound is possible under the wave scenario.
AUDUSD trade scenario
USDCAD forecast
USDCAD fundamental analysis
The US dollar retains its interest rate advantage. The Federal Reserve is keeping its rate in the 3.75–4.00% range, while the Bank of Canada raised its rate to 2.50% in October. Fed minutes published on 18 November confirmed that two participants had voted for an increase. This stance and persistent inflationary pressure support demand for the US currency.
In Canada, annual inflation remained at 3.1% in October, while inflation excluding energy slowed from 2.1% to 2.0%. Easing price pressures outside the energy sector weaken the case for another BoC rate increase in December. At the same time, a renewed rise in oil prices could support the Canadian dollar through improved export conditions.
On Wednesday, 25 November, the US will release its second estimate of Q3 GDP and October personal income and spending figures, including the PCE price index. Resilient consumer spending and higher inflation could support a rise in USDCAD. A weak report would increase the likelihood of a pullback towards the pair's nearest support.
USDCAD technical analysis
The main trend remains upward on the daily chart. November's impulse from 1.3931 passed 1.4244 and reached 1.4357. The move fits the Elliott wave scenario of an extended fifth wave. After pulling back from the local high, the pair is testing the 1.4319 area, where a horizontal level lies near the upper boundary of the ascending channel.
Holding 1.4319 would preserve the likelihood of another test of 1.4357. A break above November's high would open the way towards the calculated target at 1.4409. Consolidation above it would make 1.4431 the next target of the extended fifth wave.
A daily close below 1.4272 would weaken the bullish scenario and increase the likelihood of a correction towards 1.4244. Buying is considered on a move above 1.4319, with a stop below the low of the last candlestick on the provided chart.
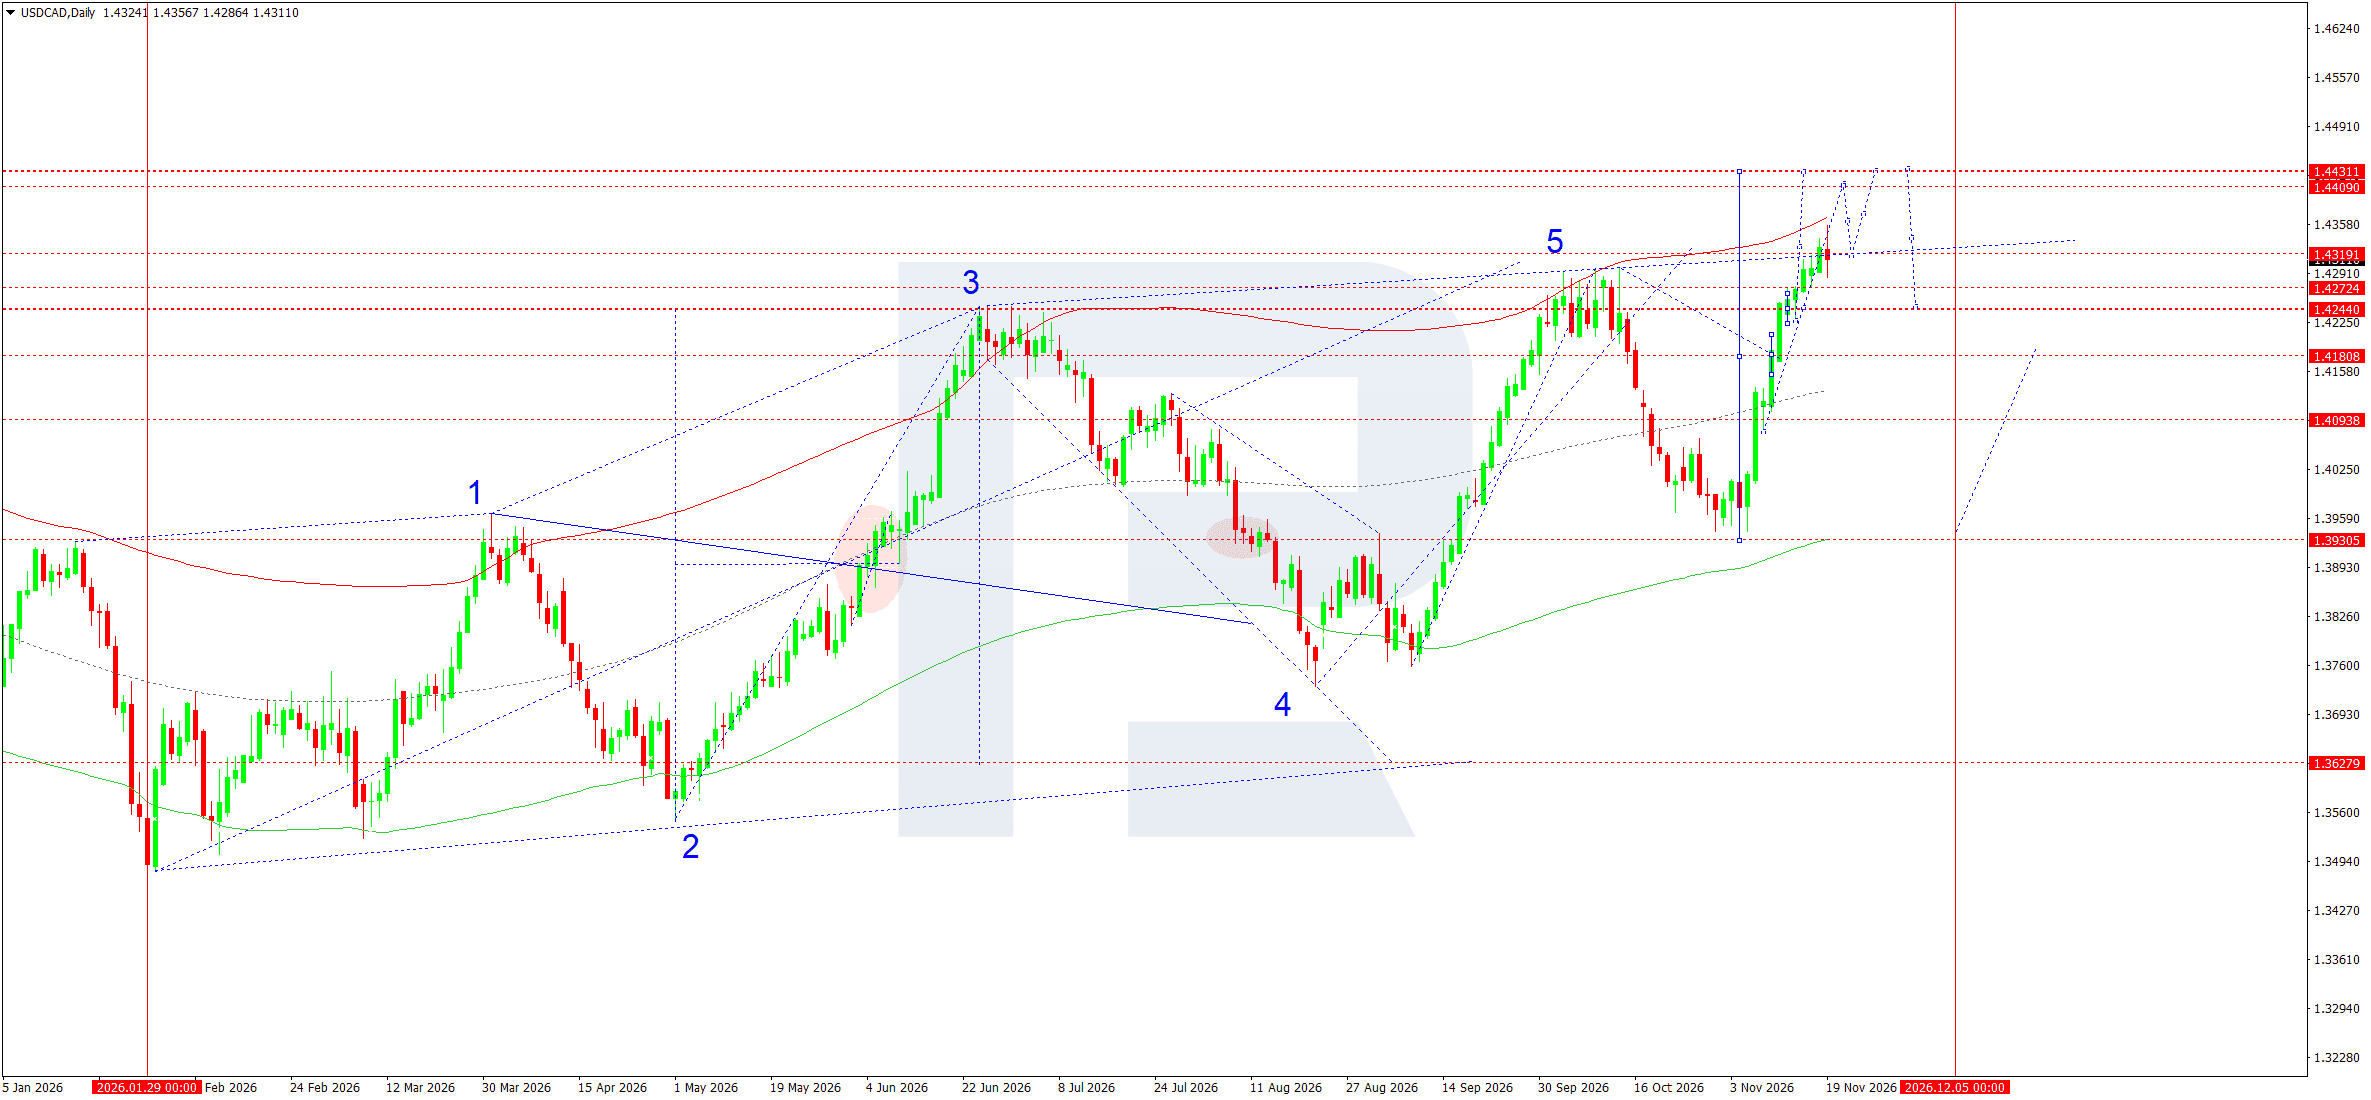
USDCAD trade scenario
XAUUSD forecast
XAUUSD fundamental analysis
Gold enters the new week under pressure from a strong dollar and expectations of a December rate increase. During the Asian session on 20 November, the spot price fell to USD 3,552 per troy ounce. Minutes of the US Federal Reserve's October meeting, published on 18 November, showed broad support for further monetary tightening. High Treasury yields increase the opportunity cost of holding gold, while a stronger dollar makes the metal more expensive for buyers using other currencies.
The week's main releases are due on 25 November. The US will publish its second estimate of Q3 GDP and October personal income and spending report, which includes the PCE price index. If inflation exceeds expectations and economic growth remains resilient, the dollar could receive further support. Weaker figures could lower yields and trigger short covering in gold. On Thursday, Thanksgiving-related lower liquidity in US markets could amplify price fluctuations.
XAUUSD technical analysis
XAUUSD remains in a downtrend on the daily chart. After the second wave ended near 4,696, prices formed a sequence of lower highs and broke below 3,875. The latest quote on the provided chart is 3,678. A more recent spot quote from 20 November is already below 3,608, making this level the nearest resistance on a retest.
In the coming week, selling on a break to fresh lows remains the priority. If daily prices consolidate below 3,608, the main third-wave target will remain 3,060. Reaching this level could take longer than a week.
A return above 3,608 would weaken the short-term signal and increase the likelihood of a correction towards 3,875. Under the broader Elliott wave scenario, a fourth wave could test 3,875 from below after 3,060 is reached. If the decline resumes, the long-term fifth-wave target will be 2,161.
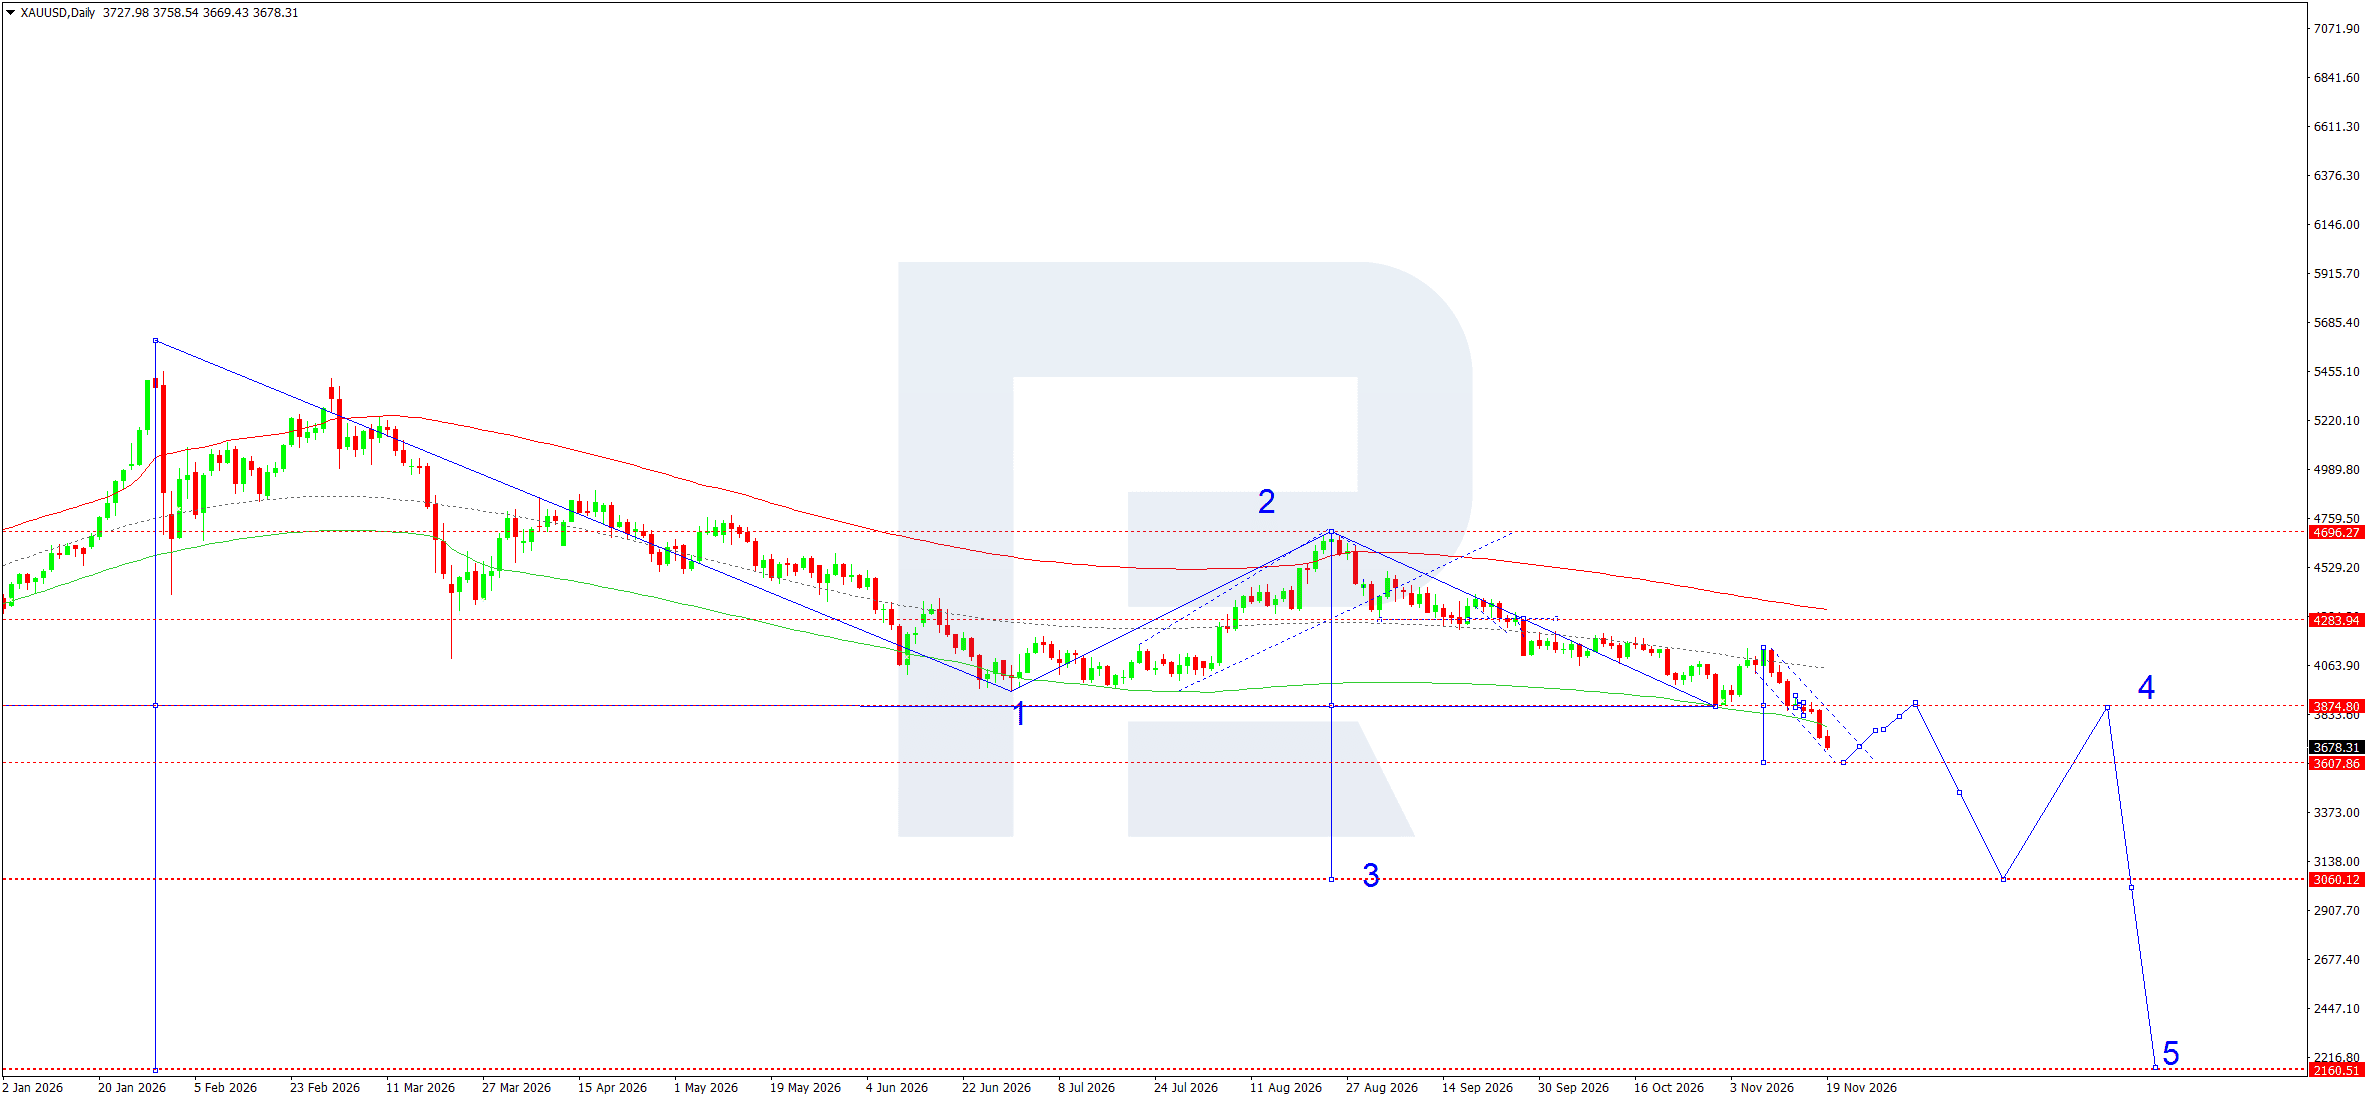
XAUUSD trade scenario
US 500 forecast
US 500 fundamental analysis
US 500 enters the holiday-shortened week under pressure from two factors: the sell-off in technology shares and expectations of a US rate increase. On 19 November, more than 90% of S&P 500 constituents declined. This breadth of selling shows that weakening risk appetite has spread beyond companies associated with artificial intelligence.
Minutes of the Federal Reserve's October meeting, published on 18 November, showed that several participants considered a possible tightening in December justified. On Wednesday, 25 November, the October PCE price index and the second estimate of US Q3 GDP will be released. If inflation exceeds expectations, Treasury yields could rise, increasing pressure on technology company valuations. Weaker core PCE inflation could ease expectations of a Fed rate rise and support a rebound. US stock exchanges will be closed on Thursday for Thanksgiving. Friday's shortened session could amplify price fluctuations amid reduced liquidity.
US 500 technical analysis
The downward structure dominates the US 500 daily chart. After a reversal near 7,846, rebounds in November produced lower highs. The price moved below the channel's lower boundary and the 7,425 level, which now serves as the nearest resistance. The latest quote on the chart is rounded to 7,307 and serves as the reference for calculating the trade.
The baseline weekly scenario envisages a further decline towards 7,201. Holding this support could lead to consolidation and a corrective return towards 7,425. Consolidation above 7,425 would open the way towards 7,522. However, under the wave count, even a rise towards 7,522 would be consistent with a correction within the downward move. If selling resumes after the rebound and a daily candlestick closes below 7,201, the next medium-term target will be 6,887. For the weekly trade, take profit is set one point above the first support.
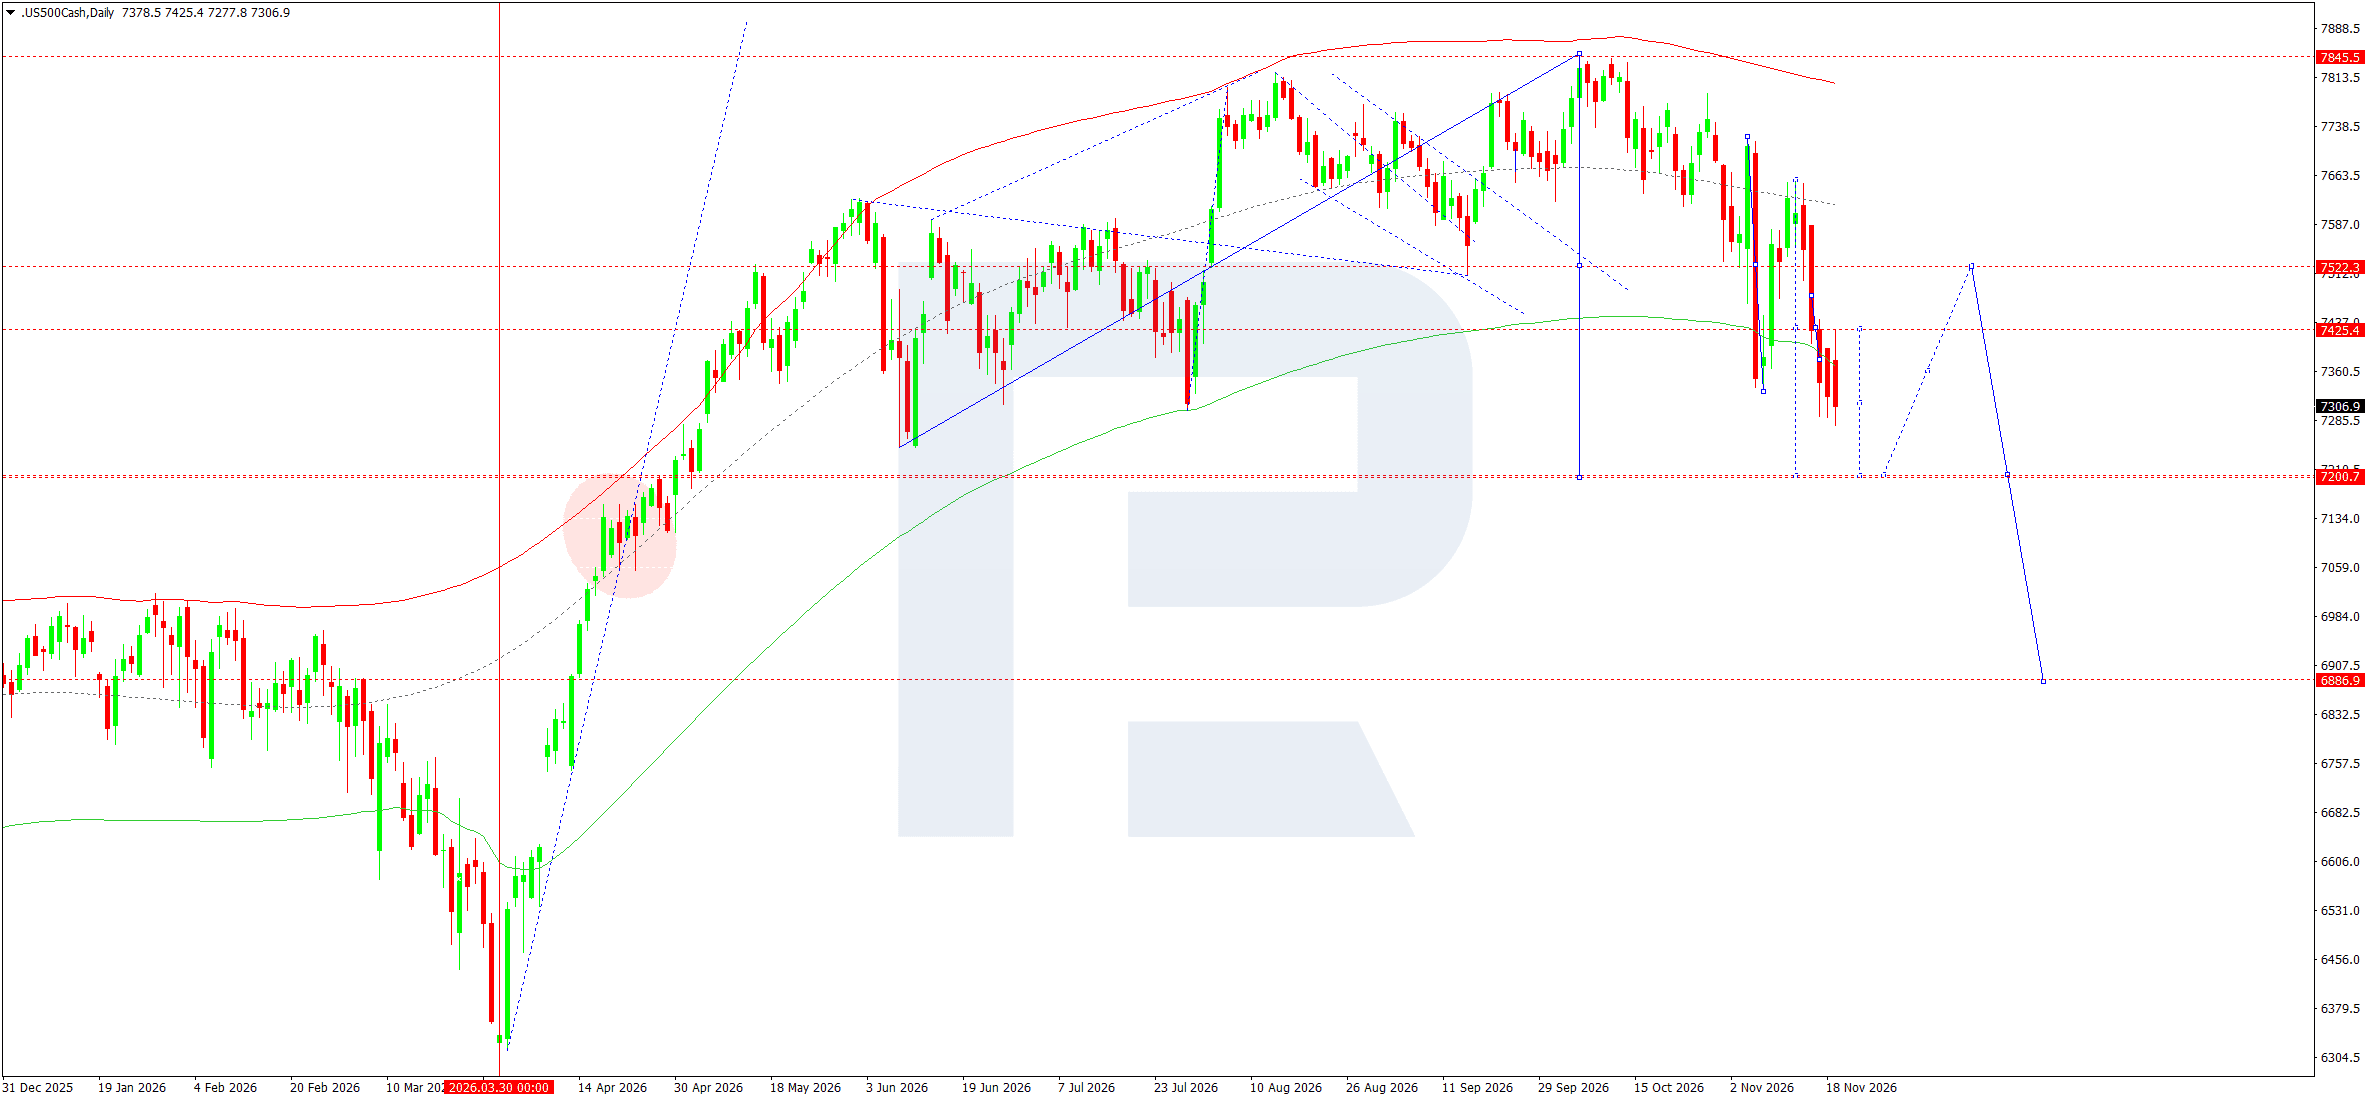
US 500 trade scenario
BTCUSD forecast
BTCUSD fundamental analysis
Bitcoin enters the new week under pressure from capital outflows from US spot funds. According to Farside Investors, net outflows from Bitcoin ETFs totalled approximately USD 582 million on 19 November. This was the third consecutive day of outflows. If redemptions continue, a BTCUSD recovery will struggle to gain momentum even if the price stabilises near the closest support. Farside Investors data.
In minutes published on 18 November, almost all participants in the US Federal Reserve's October meeting considered a further rate increase likely under their baseline outlook. The main test of these expectations will come on 25 November, when the October PCE price index and the second estimate of US Q3 GDP are released. Higher-than-expected inflation could support the dollar and Treasury yields, adding pressure to Bitcoin. Weaker price figures could give BTCUSD room to rebound. After Thanksgiving, Friday's shortened session on the NYSE could amplify the cryptocurrency market's reaction to large orders. Fed minutes, US releases calendar, exchange trading schedule.
BTCUSD technical analysis
BTCUSD has broken below the ascending channel on the daily chart and formed a sequence of lower highs. The latest downward wave reached the 62,000 area.
The baseline weekly scenario envisages consolidation above support at 62,023, with an upper boundary near 64,009. A daily close above this boundary would open the way towards 68,186, where support was previously located.
Within the current wave structure, this rise is viewed as a correction. A reversal from 68,186 would make a retest of the 62,023 level likely, while consolidation below support would open the way towards 55,946.
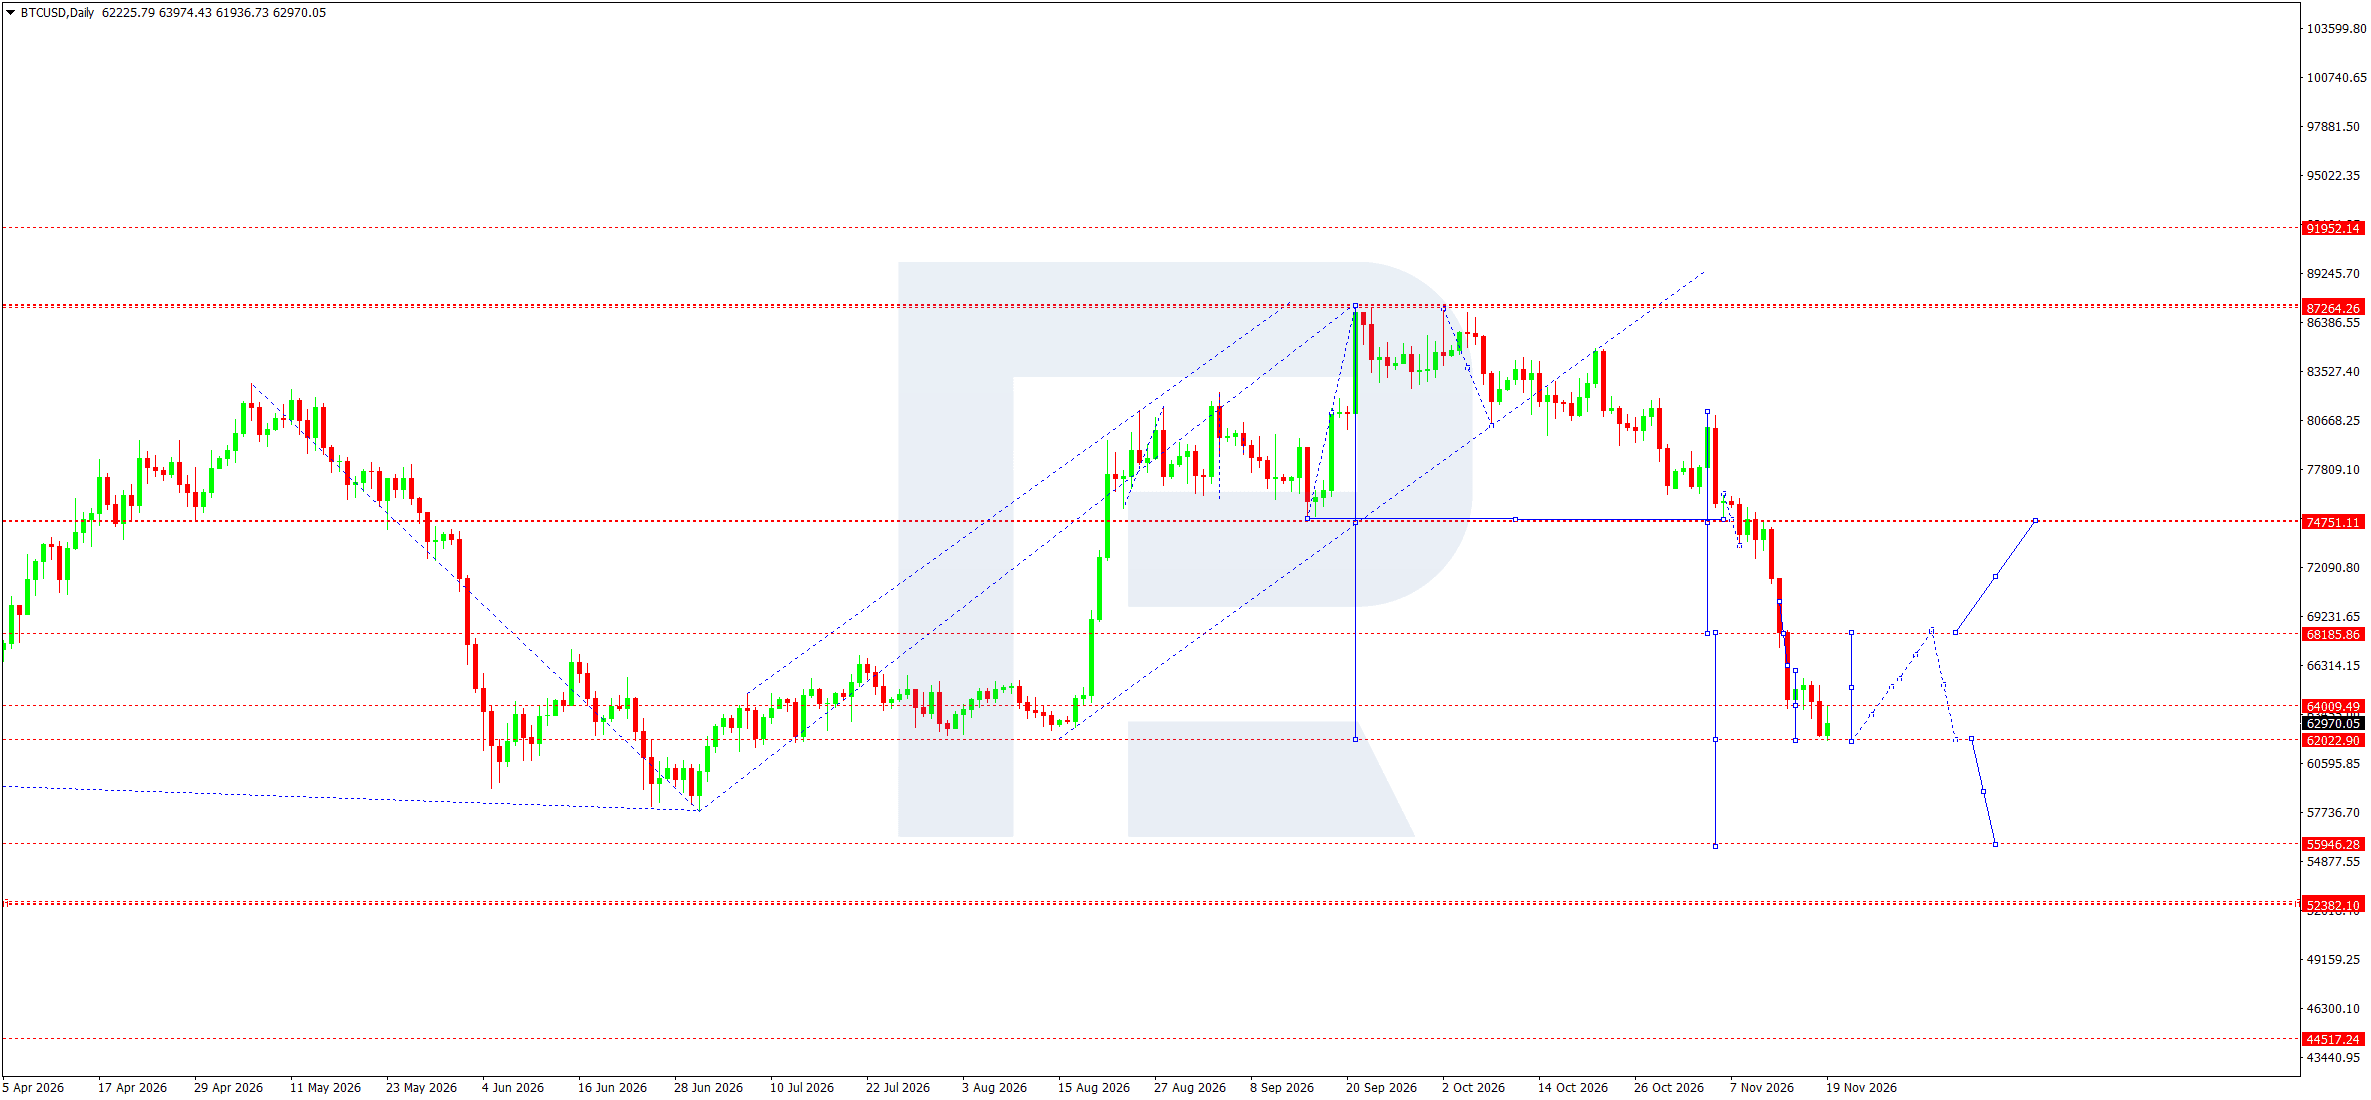
BTCUSD trade scenario
Weekly summary
On Monday, 23 November, S&P Global will release preliminary November Purchasing Managers' Indices (PMIs) for the US, eurozone, and UK. These figures will show changes in manufacturing and services activity and could influence EURUSD and GBPUSD. On Wednesday, 25 November, the US will release its second estimate of Q3 GDP and October personal income and spending figures, including the PCE price index. The NYSE will be closed on Thursday for Thanksgiving, while Friday's regular session will end at 8:00 PM.
The core PCE index will be the week's key indicator. If inflation exceeds expectations, markets may raise their assessment of the likelihood of another Fed rate hike. This could support the dollar and weigh on gold, US 500, and Bitcoin. Weaker inflation alongside resilient GDP growth could weaken the dollar and support those assets. However, if the growth outlook also deteriorates, concerns about demand could restrain gains in the US 500 and Bitcoin.
Editors' picks


EURUSD forecast 2026–2027: technical analysis, price levels & predictions
The EURUSD outlook for 2026 and 2027: key levels on the daily chart, three trading scenarios, and the policy gap between the Fed and the ECB that drives the pair.

Gold (XAUUSD) forecast 2026: technical analysis, price levels & predictions
Where gold could trade in 2026: key levels, three trading scenarios with entry triggers, and the forecasts from J.P. Morgan, Deutsche Bank, and Goldman Sachs.
Forecasts presented in this section only reflect the author’s private opinion and should not be considered as guidance for trading. RoboForex bears no responsibility for trading results based on trading recommendations described in these analytical reviews.