
XAUUSD awaits a decisive signal
Gold is awaiting the release of US inflation data and gearing up for a surge, with prices currently standing at 4,160 USD. Discover more in our analysis for 14 October 2026.
XAUUSD forecast: key takeaways
- The US CPI report for September is due today
- The risk of a Federal Reserve rate hike remains
- Gold ETFs attracted 10 billion USD in September
- XAUUSD forecast for 14 October 2026: 4,200
Fundamental analysis
The XAUUSD price forecast for today, 14 October 2026, shows that gold continues to trade sideways ahead of US inflation data. A weaker dollar is supporting the precious metal, but the risk of further Fed rate hikes is limiting its upside potential.
The US CPI report for September is due today. The forecast suggests that headline inflation will rise to 3.6% year-on-year, up from the previous 3.4%. A stronger-than-expected actual figure could increase expectations of monetary policy tightening and put pressure on gold, while a reading below the forecast would bolster the metal and could trigger a rise in XAUUSD prices.
The risk of a Federal Reserve rate hike remains. Several Fed officials believe that another increase may be needed before the end of the year. The market largely expects a pause in October, but tightening in December remains a significant scenario. High interest rates increase the opportunity cost of holding gold, which does not generate interest income.
According to the World Gold Council, gold ETFs attracted 10 billion USD in September, with quarterly inflows reaching a record 31 billion USD. Global fund holdings increased by 67 tonnes to a record 4,256 tonnes, indicating sustained investor interest despite the recent price decline.
The XAUUSD forecast for 14 October takes into account that record inflows into gold ETFs and geopolitical instability are supporting demand, while the risk of further Federal Reserve rate hikes limits the outlook for gains. Today's main catalyst will be the release of US CPI data, which could change investors' expectations regarding monetary policy.
Technical outlook
On the XAUUSD H4 chart, prices have formed a Hammer reversal pattern near the lower Bollinger Band and could continue their upward wave as the pattern's signal plays out. Since XAUUSD remains within a descending channel, the upside target could be the 4,200 USD resistance level.
However, today's XAUUSD technical analysis also considers another scenario in which prices could fall towards 4,135 USD and continue their downward momentum without testing the resistance level.
XAUUSD overview
- Asset: XAUUSD
- Timeframe: H4 (Intraday)
- Trend: bearish
- Key resistance levels: 4,200 and 4,255
- Key support levels: 4,135 and 4,090
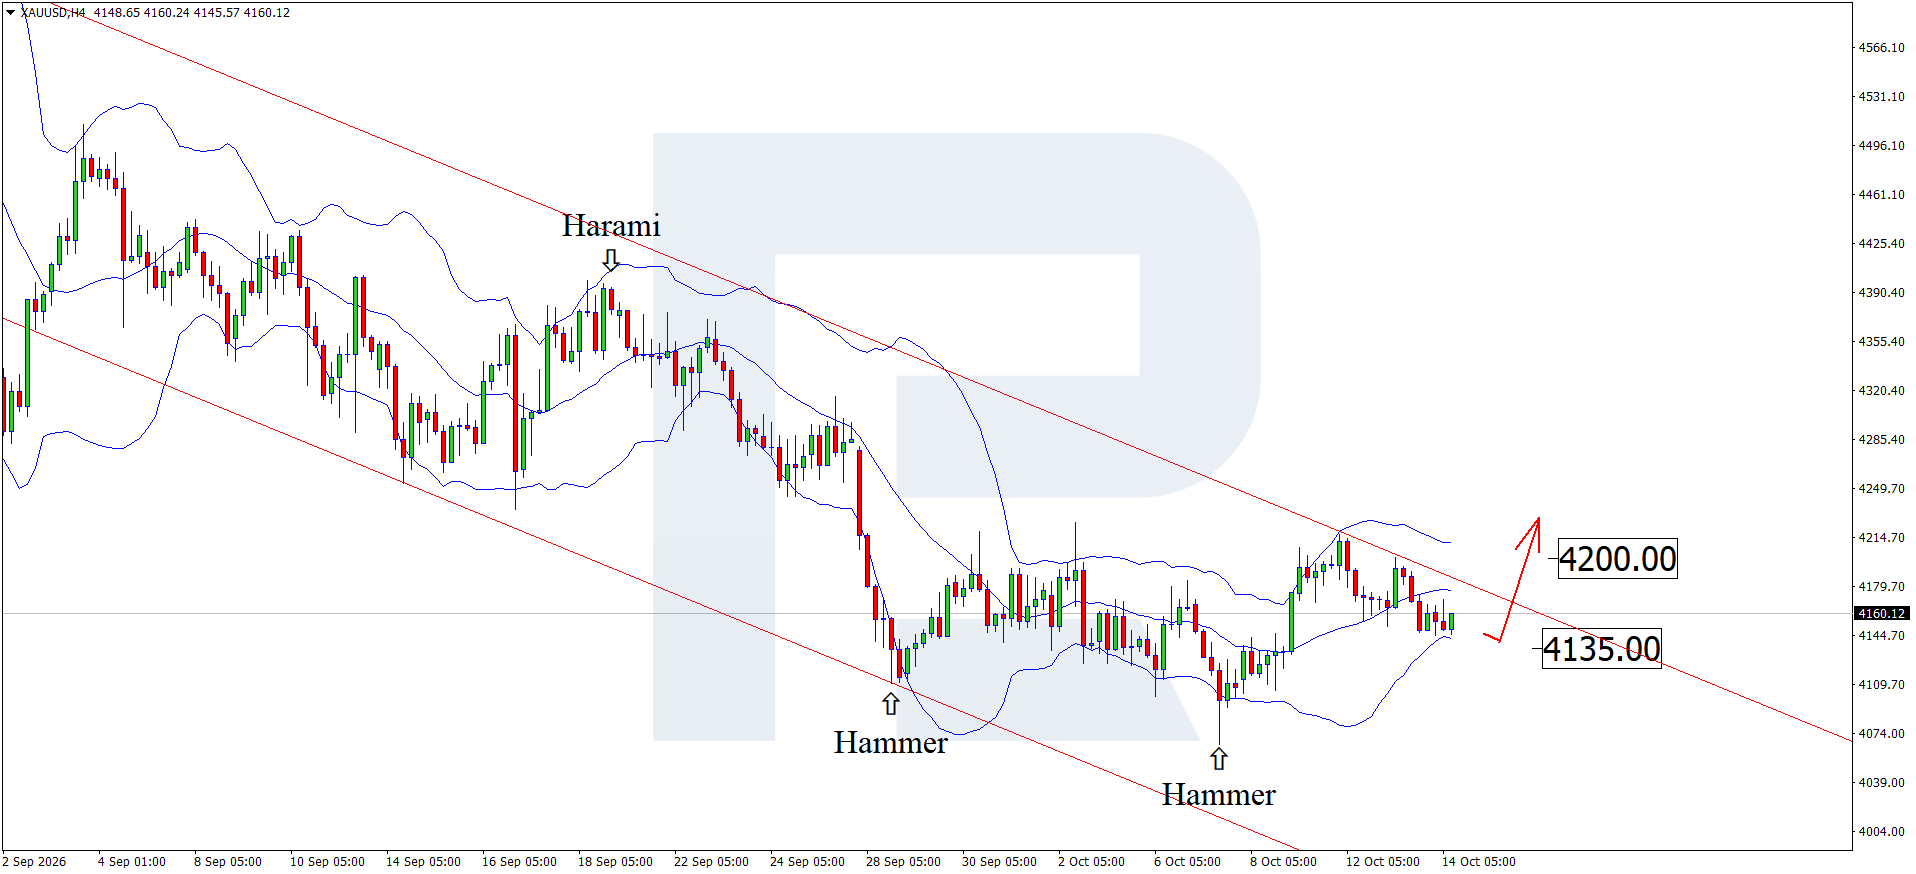
XAUUSD trading scenario for today
Trading scenario (Buy Stop)
A breakout above the upper boundary of the descending channel, followed by consolidation above 4,200 USD, would indicate increased buying pressure and signal an opportunity to open long positions.
- Current price: 4,160
- Entry level: 4,200
- Stop loss: 4,175
- Take profit: 4,255
- Risk-to-reward ratio: more than 1:2
The trade idea is valid until 8:00 AM on 15 October 2026 (server time, UTC+3).
Risk factors
The main risk to XAUUSD gains is weaker demand for gold as a safe-haven asset amid geopolitical tensions, Fed actions, and a stronger US dollar.
Summary
The release of US CPI data will be the main catalyst for today's session, as it could shift investors' expectations regarding monetary policy. Against this backdrop, XAUUSD technical analysis suggests growth towards 4,200 USD.
Editors’ picks
 EURUSD forecast 2026–2027: technical analysis, price levels & predictions
The EURUSD outlook for 2026 and 2027: key levels on the daily chart, three trading scenarios and the policy gap between the Fed and the ECB that drives the pair.
 Gold (XAUUSD) forecast 2026: technical analysis, price levels & predictions
Where gold could trade in 2026: key levels, three trading scenarios with entry triggers and the forecasts from J.P. Morgan, Deutsche Bank and Goldman Sachs.
Forecasts presented in this section only reflect the author’s private opinion and should not be considered as guidance for trading. RoboForex bears no responsibility for trading results based on trading recommendations described in these analytical reviews.