US Tech analysis: a downtrend has formed
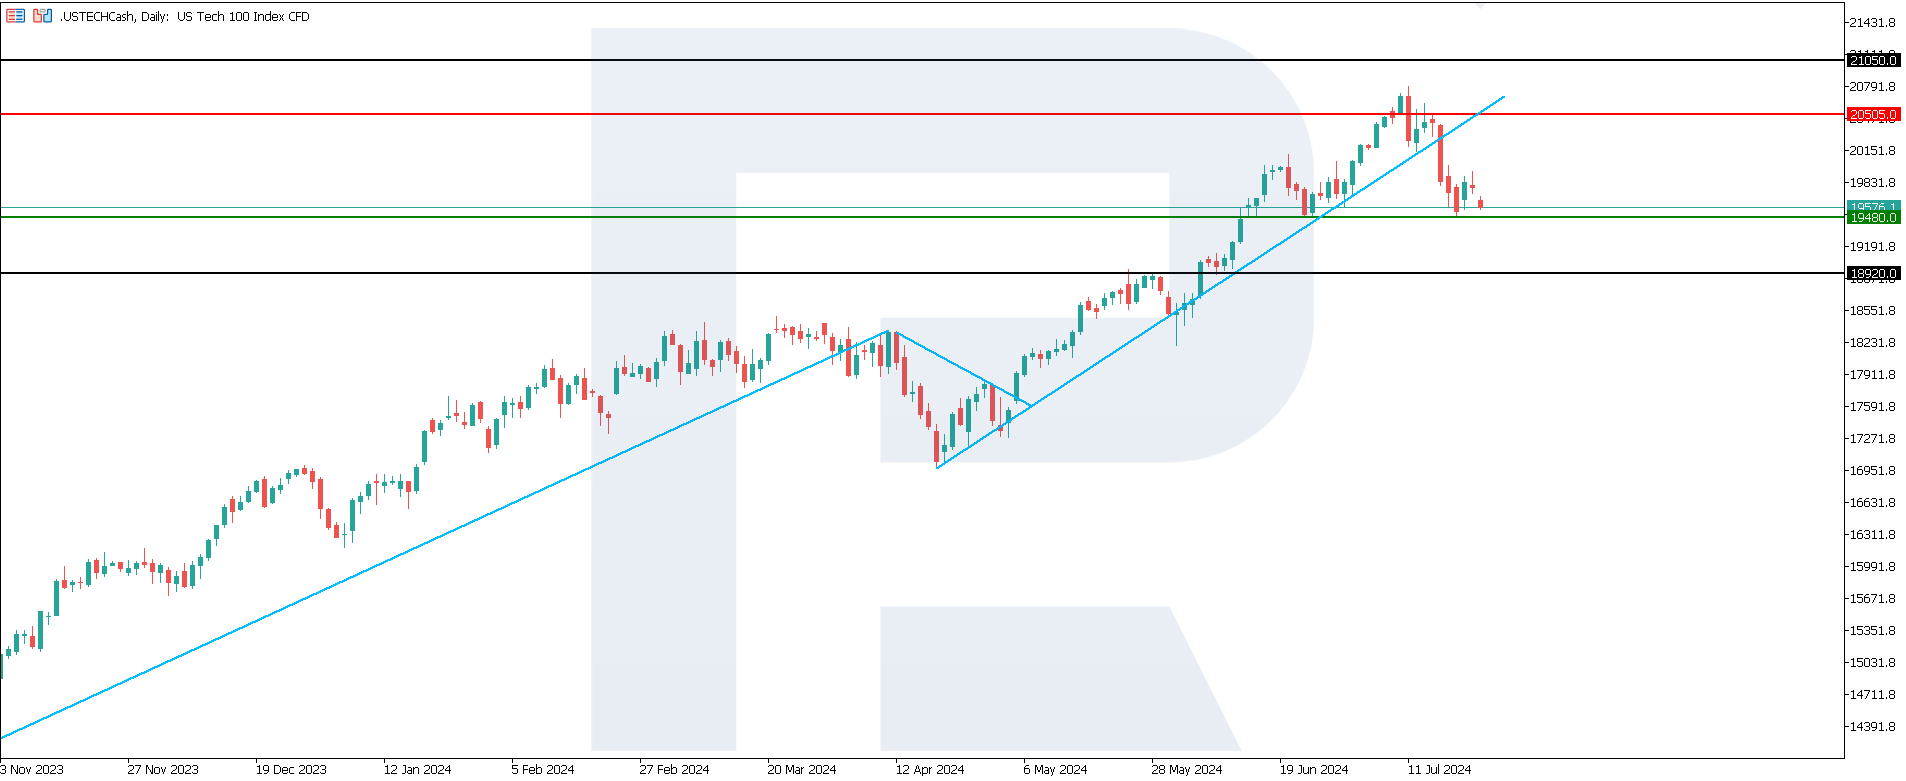
The US Tech stock index tumbled by 6.4% after reaching an all-time high. The quotes broke below the 21,160.0 support level and the uptrend’s support line.
US Tech trading key points
- Recent data: net interest payments on the US national debt relative to GDP exceeded 3.5%
- Economic indicators: the need to reduce the debt burden may be more pressing for the Federal Reserve than combating inflation
- Market impact: the Federal Reserve may be compelled to lower the key rate without waiting for the desired inflation parameters
- Resistance: 20,505.0, Support: 19,480.0
- US Tech price forecast: 18,920.0
Fundamental analysis
Net interest payments on the US national debt relative to GDP are projected to reach the highest level in over two centuries. Such a debt burden over an extended period may have a significantly adverse impact on economic growth prospects.
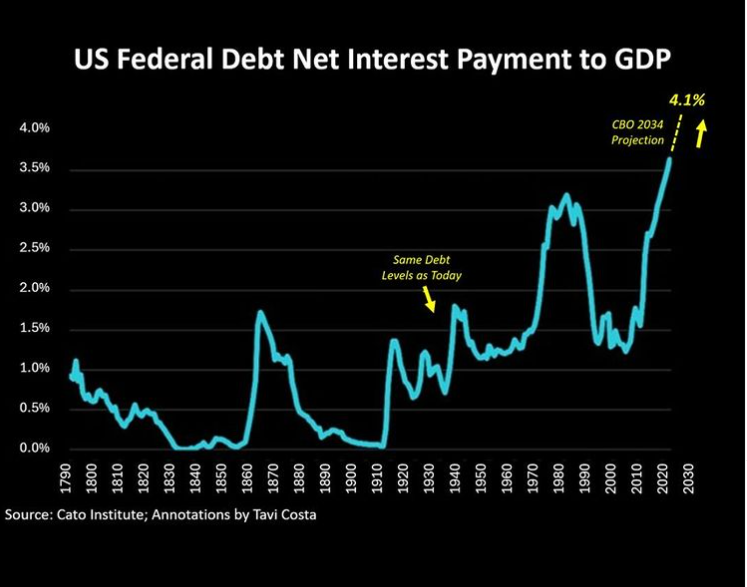
Source: https://instagram.com/p/C9xmDuQPwsZ/?igsh=ZXF1MTQyeG01bTBs&img_index=5
With the current level of national debt and its servicing cost, the US Federal Reserve’s concerns about inflation are becoming secondary. Measures to reduce the key rate and alleviate the burden on the federal budget are becoming far more critical.
The regulator may be forced to lower interest rates twice this year. Some investors will likely reduce their holdings in US government bonds and increase their investments in stock assets. However, it cannot be completely ruled out that a significant part of these funds will be used to purchase gold to hedge against inflation and a US budget crisis.
For this reason, even an interest rate cut does not guarantee that the US Tech stock index will rise and reach a new all-time high.
US Tech technical analysis
The US Tech stock index broke through the uptrend’s support line after breaking below the 21,160.0 support level. While it is clear that the index is in a downtrend, it is too early to determine its duration. It could be a short-term correction ahead of a new rally.
Key US Tech levels to watch include:
- Resistance level: 20,505.0 – a breakout above this level may drive the index towards 21,050.0
- Support level: 19,480.0 – a breakout below the support level will signal a potential decline in the index towards 18,920.0
Summary
The US Tech stock index will remain in a downtrend, potentially declining to 18,920.0, but only if the price breaches the current support level at 19,480.0. With national debt servicing costs reaching record values since the foundation of the US, the Federal Reserve will be forced to lower the key rate twice this year. However, this does not necessarily mean an increase in the US Tech index, as investors will likely attempt to hedge against inflation and the looming budget crisis in the US.
Forecasts presented in this section only reflect the author’s private opinion and should not be considered as guidance for trading. RoboForex bears no responsibility for trading results based on trading recommendations described in these analytical reviews.