World indices overview: news from US 30, US 500, US Tech, JP 225, and DE 40 for 25 February 2025
The decline in global stock indices continues, but not all of them have formed a steady downtrend yet. Find out more in our analysis and forecast for global indices for 25 February 2025.
US indices forecast: US 30, US 500, US Tech
- Recent data: the preliminary Dallas Fed Manufacturing Index in the US was -8.3 points in February
- Market impact: industrial stocks may come under pressure
Fundamental analysis
Global stock indices declined as US President Donald Trump reiterated tariff threats against Mexico and Canada, fuelling concerns about global trade disputes. The issue of tariffs for the EU also remains on the agenda, with Europe poised to take retaliatory measures.
The sharp decline in the Dallas Fed Manufacturing Index to -8.3 points indicates worsening conditions in the manufacturing sector. This could put pressure on industrial and energy stocks. However, if the market interprets this data as a signal of a potential easing of the Federal Reserve policy, it could partially support the stock market.
US 30 technical analysis
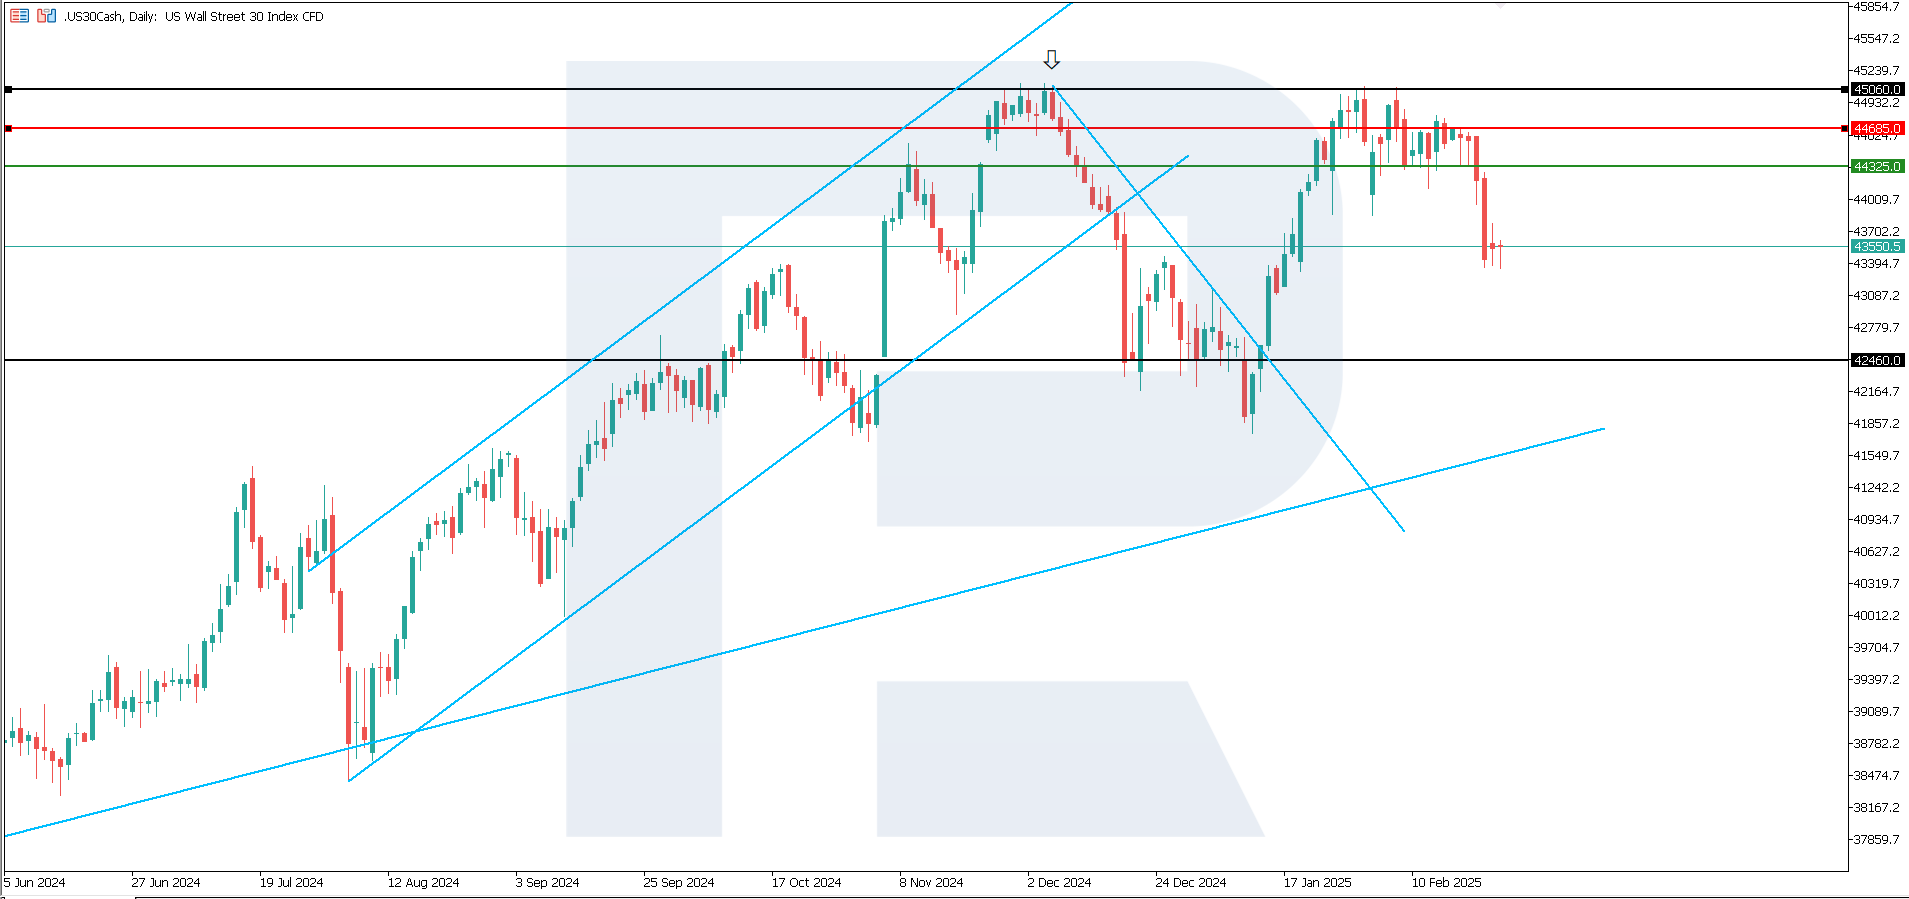
The US 30 stock index broke below the 44,325.0 support level, with a new one yet to form. The US 30 technical analysis shows the beginning of a correction, which will highly likely evolve into a downtrend.
The following scenarios are considered for the US 30 price forecast:
- Pessimistic US 30 forecast: if the price consolidates below the previously breached support level at 44,325.0, the index could fall to 42,460.0
- Optimistic US 30 forecast: a breakout above the 44,685.0 resistance level could drive the index to 45,410.0
US 500 technical analysis
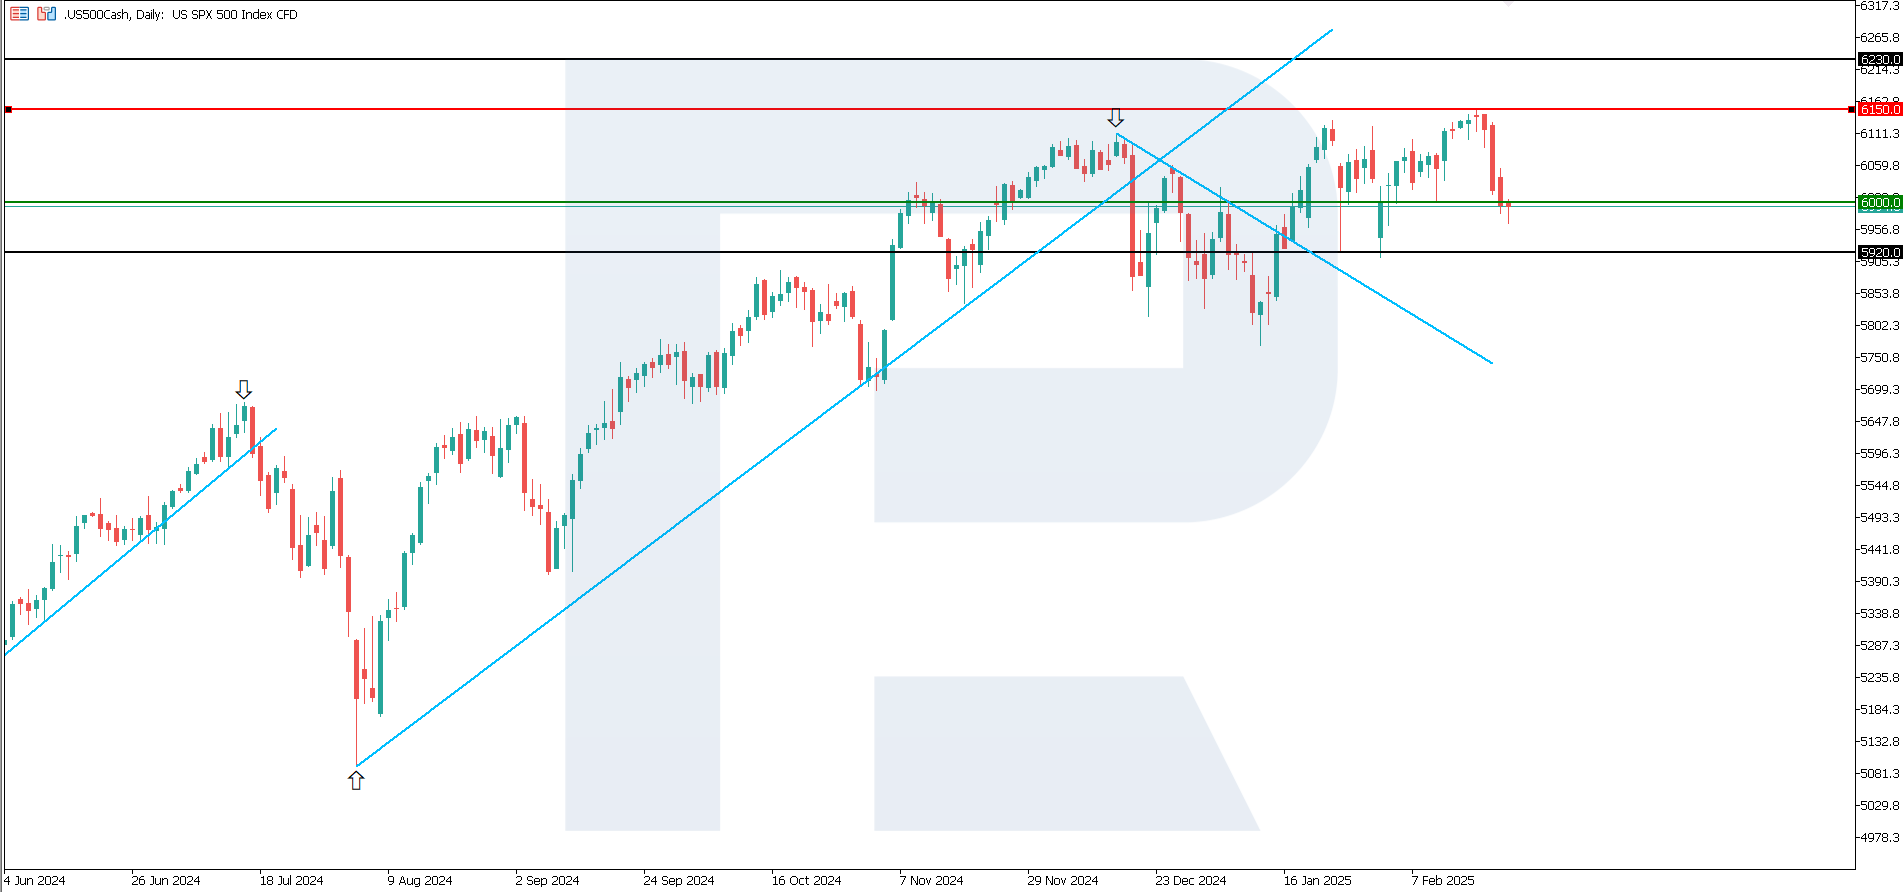
Since the US 500 stock index broke below the 6,000.0 support level, the resistance level has shifted to 6,150.0. According to the US 500 technical analysis, the downtrend will likely begin, with a downside target at 5,920.0.
The following scenarios are considered for the US 500 price forecast:
- Pessimistic US 500 forecast: if the price consolidates below the previously breached support level at 6,000.0, the index could plunge to 5,920.0
- Optimistic US 500 forecast: a breakout above the 6,150.0 resistance level could propel the index to 6,230.0
US Tech technical analysis
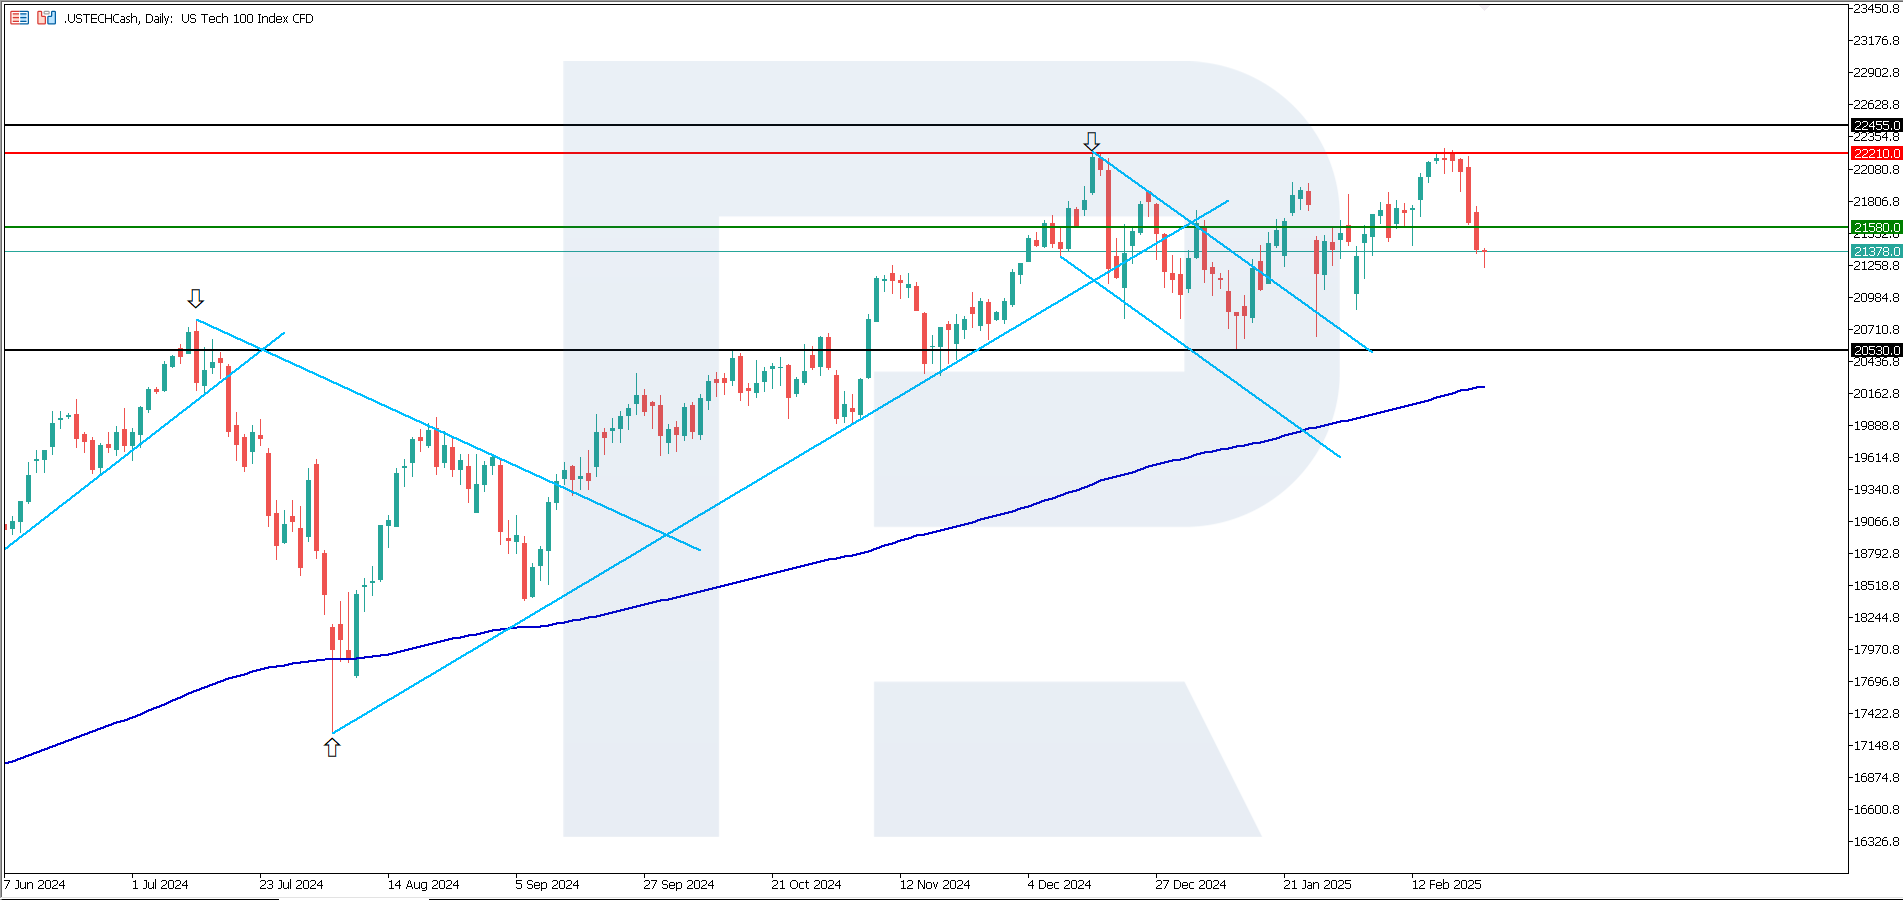
The US Tech stock index tumbled below the 21,580.0 support level, signalling the beginning of a corrective decline. Subsequently, a downtrend could form, with a downside target at 20,530.0.
The following scenarios are considered for the US Tech price forecast:
- Pessimistic US Tech forecast: if the price consolidates below the 21,580.0 support level, the index could fall to 20,530.0
- Optimistic US Tech forecast: a breakout above the 22,210.0 resistance level could boost the index to 22,455.0
Asian index forecast: JP 225
- Recent data: in an annual letter, Berkshire Hathaway CEO Warren Buffett said he plans to increase investments in Japanese companies
- Market impact: growing demand from foreign investors positively impacts the Japanese stock market
Fundamental analysis
Warren Buffett is one of the world’s most respected investors, and his decisions are often perceived as a signal of confidence in the country’s economy. This is particularly important amid the Bank of Japan’s current monetary policy, which is gradually shifting to tightening after a long period of low rates.
Other investment houses may follow suit. Falling demand for Japanese stocks from non-residents was one of the challenges for the further development of the country’s economy. Investors will closely follow the BoJ’s further moves in the future.
JP 225 technical analysis
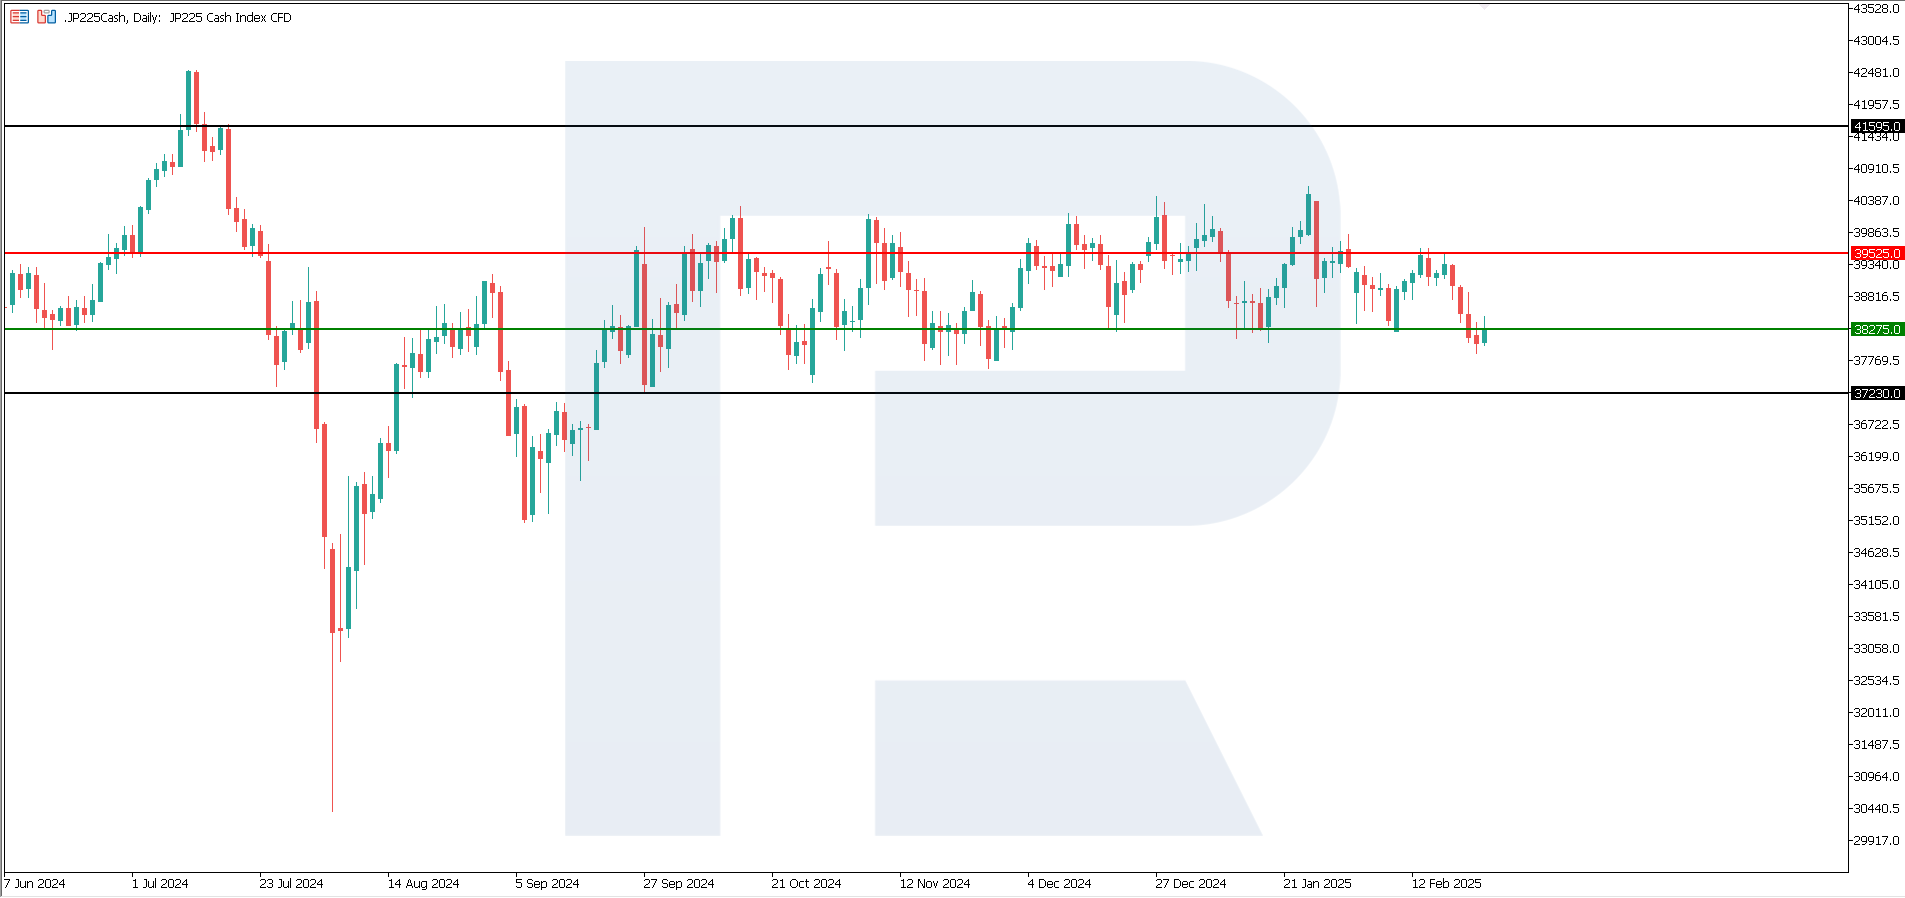
The JP 225 stock index broke below the 38,275.0 support level. The index has left the sideways channel for the first time in a long period. It is difficult to say for now that this is the beginning of a new downtrend, rather than a change in the boundaries of the sideways channel.
The following scenarios are considered for the JP 225 price forecast:
- Pessimistic JP 225 forecast: if the price consolidates below the previously breached support level at 38,275.0, the index could plunge to 37,230.0
- Optimistic JP 225 forecast: a breakout above the 39,525.0 resistance level could propel the index to 41,595.0
European index forecast: DE 40
- Recent data: Germany’s annual GDP declined by 0.2% in 2024
- Market impact: the news confirms a slowdown of the German economy but does not yet create a strong crisis sentiment in the market
Fundamental analysis
The report confirms the downturn in the German economy but without shocking deviations from forecasts. Although annual GDP decreased by 0.2%, this is better than the previous quarter (0.3%), indicating some slowdown in the pace of decline. Since actual data aligned with forecasts, the market could have already priced in these figures.
Industrial companies may come under pressure as weak GDP signals problems in the German economy. The financial sector may also suffer since a weak economy reduces lending activity. If the GDP slowdown heightens expectations that the ECB is ready to cut rates in 2025, it will support the stock market.
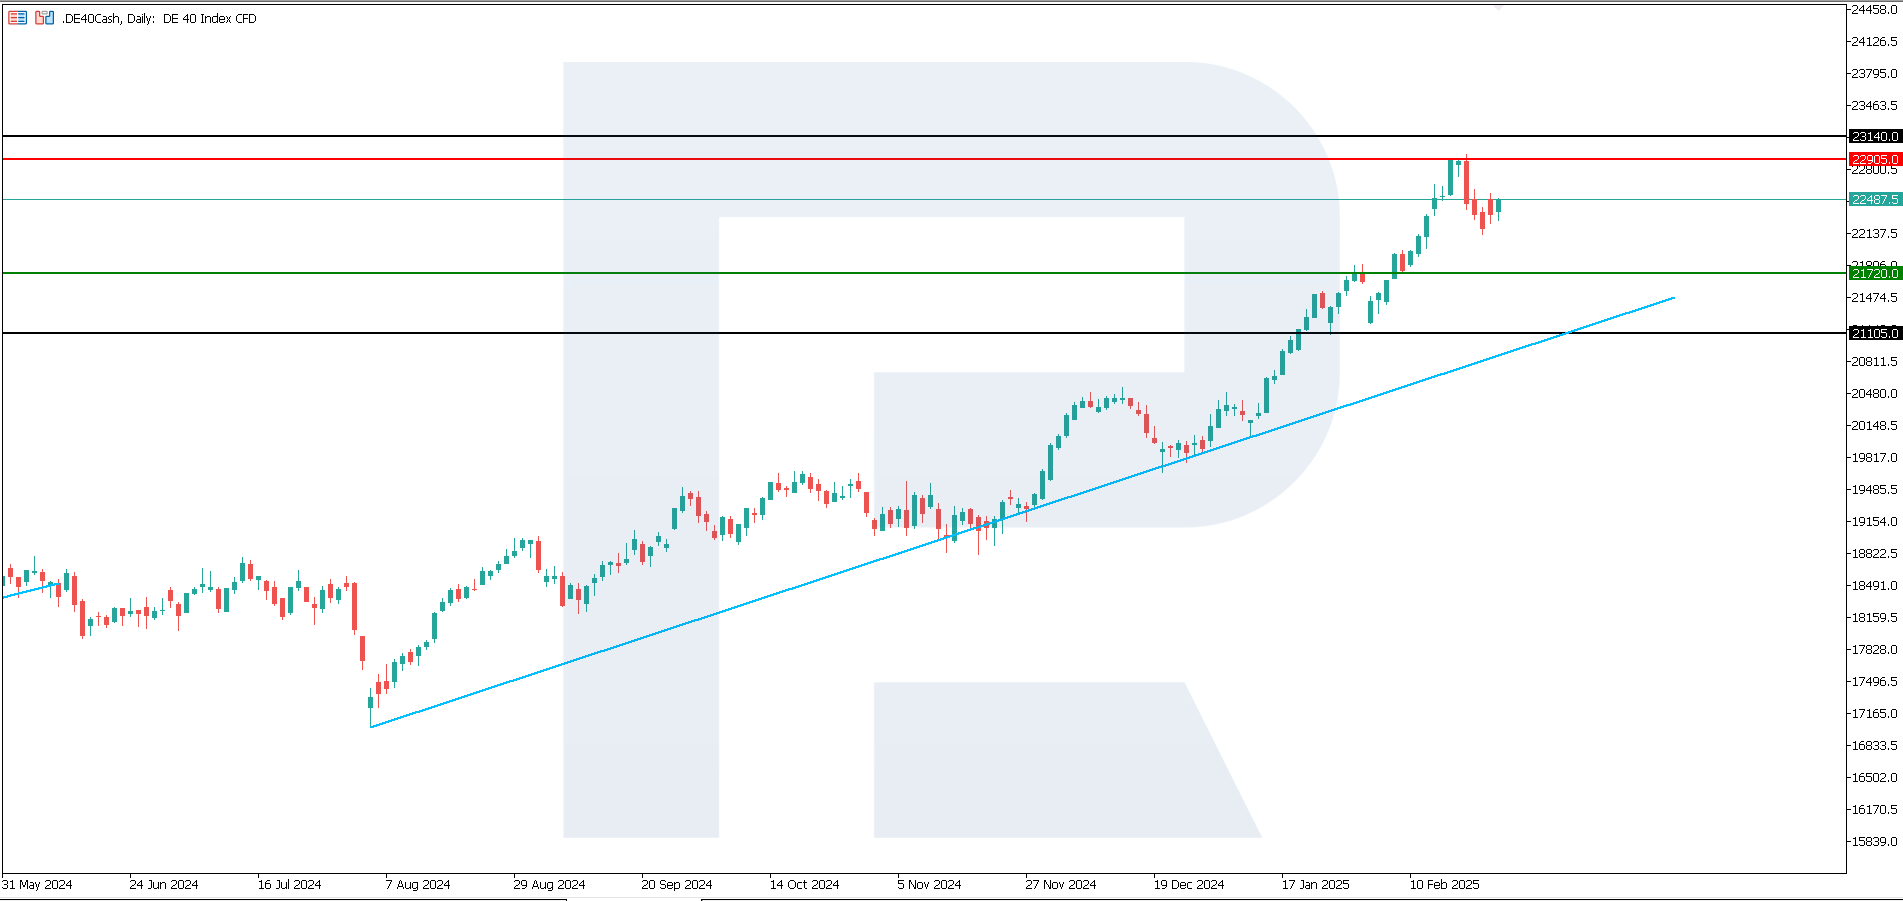
DE 40 technical analysis
Following a 3.52% correction, the DE 40 stock index remains in an uptrend. The quotes will likely trade in a sideways channel between the current resistance and support levels. According to the DE 40 technical analysis, the index will likely rise further.
The following scenarios are considered for the DE 40 price forecast:
- Pessimistic DE 40 forecast: a breakout below the 21,720.0 support level could send the index down to 21,105.0
- Optimistic DE 40 forecast: a breakout above the 22,905.0 resistance level could propel the index to 23,140.0
Summary
The US stock indices have gone into a correction, which will likely transform into a downtrend. The Japanese JP 225 index has left the sideways channel, while the German DE 40 is the only one to remain in the uptrend despite a significant correction by 3.52%. The US labour market data will determine further trends in the indices.
Forecasts presented in this section only reflect the author’s private opinion and should not be considered as guidance for trading. RoboForex bears no responsibility for trading results based on trading recommendations described in these analytical reviews.