US 500 analysis: index poised to reach new peaks
The US 500 stock index is in a strong uptrend and has the potential for further growth; there are no signs of a possible correction. The US 500 forecast for next week is positive.
US 500 forecast: key trading points
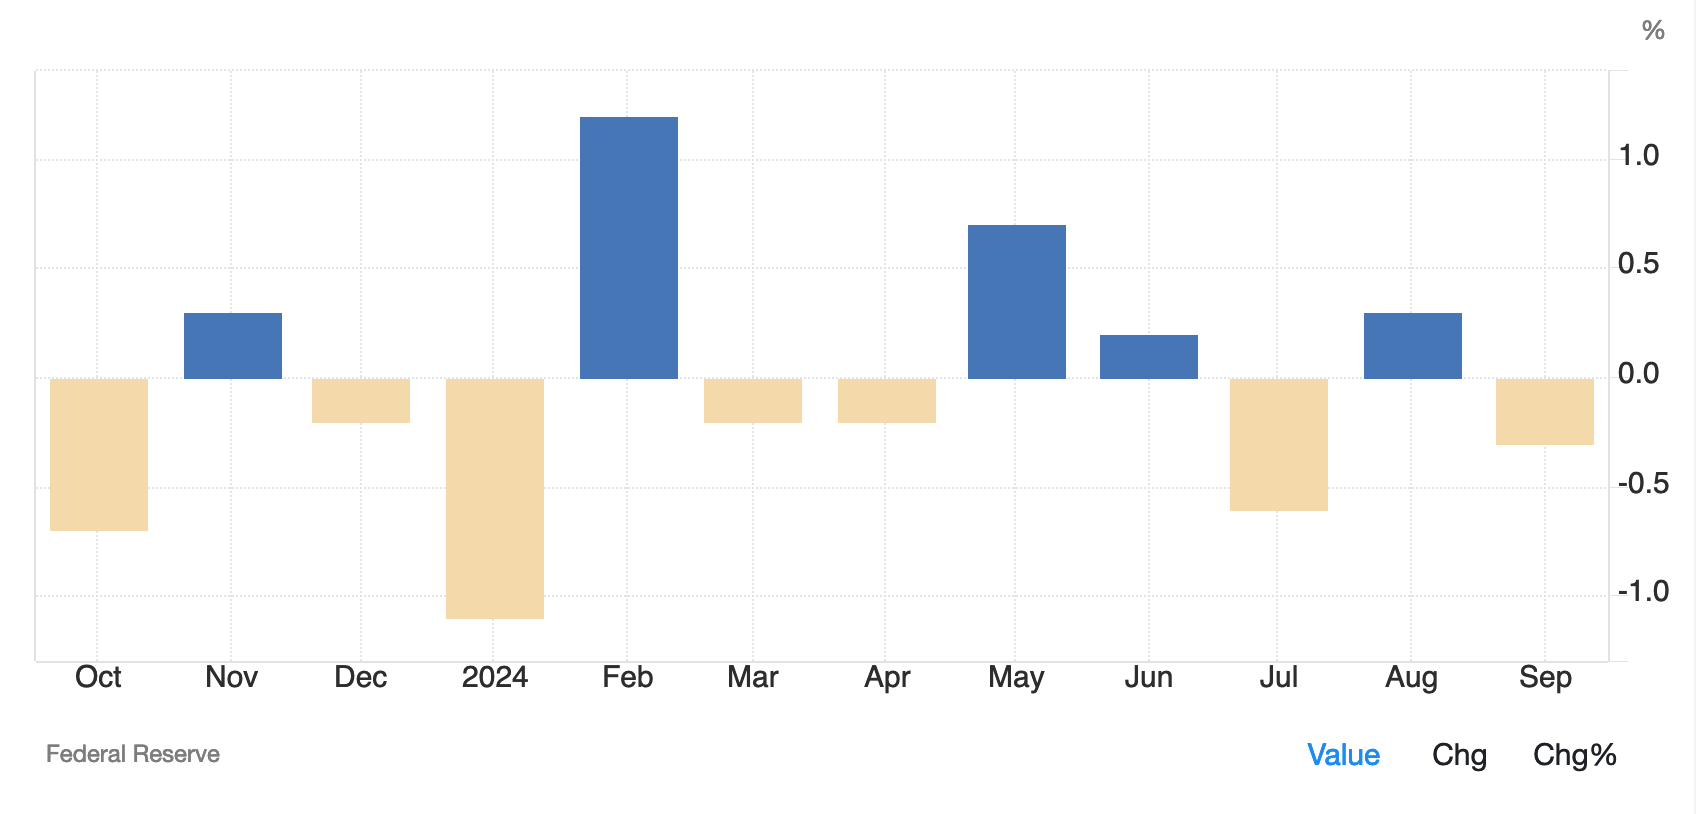
- Recent data: US industrial production decreased by 0.3% in September from the August reading
- Economic indicators: industrial production measures the total output in this segment
- Market impact: for market participants, this indicator is a gauge of future economic growth
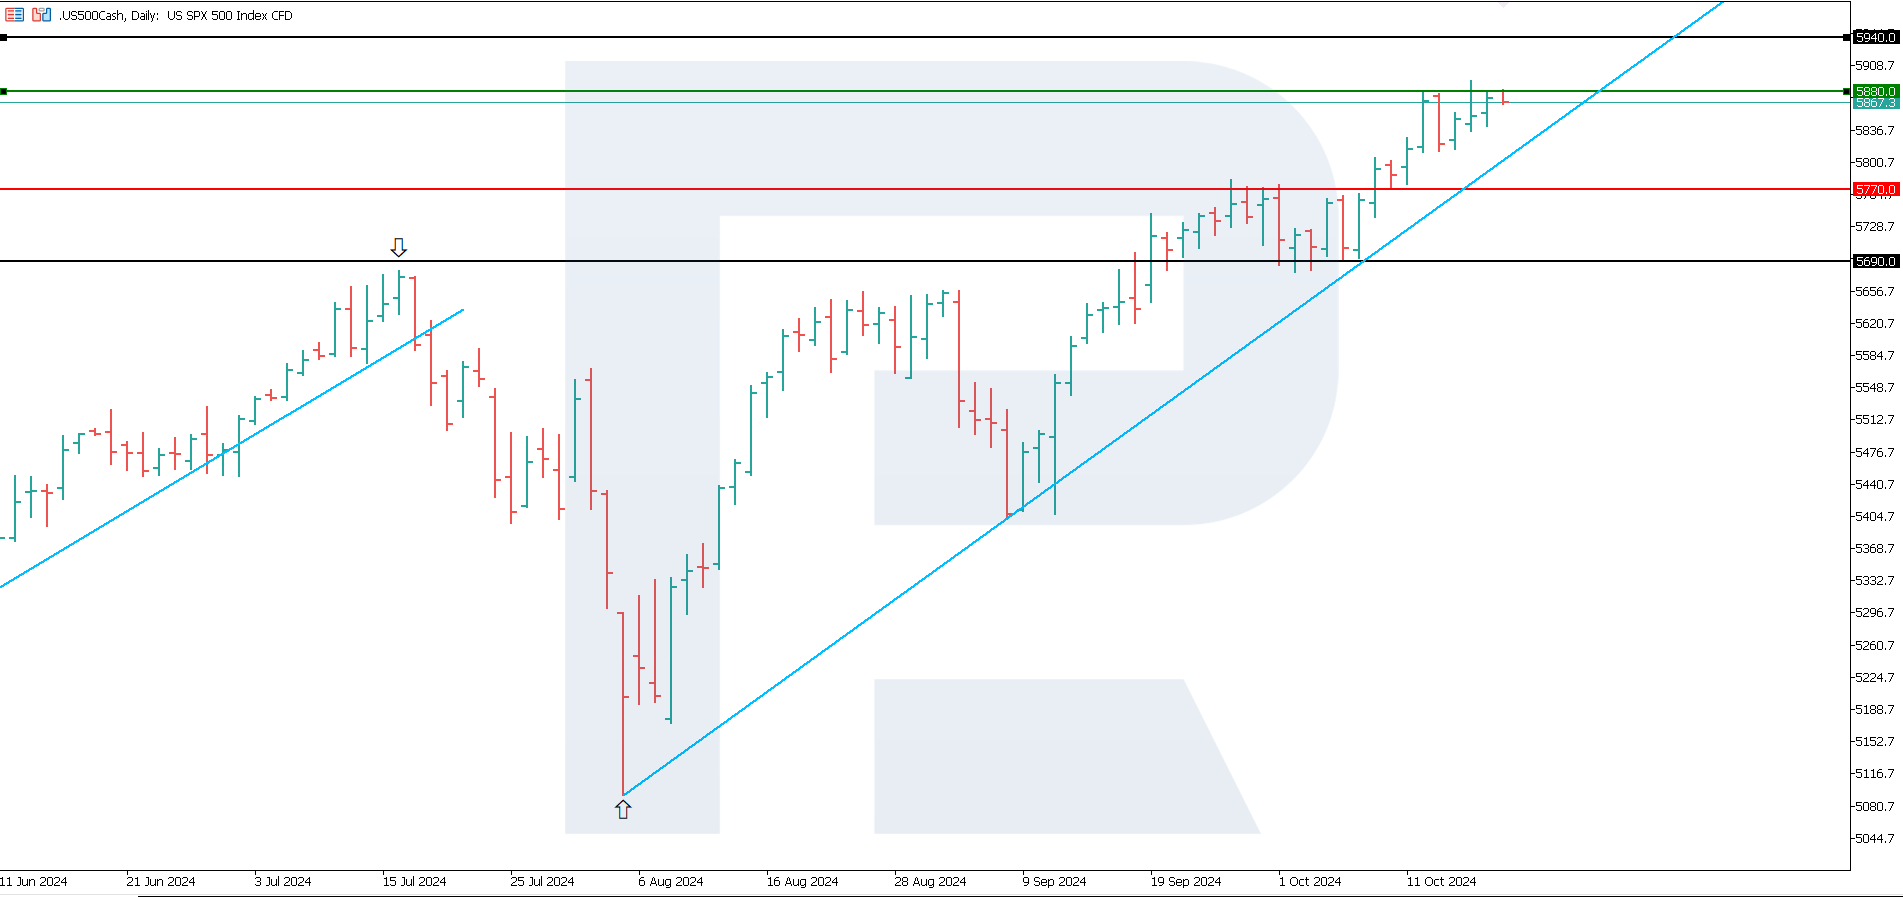
- Resistance: 5,880.0, Support: 5,770.0
- US 500 price forecast: 5,940.0
Fundamental analysis
US industrial production fell to -0.3% m/m in September, falling short of expectations (-0.1%). Last month’s figure was +0.8% (+0.3%). Industrial production shows the total output in this sector, including the manufacturing sector, mining, and utility services.
Source: https://tradingeconomics.com/united-states/industrial-production-mom
A 0.3% decline in industrial production indicates a slowdown in industrial activity, pointing to reduced demand, supply chain issues, and deterioration in other economic factors. Companies that depend on domestic demand and production volumes may report lower revenue, adversely impacting their stock prices.
A downturn in industrial production may be perceived as a signal for the Federal Reserve to revise monetary policy. If it persists for a long time, the US Fed may opt for more decisive policy easing, which will positively affect the stock market in the long term. The US 500 index forecast is positive.
US 500 technical analysis
The US 500 stock index is in an uptrend and continues to hit all-time highs. According to the US 500 technical analysis, a corrective decline is only possible if the quotes secure below 5,805.0. A breakout above the 5,880.0 resistance level will signal further growth.
The following scenarios are considered for the US 500 price forecast:
- Pessimistic US 500 forecast: a breakout below the 5,770.0 support level could send the index down to 5,690.0
- Optimistic US 500 forecast: a breakout above the 5,880.0 resistance level could propel the price to 5,940.0
Summary
US industrial production fell by 0.3% (m/m) in September. If the slowdown persists, the US Federal Reserve may start easing its monetary policy more decisively, positively influencing the stock market in the long term. A breakout above the 5,880.0 resistance level will signal further growth, with the target at 5,940.0.
Forecasts presented in this section only reflect the author’s private opinion and should not be considered as guidance for trading. RoboForex bears no responsibility for trading results based on trading recommendations described in these analytical reviews.


