US 500 forecast: the index enters downtrend
After reaching its all-time high, the US 500 has entered a downtrend. The US 500 forecast for today is positive.
US 500 forecast: key takeaways
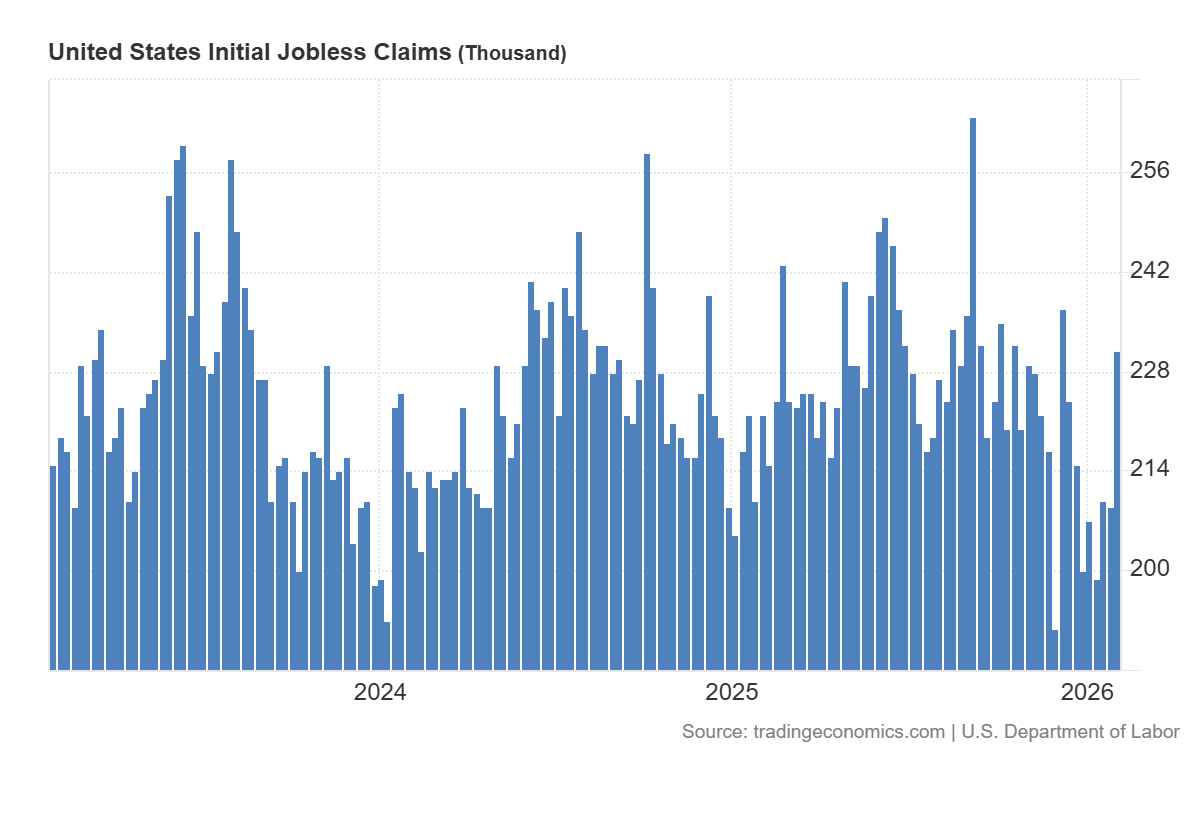
- Recent data: US initial jobless claims totalled 231 thousand last week
- Market impact: the data has a negative impact on the equity market
US 500 fundamental analysis
The release of US initial jobless claims (231 thousand versus a forecast of 212 thousand and 209 thousand the previous week) provides a moderately negative short-term signal for the US 500 index, as it points to a more noticeable cooling of the labour market than the consensus expectation. At the same time, it is important to consider the scale: the level of claims remains below crisis levels and closer to the historically normal range. Therefore, this does not look like a sign of a sharp economic deterioration, but rather a signal of a gradual slowdown.
For the US 500 index, the key factor in such conditions is typically the reaction of expectations regarding the Fed’s interest rate. If the market interprets the increase in claims as a factor reducing the likelihood of further monetary tightening, some of the negative impact on stocks may be offset through lower bond yields and improved valuations of companies’ future cash flows.
US 500 technical analysis
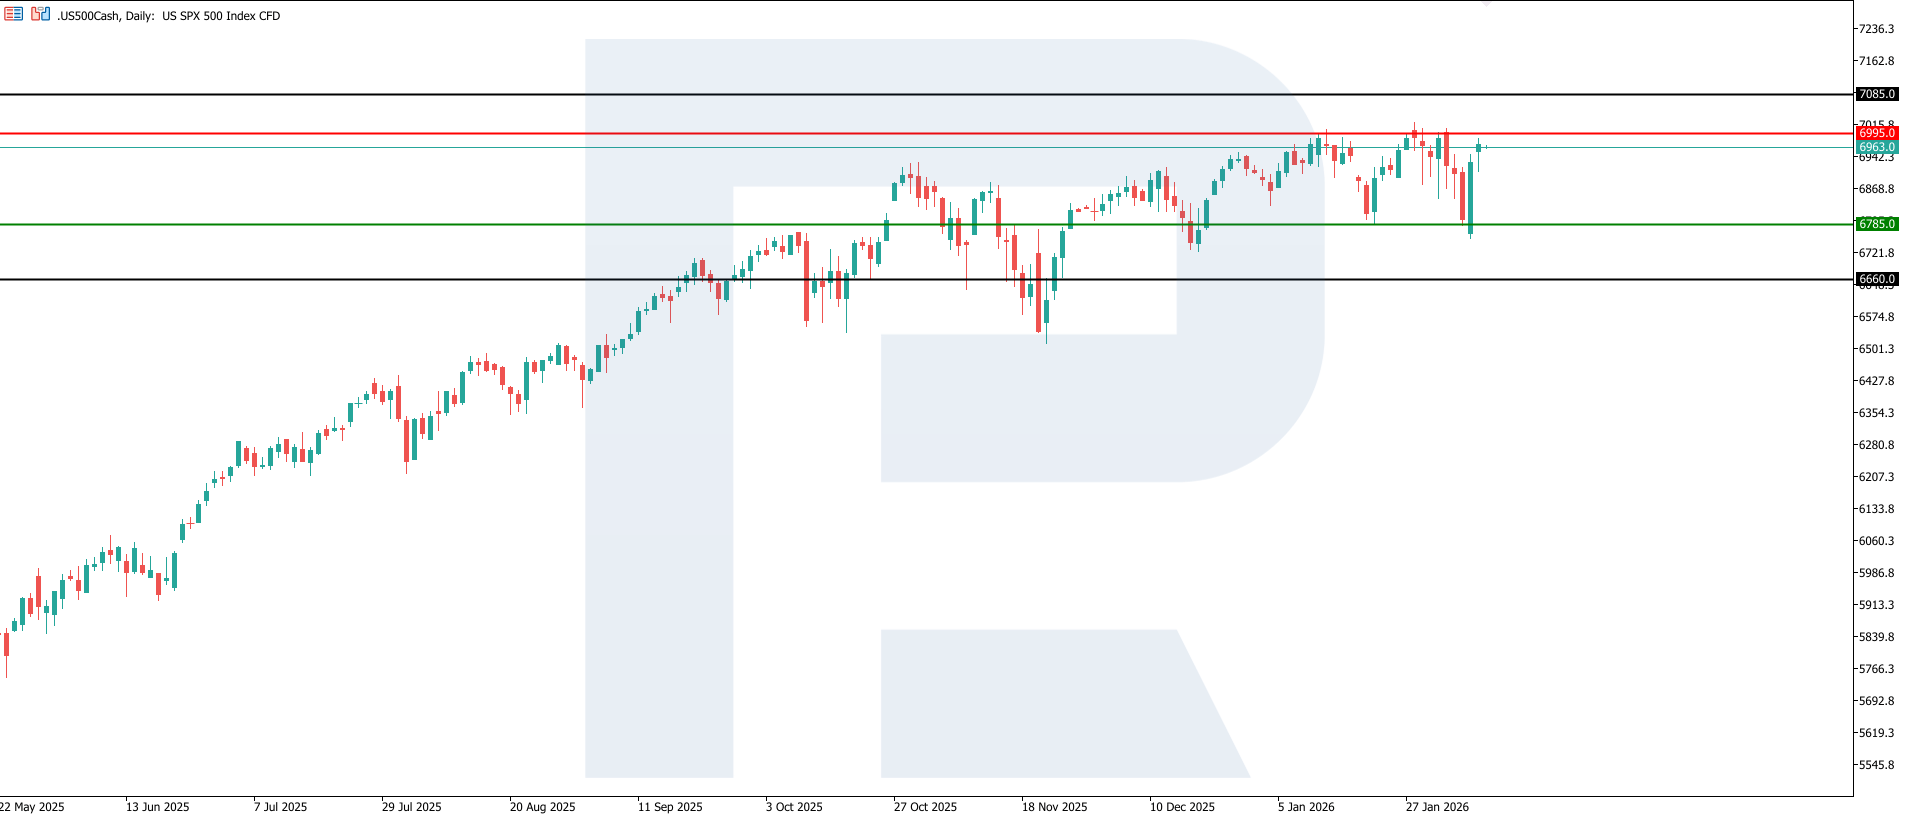
The US 500 index has formed a support level at 6,785.0 and a resistance level at 6,995.0. The index sees increased volatility: after the trend shifted to the downside, prices began to correct actively and approached the resistance level. At the same time, the potential downside target is located near 6,660.0.
The US 500 price forecast considers the following scenarios:
- Pessimistic US 500 forecast: a breakout below the 6,785.0 support level could send the index down to 6,660.0
- Optimistic US 500 forecast: a breakout above the 6,995.0 resistance level could boost the index to 7,085.0
Summary
For the US 500 index, these statistics suggest a likely increase in short-term volatility and greater sectoral differentiation in investor behaviour. Subsequent labour market and inflation releases will be decisive for further interpretation, as they should confirm or refute the sustainability of the identified momentum. From a technical perspective, the US 500 index may rise to 7,085.0.
Editors’ picks
 EURUSD 2026-2027 forecast: key market trends and future predictions
This article provides the EURUSD forecast for 2026 and 2027 and highlights the main factors determining the direction of the pair’s movements. We will apply technical analysis, take into account the opinions of leading experts, large banks, and financial institutions, and study AI-based forecasts. This comprehensive insight into EURUSD predictions should help investors and traders make informed decisions.
 Gold (XAUUSD) forecast 2026 and beyond: expert insights, price predictions, and analysis
Dive deep into the Gold (XAUUSD) price outlook for 2026 and beyond, combining technical analysis, expert forecasts, and key macroeconomic factors. It explains the drivers behind gold’s recent surge, explores potential scenarios including a move toward 4,500 to 5,000 USD per ounce, and highlights why the metal remains a strong hedge during global uncertainty.
Forecasts presented in this section only reflect the author’s private opinion and should not be considered as guidance for trading. RoboForex bears no responsibility for trading results based on trading recommendations described in these analytical reviews.