Japanese Candlesticks Analysis 18.06.2014 (EUR/USD, USD/JPY)
18.06.2014
Analysis for June 18th, 2014
EUR USD, “Euro vs US Dollar”
At H4 chart of EURUSD correctional phase within bearish trend is possibly continuing. Window has provided support. Three-Line break indicates downtrend, Heiken Ashi candlesticks indicate correction to this downtrend.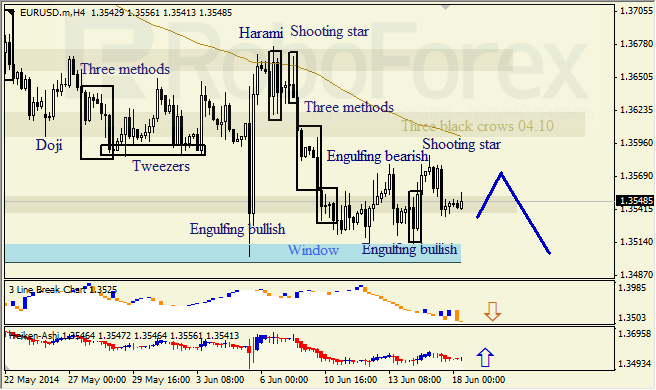
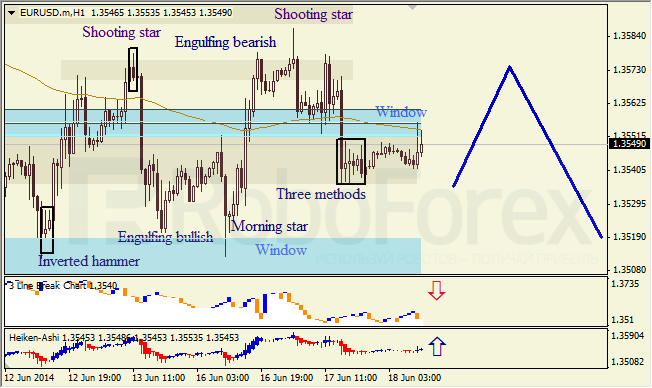
At H1 chart of EURUSD upper Window is considered to be a resistance area. Three-Line break chart and Three methods shows bearish destination. Heiken Ashi candlesticks confirm bullish pullback.
USD JPY, “US Dollar vs Japanese Yen”
H4 chart of USDJPY indicates bullish continuation pattern «Three methods». Three-Line break and Heiken Ashi candlesticks confirm ascending destination.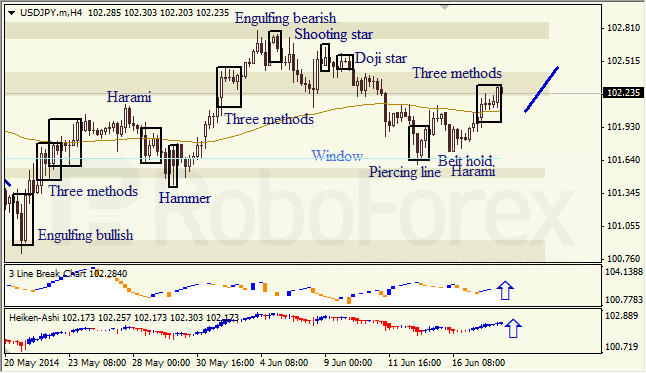
RoboForex Analytical Department
Attention!
Forecasts presented in this section only reflect the author’s private opinion and should not be considered as guidance for trading. RoboForex bears no responsibility for trading results based on trading recommendations described in these analytical reviews.