Japanese Candlesticks Analysis 25.06.2014 (EUR/USD, USD/JPY)
25.06.2014
Analysis for June 25th, 2014
EUR USD, “Euro vs US Dollar”
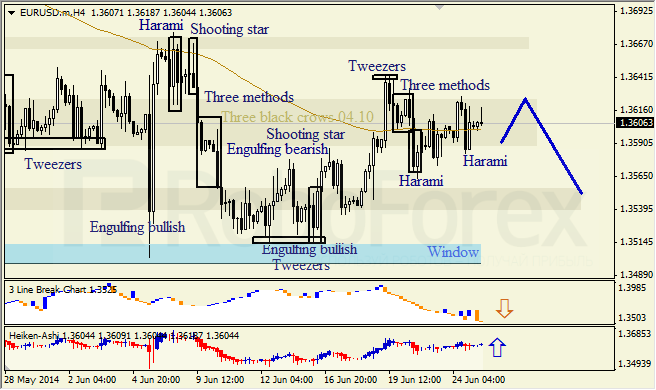
At H4 chart of EURUSD we see sideways correctional phase after Harami. Three-Line break indicates downtrend, Heiken Ashi candlesticks and bullish Harami indicate correction to this downtrend.
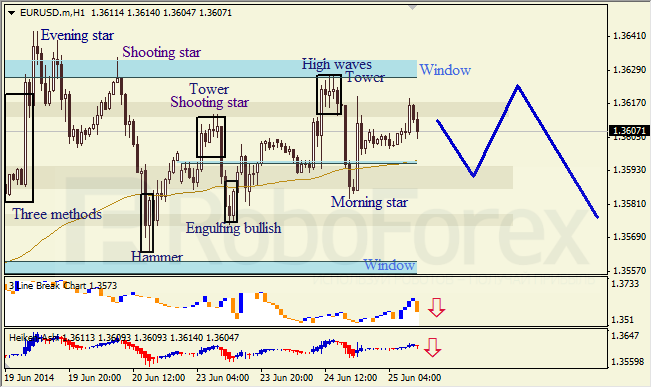
At H1 chart of EURUSD upper Window is considered to be a resistance area, medium Window can provide support. Three-Line break chart and Heiken Ashi candlesticks confirm bearish destination.
USD JPY, “US Dollar vs Japanese Yen”
H4 chart of USDJPY indicates sideways action, candlestick patterns are ambiguous. Three-line break and Heiken Ashi candlesticks confirm descending trend.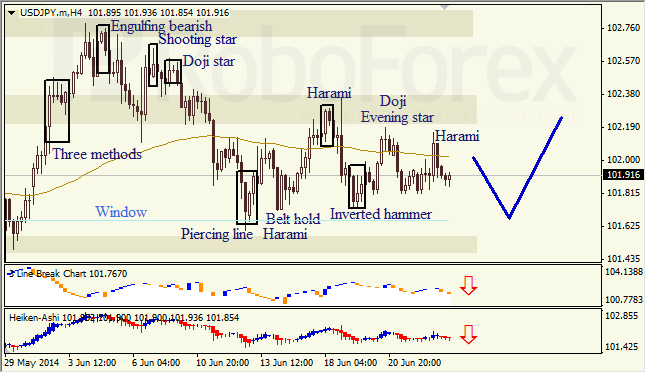
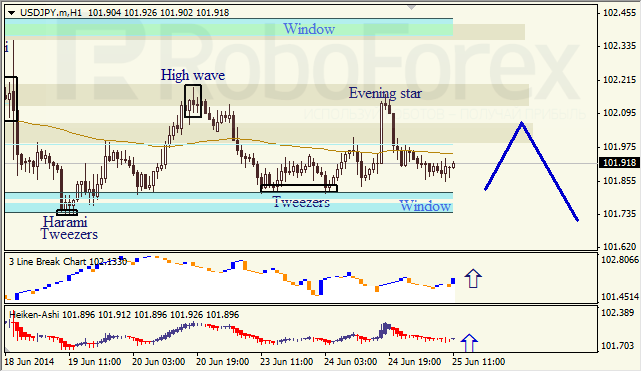
At H1 chart, lower Window can provide support. Three-Line break and Heiken Ashi candlesticks confirm ascending trend.
RoboForex Analytical Department
Attention!
Forecasts presented in this section only reflect the author’s private opinion and should not be considered as guidance for trading. RoboForex bears no responsibility for trading results based on trading recommendations described in these analytical reviews.