Japanese Candlesticks Analysis 27.06.2014 (EUR/USD, USD/JPY)
27.06.2014
Analysis for June 27th, 2014
EUR USD, “Euro vs US Dollar”
At H4 chart of EURUSD, trend was resumed after bullish «Harami». «Three-Line break» indicates descending correctional move, Heiken Ashi candlesticks confirm bullish destination.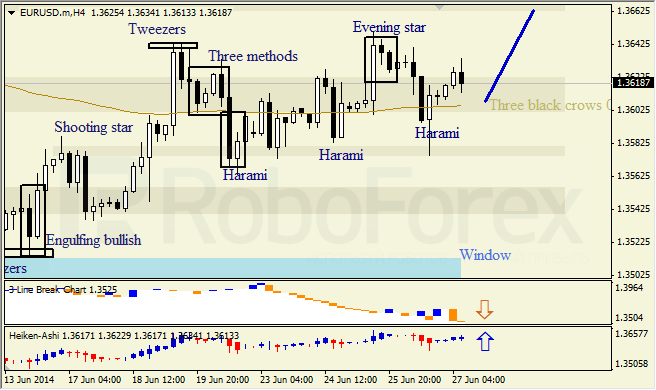
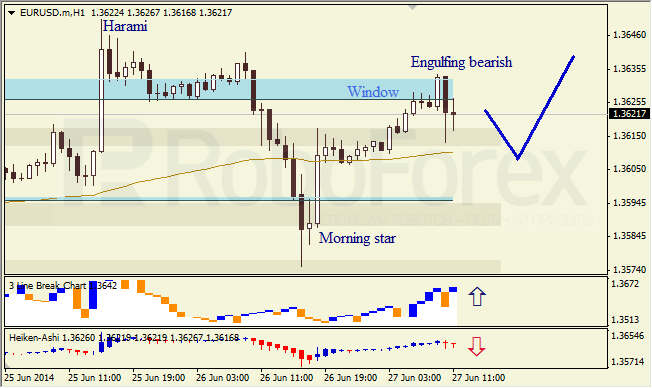
At H1 chart of EURUSD, we see bearish «engulfing pattern» located near upper Window that indicates descending move. «Three-Line break» indicates bullish trend, Heiken Ashi candlesticks confirm bearish correction.
USD JPY, “US Dollar vs Japanese Yen”
H4 chart of USDJPY trend is probably bearish, Windows is broken out to the downside and considered to be a resistance. «Three-Line break» and Heiken Ashi candlesticks confirm descending destination.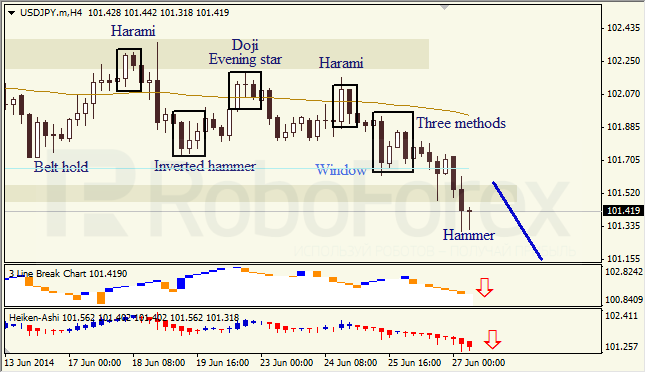
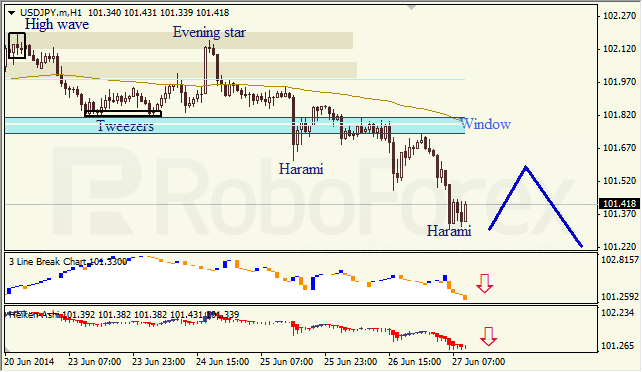
At H1 chart, Window is considered to be a resistance, Three-Line break chart and Heiken Ashi candlesticks confirm descending trend, bullish Harami indicates possibility of ascending correction.
RoboForex Analytical Department
Attention!
Forecasts presented in this section only reflect the author’s private opinion and should not be considered as guidance for trading. RoboForex bears no responsibility for trading results based on trading recommendations described in these analytical reviews.