Forex Technical Analysis 2012/23/02 (EUR/USD, NZD/USD, GOLD, OIL) Forecast FX
22.02.2012
Forecast for February 23rd, 2012
EUR/USD
The EUR/USD currency pair is moving according to our forecast. At the moment the RSI indicator is testing the trend’s descending line, we should expect it to rebound from the line and start moving downwards. The target of the fall is the area of 1.2950, one can consider selling the pair with the tight stop. If the price breaks the upper border and leaves the channel, this case scenario will be cancelled.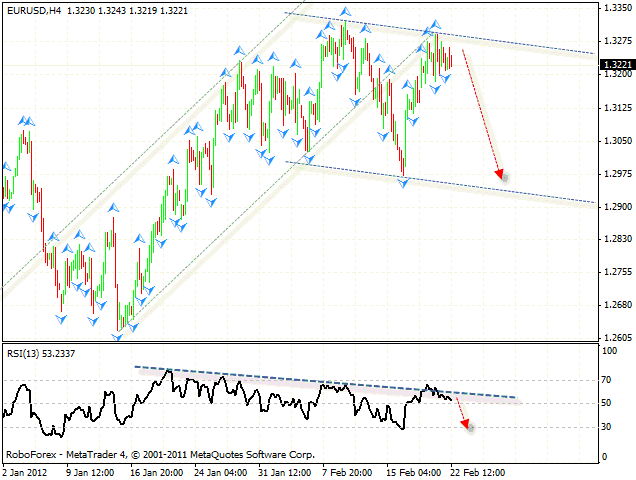
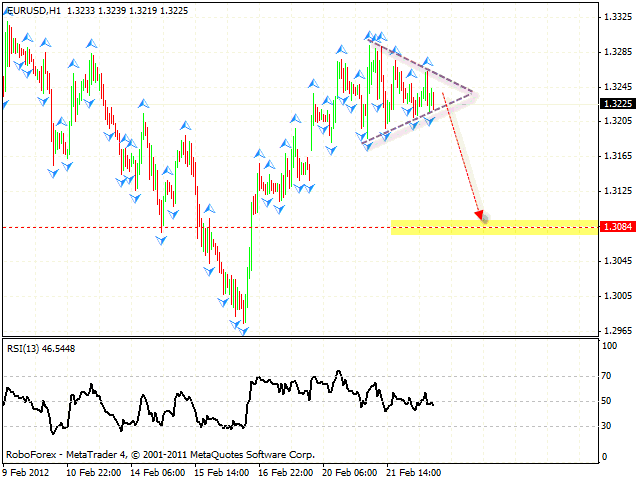
At the H1 chart the price is forming “triangle” pattern. The pattern is expected to be broken downwards, so one can consider opening positions in this very direction. The closest target of the fall is the area of 1.3084.
NZD/USD
New Zealand Dollar continues moving according to the forecast, at the moment we should expect the price to test the level of 0.8080. One can consider selling the pair with the tight stop. If the price breaks the level of 0.8410, this case scenario will be cancelled. We recommend you to increase the amount of short positions only after the pair breaks the level of 0.8255.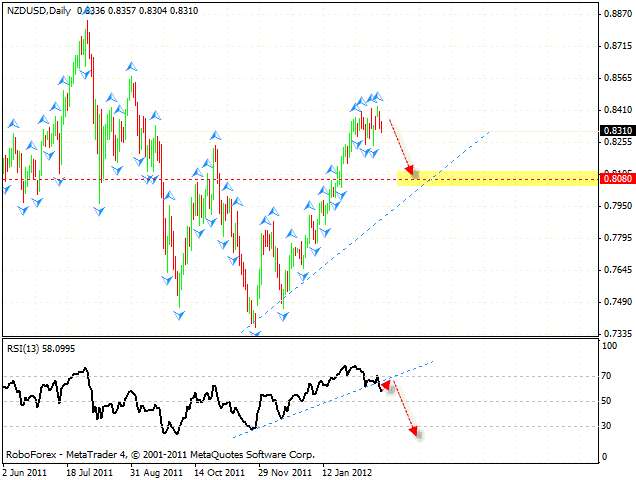
GOLD
At the daily chart of Gold we have “failure swing” reversal pattern forming at the RSI. The target of the pattern is the area of 1719. One can consider selling the instrument with the tight stop. The next target of the fall may be the channel’s lower border.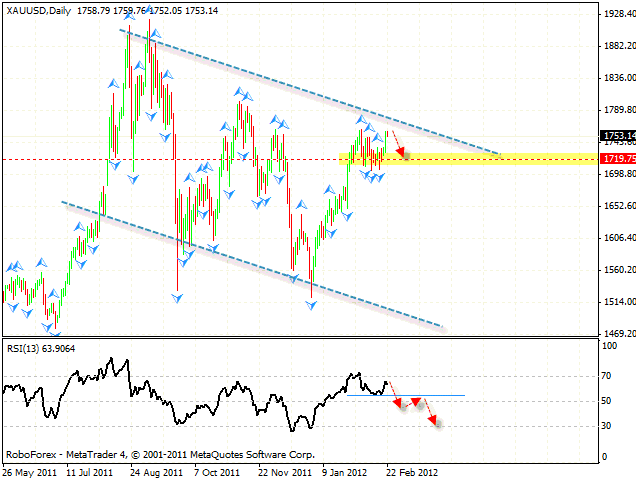
OIL
At the daily chart the RSI indicator faced the resistance from the trend’s descending line, we should expect it to rebound from the line and start falling down. The target of the fall is the area of 97.20.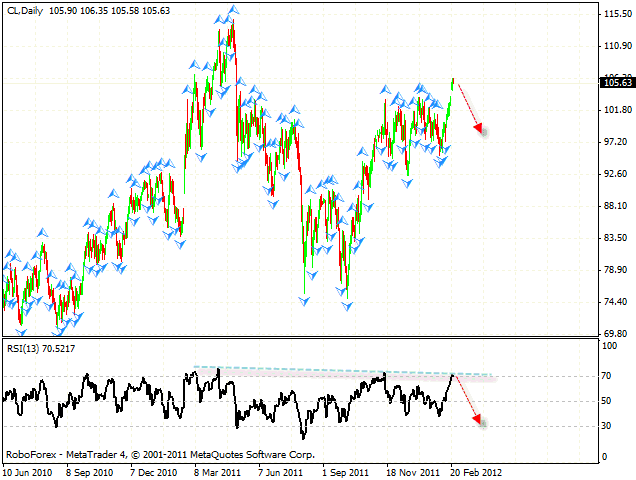
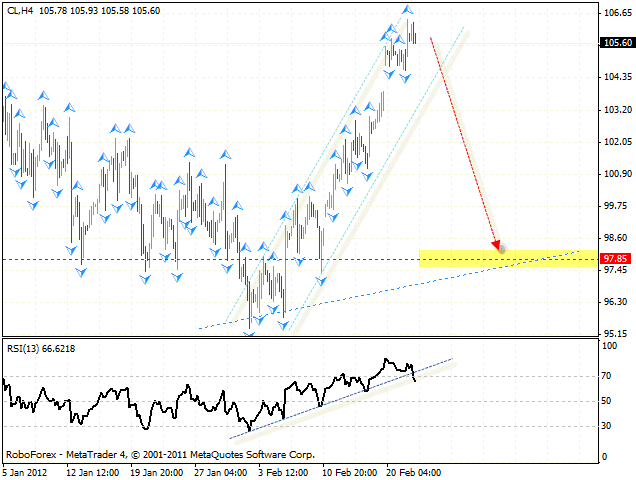
At the H4 chart of Oil the RSI indicator broke the trend’s rising line, we should expect the price to start falling down. One can consider selling the instrument after the price breaks the channel’s lower border. The target of the fall is the area of 97.85.
Attention!
Forecasts presented in this section only reflect the author’s private opinion and should not be considered as guidance for trading. RoboForex bears no responsibility for trading results based on trading recommendations described in these analytical reviews.