Forex Technical Analysis 2011/19/08 (EUR/USD, GBP/USD, S&P500, OIL) Forecast FX
18.08.2011
Forecast for August 19th, 2011
EUR/USD
At the daily chart the EUR/USD currency pair keeps testing the descending channel’s upper border. At the moment one can try to sell the pair with the tight stop above 1.4425. The closest target of the fall is the rising trend’s line. The price breaking the trend’s rising line at the RSI is an additional signal to sell the pair. But if Euro grows higher than 1.4530, this case scenario will be cancelled.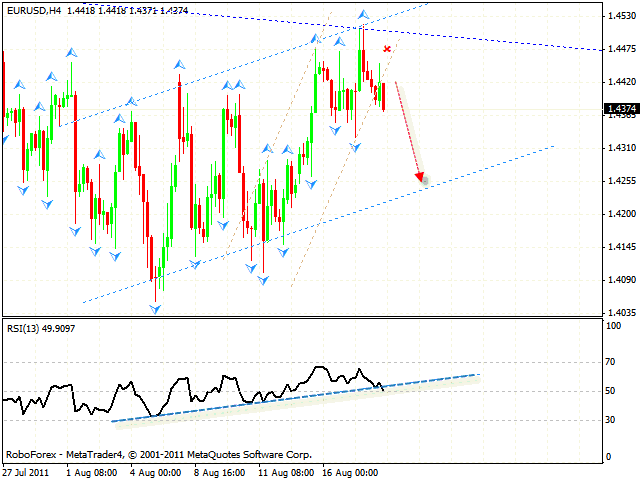
GBP/USD
Pound faced the resistance from the trend’s descending line at the RSI, we should expect the price to rebound from it and start moving downwards. The closest target of the fall is the rising channel’s lower border. One can try the tight stop sales. If the price breaks the trend’s line at the RSI, this case scenario will be cancelled.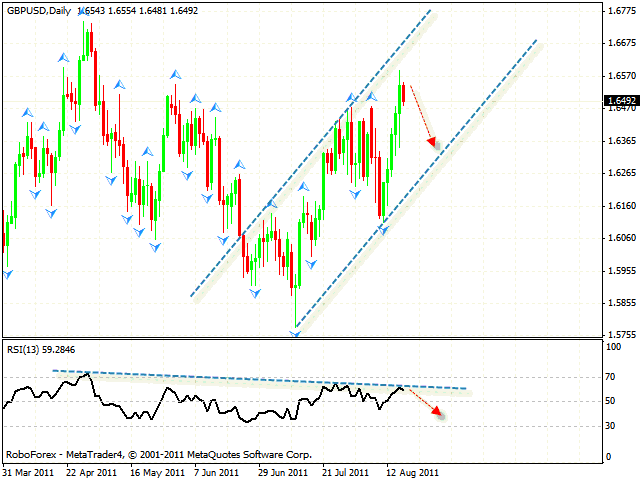
S&P 500
At the daily chart of S&P 500 Index we can see the formation of the descending pattern. Currently the Index is being corrected. We should expect the start of the descending movement with the target in the area of 1070 after the price breaks the rising channel’s lower border. The stop must be above 1215.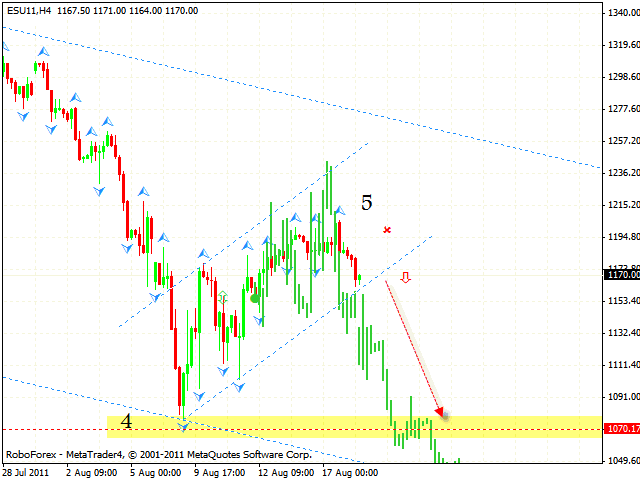
OIL
Oil also keeps falling down. The price is moving inside the descending channel. The target of the pattern is the area of 59.20. One can either consider selling the pair near the channel’s upper border, or wait until the price tests the trend’s descending line at the RSI. Only after that we should look for reversal signals at shorter periods of time.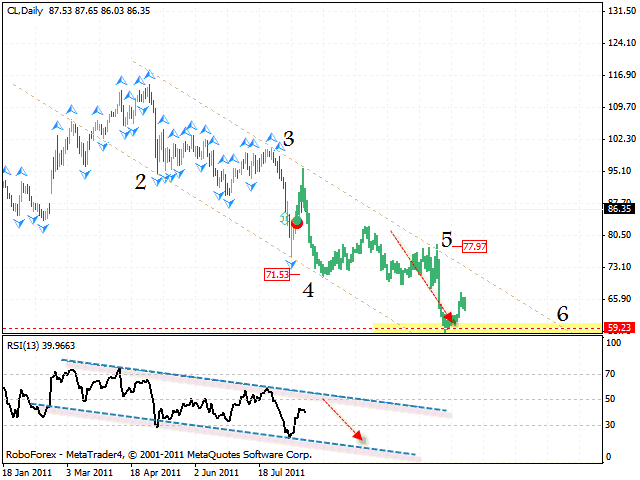
Attention!
Forecasts presented in this section only reflect the author’s private opinion and should not be considered as guidance for trading. RoboForex bears no responsibility for trading results based on trading recommendations described in these analytical reviews.