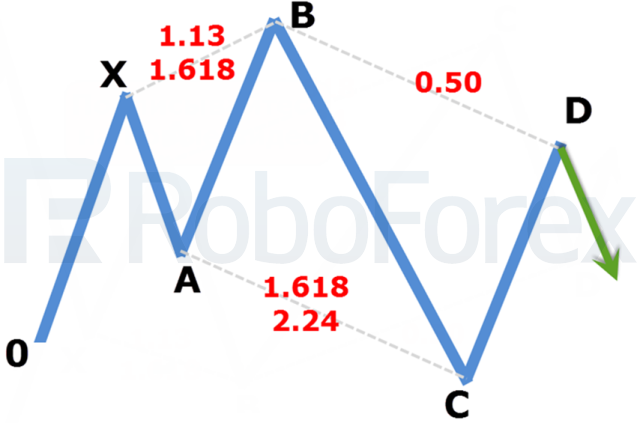
Bearish pattern "5-0" on the chart of USD/CAD
07.08.2014
On a daily chart of USDCAD we can observe that harmonic chart pattern "5-0" is developing.
For the present moment, price of USDCAD had achieved "selling area" and now it's possible to open positions with a pretty tight stop. The model itself is built in ideal way, according to all required rules.
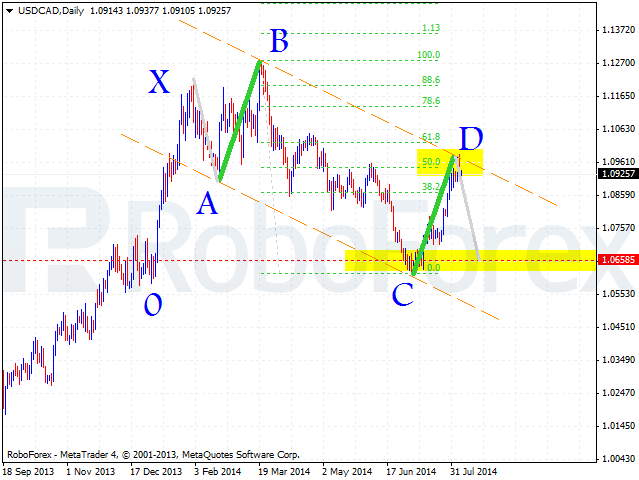
Point "B" is located on the level of projection 1.13. of XA, point C had tested required projection 1.618 from BC, point D is located on the level formed by 50% correction of BC. Beyond that, we observe almost equal moves AB and CD (in time and price measurement). This model is described by Bryce Gilmore and points that local low should be tested with further descending trend. To identify closest target for current decline, we can take XA move and project it from D point. Therefore we can expect synnetrical decline to 1.0655 area.
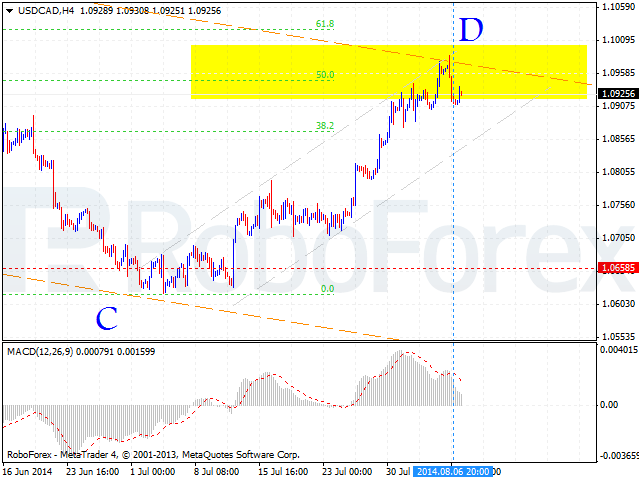
Additional signal for short positions is "Head and Shoulders" on MACD, in most cases such patterns work quickly and accurately. Here we have already seen signal for short when signal line has emerged from indicator's histogram.
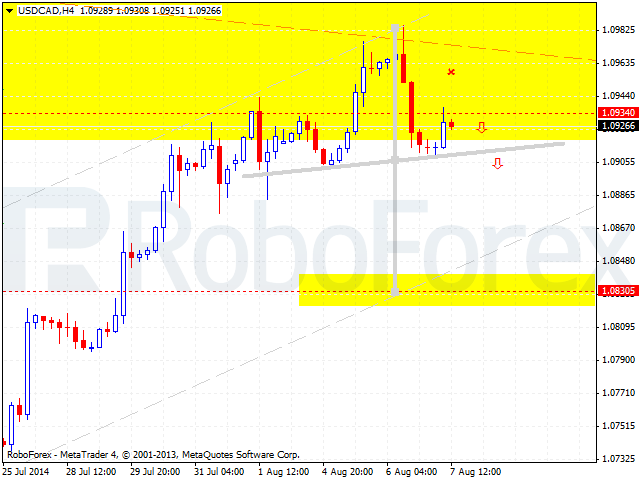
Even if we look at this chart, we can find a reversal pattern. If acting aggressively, we can try to sell from the "shoulder" and add to short positions when "neck" line is violated. Of we can trade conservatively and wait for breakout of 1.0905. Stop-loss should be placed above 1.0945. Closet target has to be at 1.0830. Scenario will be cancelled if price will retrace to 1.0985.
RoboForex Analytical Department
For the present moment, price of USDCAD had achieved "selling area" and now it's possible to open positions with a pretty tight stop. The model itself is built in ideal way, according to all required rules.
Point "B" is located on the level of projection 1.13. of XA, point C had tested required projection 1.618 from BC, point D is located on the level formed by 50% correction of BC. Beyond that, we observe almost equal moves AB and CD (in time and price measurement). This model is described by Bryce Gilmore and points that local low should be tested with further descending trend. To identify closest target for current decline, we can take XA move and project it from D point. Therefore we can expect synnetrical decline to 1.0655 area.
Additional signal for short positions is "Head and Shoulders" on MACD, in most cases such patterns work quickly and accurately. Here we have already seen signal for short when signal line has emerged from indicator's histogram.
Even if we look at this chart, we can find a reversal pattern. If acting aggressively, we can try to sell from the "shoulder" and add to short positions when "neck" line is violated. Of we can trade conservatively and wait for breakout of 1.0905. Stop-loss should be placed above 1.0945. Closet target has to be at 1.0830. Scenario will be cancelled if price will retrace to 1.0985.
RoboForex Analytical Department
Attention!
Forecasts presented in this section only reflect the author’s private opinion and should not be considered as guidance for trading. RoboForex bears no responsibility for trading results based on trading recommendations described in these analytical reviews.