Technical Analysis 23.08 (Index USD, EUR/USD, GBP/USD, NZD/USD, AUD/USD)
Index USD
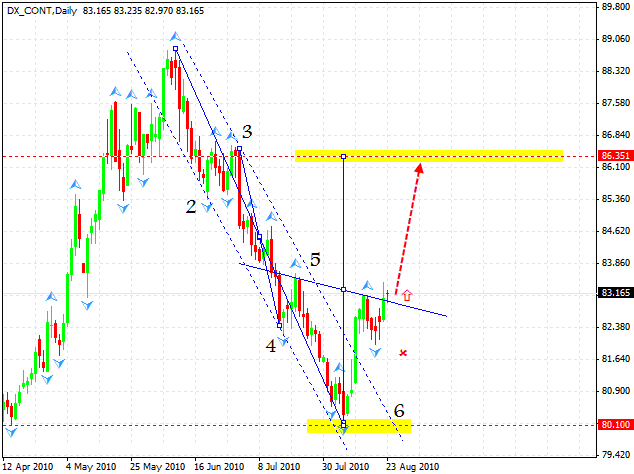
In my opinion, we should analyze the USD index to get a complete idea of a range of currencies. As we can see, the price, after it had formed a descending pattern, broke the channel; then we had a classic return to the level where the channel was broken, and currently the price has reached new maximum, which is higher than the previous one. Again we have a classic example of change of a trend. Here we have “head & shoulders” reversal forex online trading pattern forming with the target in the area of 86.35. The fall lower than the “shoulder” level of 81.45 will lead to the situation when this case scenario will be cancelled.
EUR/USD
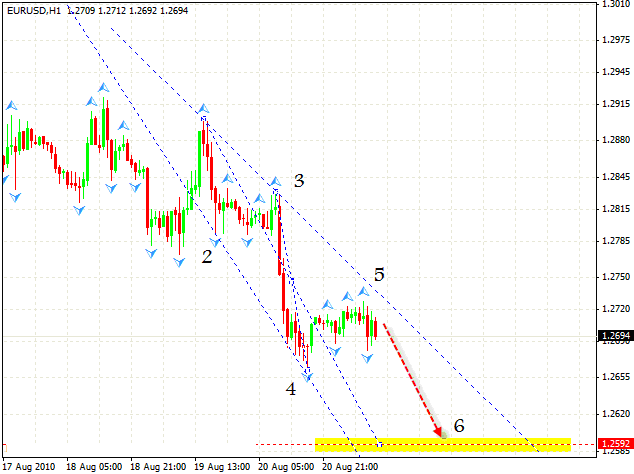
In case of Euro we can see descending expansion pattern with the target in the area of 1.2592. One can try to sell with the stop above 1.2730, but should move stop loss into the black as soon as possible.
GBP/USD
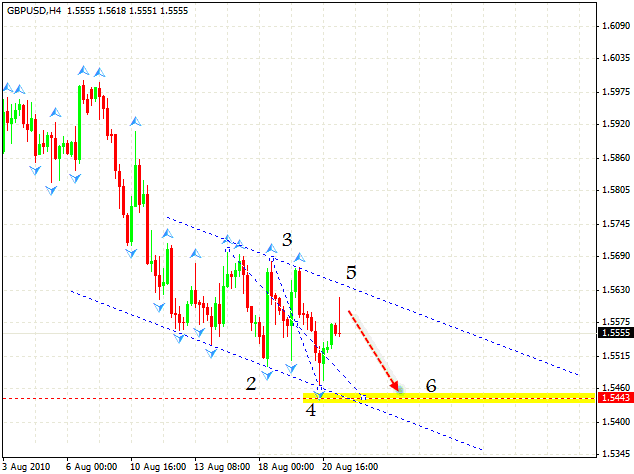
The “triangle” was not completely formed, but the Pound Is still pointed downwards, so we can try to sell. As can be seen, there is a descending pattern with the target of 1.5443. In fact, after the USD index analysis one can sell everything.
NZD/USD
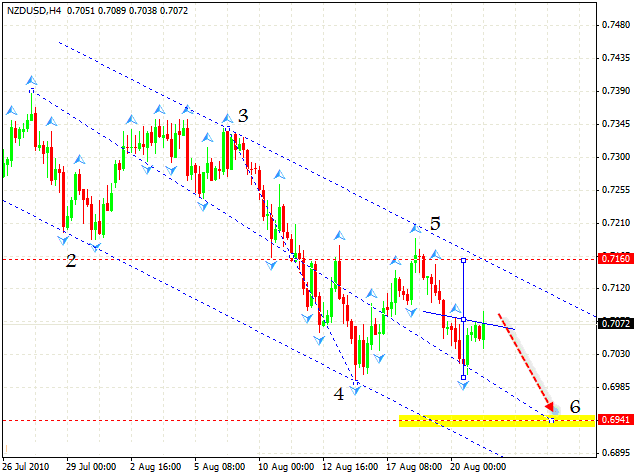
Although in case of New Zealand Dollar we can see a “head & shoulders” reversal pattern, I hardly believe that it will be completely formed. We have a descending pattern with the target in the area of 0.6941, so let’s use this pattern. Also we can try tight stop sales.
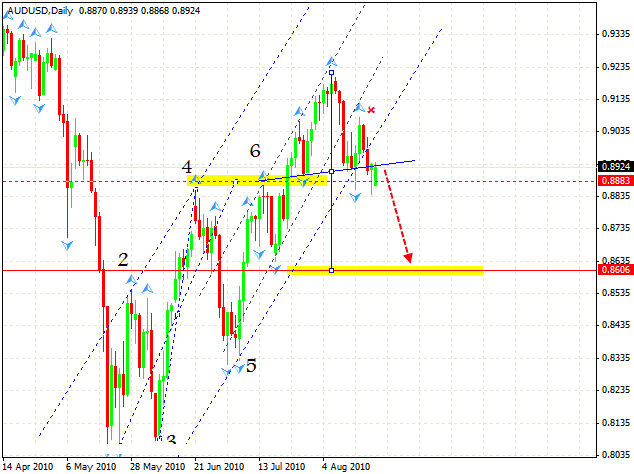
AUD/USD
Australian Dollar is testing the broken neckline. We can start selling right at this point, in this case we must hide stop above 0.91; the target is in the area of 0.8606. We should not expect the second test of the neckline, probably the line will be broken and the pair will grow even further, so in case of the fall we must move the stops into the black.
Forecasts presented in this section only reflect the author’s private opinion and should not be considered as guidance for trading. RoboForex bears no responsibility for trading results based on trading recommendations described in these analytical reviews.
