Bill Williams’ Indicators Analysis 19.04.2013 (USD/CAD, NZD/USD)
19.04.2013
Analysis for April 19th, 2013
USD/CAD
At the H4 chart of the USD/CAD currency pair, the Alligator is moving upwards. The price finishing a bullish fractal; but the indicators are in the red zone; there is a Squat bar on the MFI. I’ve moved my protective stop closer to the level of the Alligator’s teeth.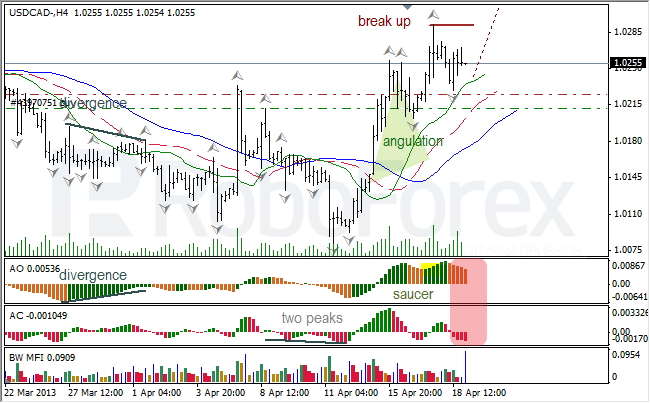
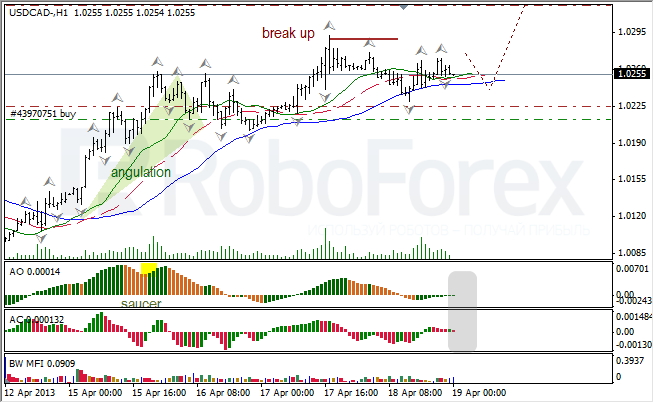
At the H1 chart of the USD/CAD currency pair, the Alligator, after moving upwards for a while, went to sleep. The indicators are in the grey zone; there are Squat bars on the MFI. I’m keeping my buy order opened.
NZD/USD
At the H4 chart of the NZD/USD currency pair, the Alligator is opening its mouth downwards. The price is finishing a bearish fractal; the indicators are in the grey zone; there are Squat bars on the MFI. I’ve moved a protective stop closer to the Alligator’s teeth and placed Take Profit.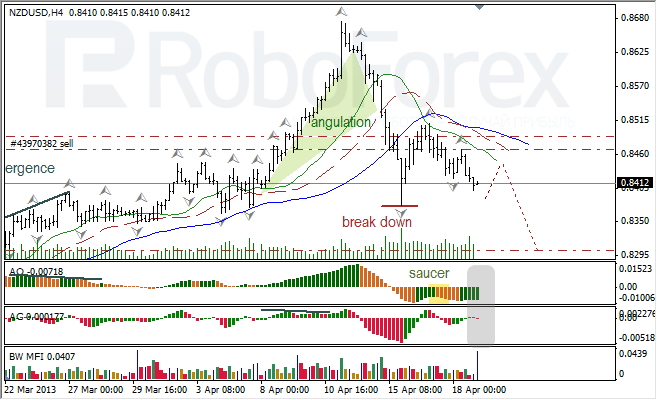
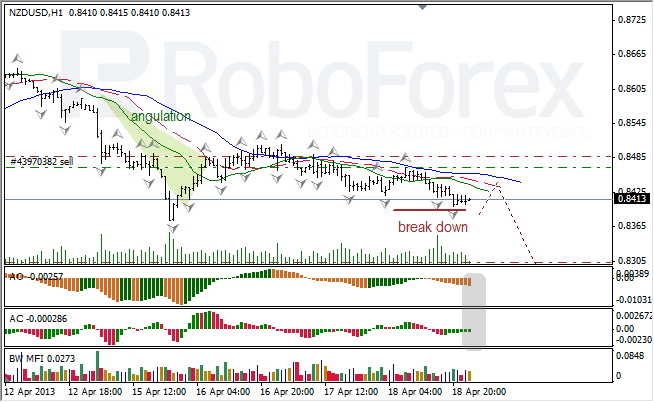
At the H1 chart of the NZD/USD currency pair, the Alligator is waking up downwards. AO and AC indicators are in the grey zone (directed in different directions); there is a Squat bar on the MFI. I’m keeping my order with the target below a bearish fractal opened.
RoboForex Analytical Department
Attention!
Forecasts presented in this section only reflect the author’s private opinion and should not be considered as guidance for trading. RoboForex bears no responsibility for trading results based on trading recommendations described in these analytical reviews.