Bill Williams’ Indicators Analysis 02.05.2014 (USD/CAD, NZD/USD)
02.05.2014
Analysis for May 2nd, 2014
USD CAD, “US Dollar vs Canadian Dollar”
At H4 chart of USD CAD, Alligator is moving downwards. Price completed bearish fractal below Alligator’s mouth; AO and AC are in grey zone; there might be Squat bar on the MFI. Bullish fractal may reach Alligator’s jaw (blue line).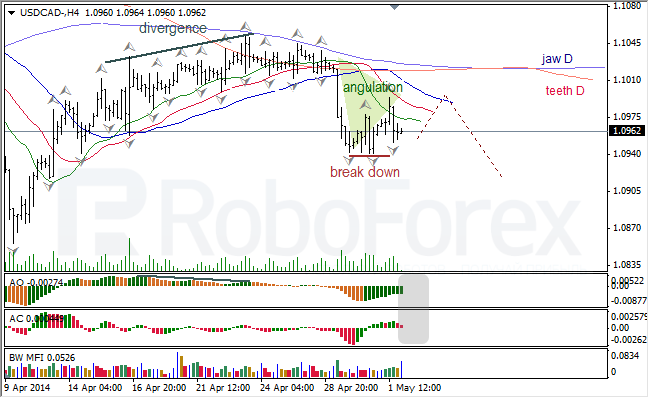
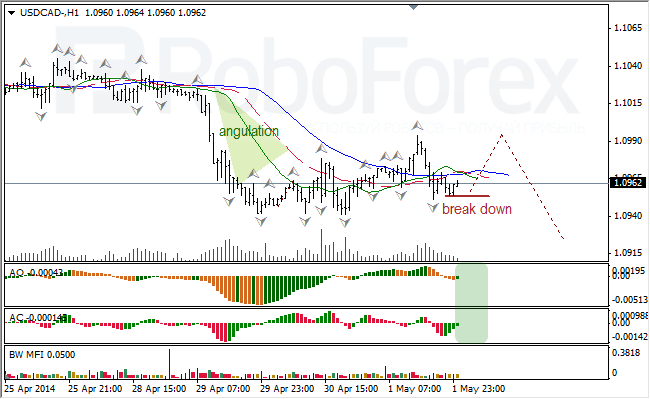
At H1 chart of USD CAD, Alligator is sleeping. Price is forming bullish fractal; indicators are in green zone; there is Squat bar on the MFI. Bullish fractal may break Alligator’s jaw (blue line) upwards.
NZD USD, “New Zealand Dollar vs US Dollar”
At H4 chart of NZD USD, Alligator reversed northwards. Price is forming bullish fractal; AO and AC are in grey zone; there might be Squat bar on the MFI. Price is expected to complete bullish fractal.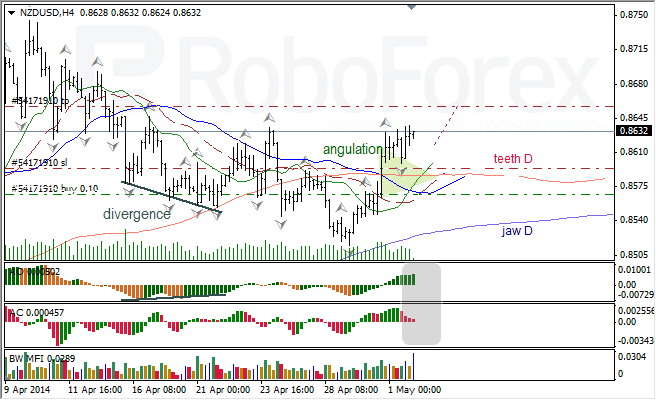
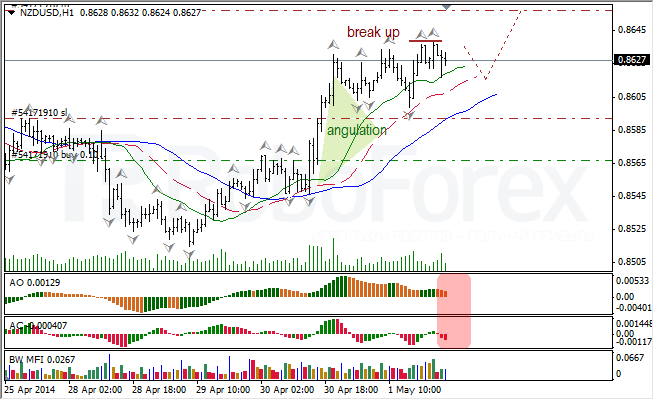
At H1 chart of NZD USD, Alligator is moving upwards. AO and AC are in red zone; there is Green bar on the MFI and might be Squat one too. Bearish fractal may reach Alligator’s teeth, and then I expect breakout of fractal to the upside.
RoboForex Analytical Department
Attention!
Forecasts presented in this section only reflect the author’s private opinion and should not be considered as guidance for trading. RoboForex bears no responsibility for trading results based on trading recommendations described in these analytical reviews.