Bill Williams’ Indicators Analysis 21.07.2014 (USD/CAD, NZD/USD)
21.07.2014
Analysis for July 21st, 2014
USD CAD, “US Dollar vs Canadian Dollar”
At H4 chart of USD CAD, Alligator is sleeping. Indicators are in grey zone; there is Fade bar on the MFI and might be Squat one too. After two fractals equidistant from Alligator’s mouth, I expect breakout of fractals to the upside towards D Alligator’s jaw.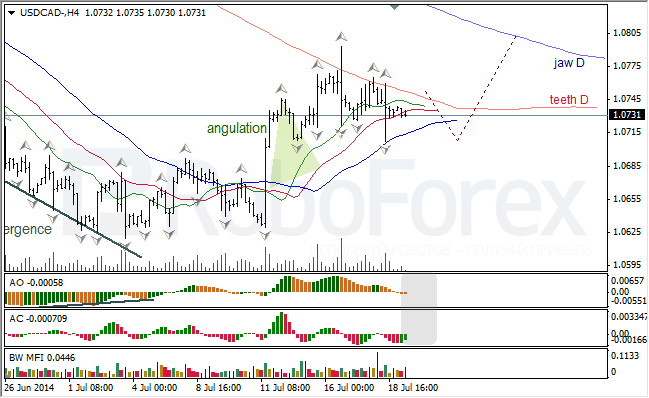
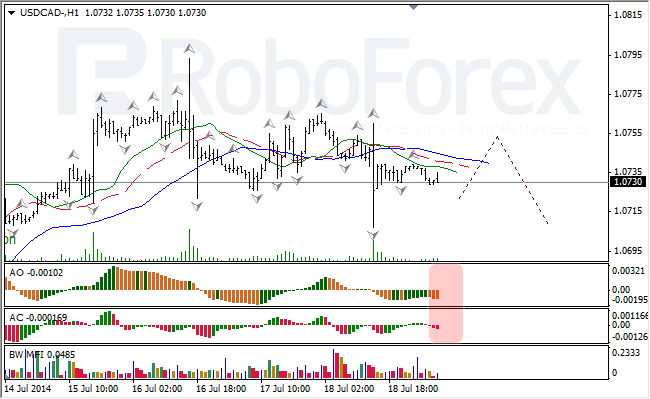
At H1 chart of USD CAD, Alligator started falling down slowly. AO and AC are in red zone; there is Fade bar on the MFI and might be Squat one too. After two fractals equidistant from Alligator’s mouth, I expect breakout of fractals to the downside.
NZD USD, “New Zealand Dollar vs US Dollar”
At H4 chart of NZD USD, Alligator is slowing down a little bit near D Alligator’s teeth. Pair is forming bullish fractal; AO and AC are in green zone; there is Squat bar on the MFI. Bullish fractal may reach Alligator’s jaw (blue line), and then I expect breakout of fractals to the downside towards D Alligator’s jaw.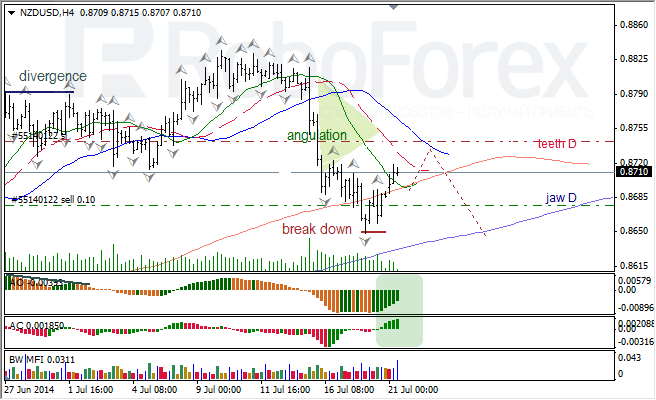
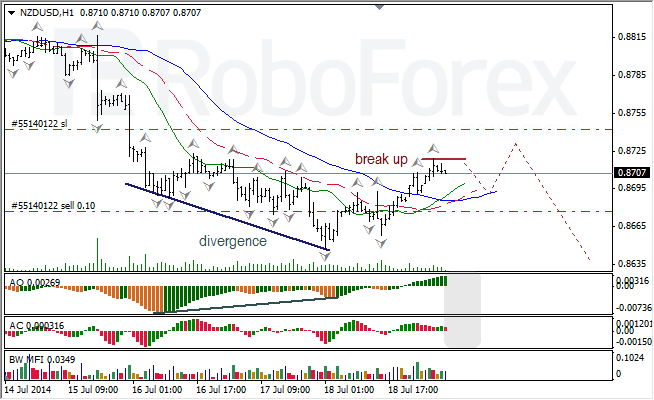
At H1 chart of NZD USD, Alligator reversed upwards. AO and AC are in grey zone; there is Green bar on the MFI and might be Squat one too. After slight breakout of fractals to the upside, I expect breakout of fractals to the downside.
RoboForex Analytical Department
Attention!
Forecasts presented in this section only reflect the author’s private opinion and should not be considered as guidance for trading. RoboForex bears no responsibility for trading results based on trading recommendations described in these analytical reviews.