Bill Williams’ Indicators Analysis 02.08.2013 (USD/CAD, NZD/USD)
02.08.2013
Analysis for August 2nd, 2013
USD/CAD
At the H4 chart of the USD/CAD currency pair, the Alligator is sleeping. The price broke the Alligator’s jaw (blue line) upwards; the indicators are in the grey zone; there is a Fade bar on the MFI. I’m staying out of the market until the price completes a bearish fractal.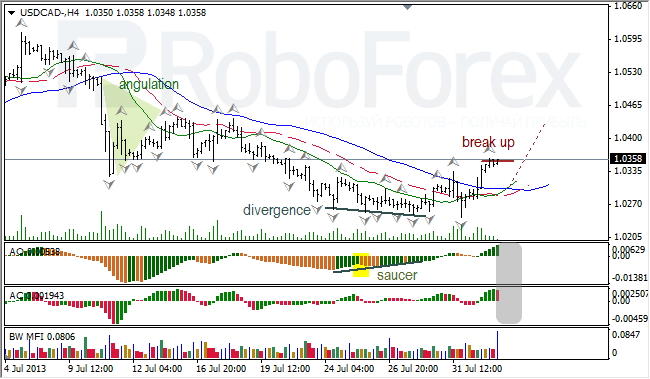
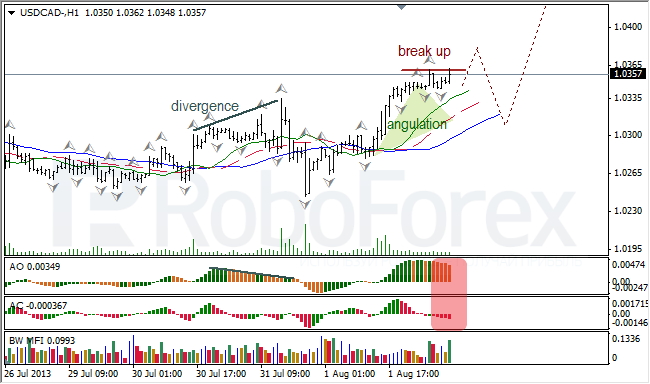
At the H1 chart of the USD/CAD currency pair, the Alligator is moving upwards. The indicators are in the red zone; there is a Fade bar on the MFI. After closing the angle of angulation, the price is expected to start moving upwards.
NZD/USD
At the H4 chart of the NZD/USD currency pair, the Alligator is moving downwards. The price is forming a bullish fractal; AO and AC indicators are in the grey zone; there is a Green bar on the MFI and might be a Squat one too. I’m keeping my sell order; a protective stop is near the Alligator’s teeth (red line).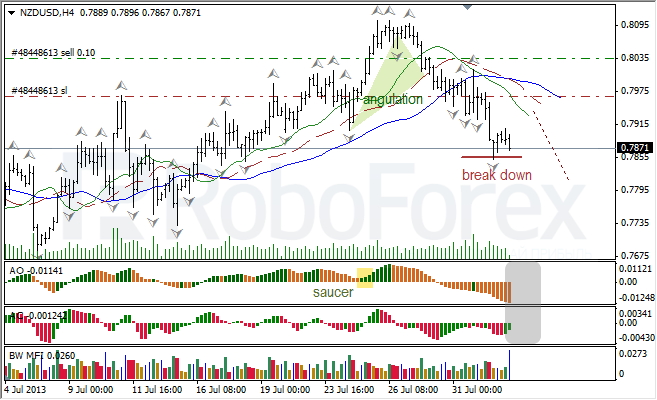
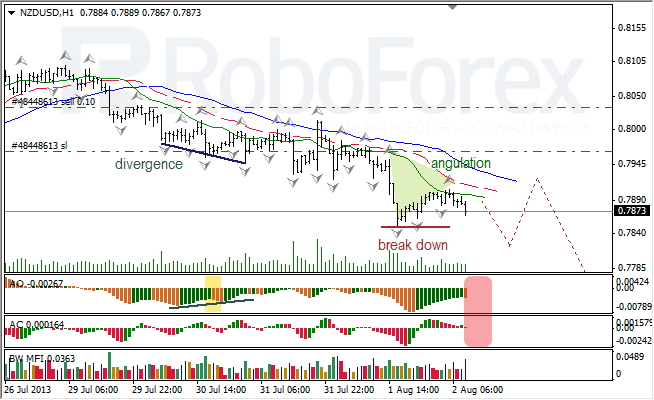
At the H1 chart of the NZD/USD currency pair, the Alligator is slowly moving downwards. The indicators are in the red zone again; there is a Squat bar on the MFI. The price is expected to break bearish fractals again.
RoboForex Analytical Department
Attention!
Forecasts presented in this section only reflect the author’s private opinion and should not be considered as guidance for trading. RoboForex bears no responsibility for trading results based on trading recommendations described in these analytical reviews.